Isolation of rat BM-resident c-kit+ cells
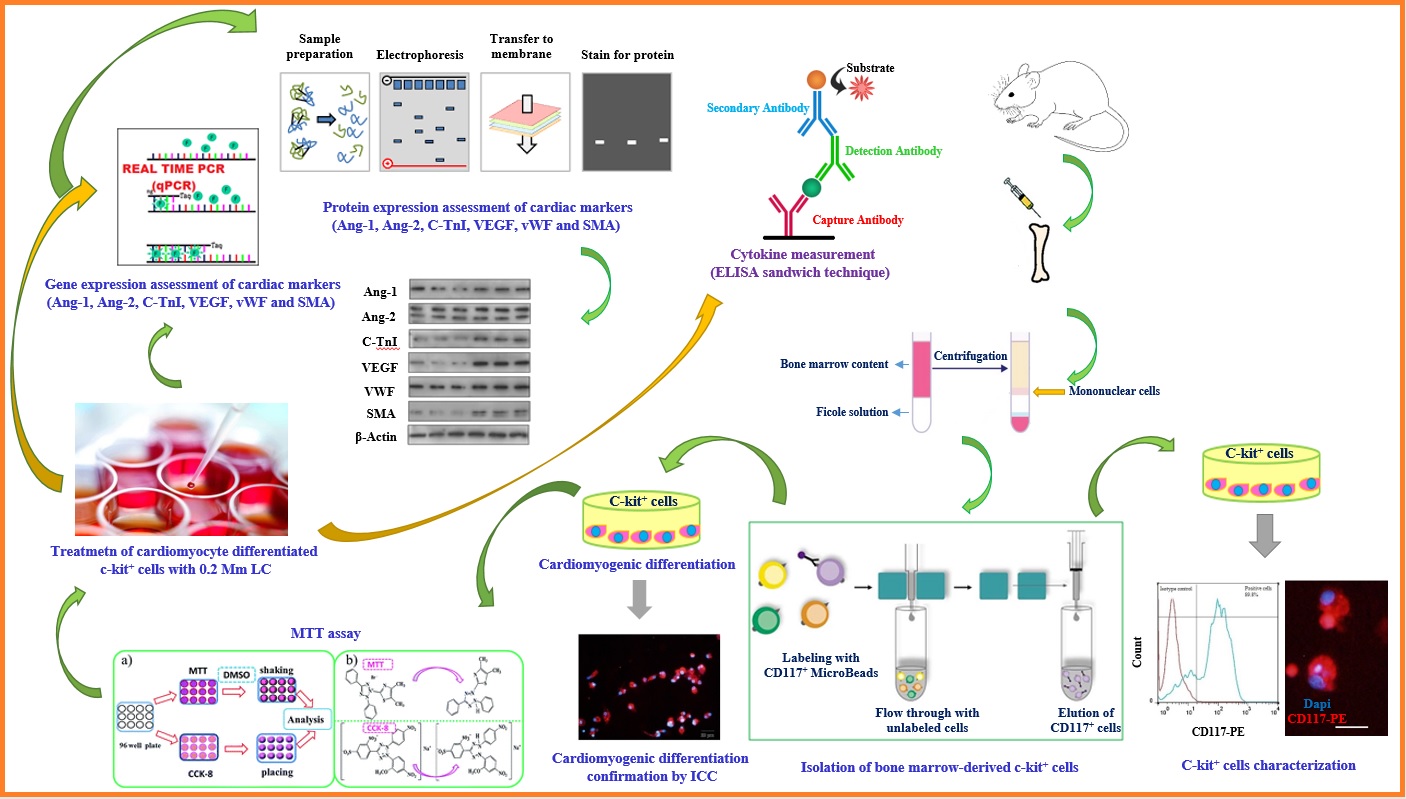
C-kit+ (CD117+) cells were isolated from BM of About 8 (5- to 8-week-old) rats by positive selection with anti-CD117 MicroBeads. Rats were euthanized and mononuclear cells (MNCs) were isolated as previously reported by Fathi et al. (2019) [44]. The isolated MNCS was incubated with 100 µl of CD117+ micro beads (Miltenyi Biotec, Germany; Cat no: 130-091-224) for 30 minutes. Thereafter, re-suspended cells were passed through one LS MACS column (Miltenyi Biotec, Germany) and enriched CD117+ cells were retrieved by flushing the column [45].
Purity Assessment Of BM-resident C-kit Cells
Purity assessment of enriched cells was done by flow cytometry. Briefly, approximately 20 × 104 enriched BM-resident c-kit+ cells were incubated with 5 µl of FITC-conjugated antibody CD117 (c-kit) (Biocompare, Lifespan BioSciences, USA) (1 µg/106cells) for 30 min on ice and subjected to fluorescence activated cell sorter (FACS) instrument (Becton Dickinson Franklin Lakes, USA) [44]. The output data were processed with FlowJo software version X.0.7. In addition to flow cytometry, immunocytochemistry (ICC) was done. The protocols used for ICC was described below in the immunofluorescence staining. Also, the antibody used for ICC was PE-conjugated c-Kit/CD117 antibody (LS-C78828, Lifespan Biosciences, Inc., USA).
Cardiomyogenic Differentiation Of BM-resident C-kit Cells
Cardiomyogenic differentiation of BM-resident c-kit+ cells were induced by cardiomyocyte differentiation medium (Millipore-Sigma, USA; Cat no: SCM102). For this purpose, 10 × 105 BM-resident c-kit+ cells/6-well plates were cultured in cardiomyocyte differentiation medium for 14 days. The medium was refreshed with fresh cardiomyocyte differentiation medium three times per week. Cardiomyocyte induction was confirmed by immunocytochemistry (ICC).
Immunofluorescence Staining
ICC was done as previously reported by Fathi and Farahzadi (2018) [46]. In brief, a total of 4 × 10³ BM-resident c-kit+ cells were plated in chamber slide containing cardiomyocyte differentiation medium for 14 days. The control group was assessed in the absence of cardiomyocyte differentiation medium. At the end of 14th days incubation, the cells were fixed in 4% paraformaldehyde for 30–60 min at 25o C. In the following, the cells were incubated 16 hours at 4ºC with mAbs against α-actinin and desmin (all from cardiomyocyte characterization kit, Chemicon International, USA; Cat no: SCR059) in PBS. The cells were then incubated with a goat anti-mouse IgG-PE as secondary antibody (sc-3738, Santa Cruz Biothecnology, USA) for 2 h. Then, cells were washed with PBS and nuclei were stained with DAPI at 30 sec. After washing, the fluorescent cells were visualized under a fluorescence microscope.
Cell Proliferation Assay
The MTT test was done to define proper concentration of LC. BM-resident c-kit+ cells were seeded at 2 × 10³ cells/wells. In the following, LC was used at final concentrations of 0.1, 0.2 and 0.4 mM and incubated under the same culture conditions for 7, 14 and 21 days. At the end of incubation time (7, 14 and 21 days), the culture media was removed and MTT dye solution was added for 4 h. At the end of 4 h, the MTT solution was removed and formazan crystals were dissolved in DMSO. The optical density of each well was measured at a wavelength of 570 nm by an ELISA reader (Labsystems, Helsinki, Finland) [18].
In this study, the cells were divided two groups: group I as control group (cardiomyogenic differentiated BM-resident c-kit+ cells without any LC treatment) and group II as experimental group (cardiomyogenic differentiated BM-resident c-kit+ cells with LC treatment). The treatment period in both control and experimental groups was 14 days.
Western Blot Analysis For Protein Expression Assessment
BM-resident c-kit+ cells from both control and experimental groups were collected and protein was extracted as previously explained by Valipour et al. (2018) [47]. 50 µg of each cell protein sample was electrophoresed on 12% polyacrylamide slab gels and transferred to poly vinylidene difluoride (PVDF) membrane. In the following, the membranes were incubated overnight at 4 °C with primary polyclonal antibodies (1:1000) against β-actin (sc-69879), Angiopoietin-1 (Ang-1) (sc-517593), Angiopoietin-2 (Ang-2) (sc-74403), Cardiac Troponin-I (C-TnI) (sc-133117), VEGF (sc-7269), von Willebrand Factor (vWF) (sc-365712) and SMA (sc-53015), and were incubated with goat anti-mouse secondary antibody for 60 min at 25 °C. Next, the membranes were washed and protein bands were detected using ECL with X-ray film. The intensity of protein bands was measured by ImageJ 1.6 software. All used antibodies were obtained from Santa Cruz Biotechnology, USA.
Quantitative Real Time-PCR
The BM-resident c-kit+ cells from both control and experimental groups were collected. Next, total RNA was extracted and cDNA was synthesized using molecular kits (Yekta Tajhiz Azma, IRAN). The mRNA expressions of target genes included Ang-1, Ang-2, C-TnI, VEGF, vWF, SMA and β-actin. Fluorescence data was calculated in relation to β-actin CT values by the 2−ΔΔCT method. Primers (Table 1) were designed using Oligo 7 v.7.52 software [18].
Table 1
Primer sequences used for the Real time-PCR assays
| No. | Gene | Primer pair sequence (5'-3') | Product length (bp) |
| NM_001146.5 | Ang-1 | CTCGCTGCCATTCTGACTCAC | 136 |
| XM_017013318.1 | Ang-2 | TCTTGGCCGCAGCCTATAAC TGCTGGACCTGATATTGCTTCT | 73 |
| XM_006716677.4 | C-TnI | GCAGGTGAAGAAGGAGGACA CGATATTCTTGCGCCAGTC | 139 |
| NM_001204384.1 | VEGF | ATCACGAAGTGGTGAAGTTC TGCTGTAGGAAGCTCATCTC | 117 |
| NM_000552.4 | vWF | GCAGTGGAGAACAGTGGTG GTGGCAGCGGGCAAAC | 134 |
| NM_001613.4 | SMA | | | ATCACCAACTGGGACGACAT CATACATGGCTGGGACATTG | | 175 |
| NM_001101.5 | β-actin | TCCTCTCCCAAGTCCACACAGG GGGCACGAAGGCTCATCATTC | 131 |
Cytokine Measuring By ELISA
Culture media was collected from each group including, control group without any LC treatment, and experimental group with LC treatment. ELISA was performed according to the manufactures guidelines (R&D Systems, China). In brief, a 96-well plate was coated with detection Reagent A at 4◦C for 16 hours. Then, 50 µl of cell culture media was added into the 96-well plate, which had been coated with mouse interleukin (IL)-6, insulin-like growth factor (IGF-1), transforming growth factor-β (TGF-β) and vascular endothelial growth factor (VEGF) antibodies, and detected via the ELISA sandwich technique.
Statistical analysis
The results from Figs. 3 and 6 were analyzed using two-way ANOVA followed by Sidak’s multiple comparisons test. The results from Figs. 4 and 5 were analyzed using Unpaired t-test. The statistical significance was determined at p < 0.05 by Graph Pad Prism version 6.01. All experimental procedures were repeated for three times (n = 3).