3.1. Mass loss in relation to fungi and wood species
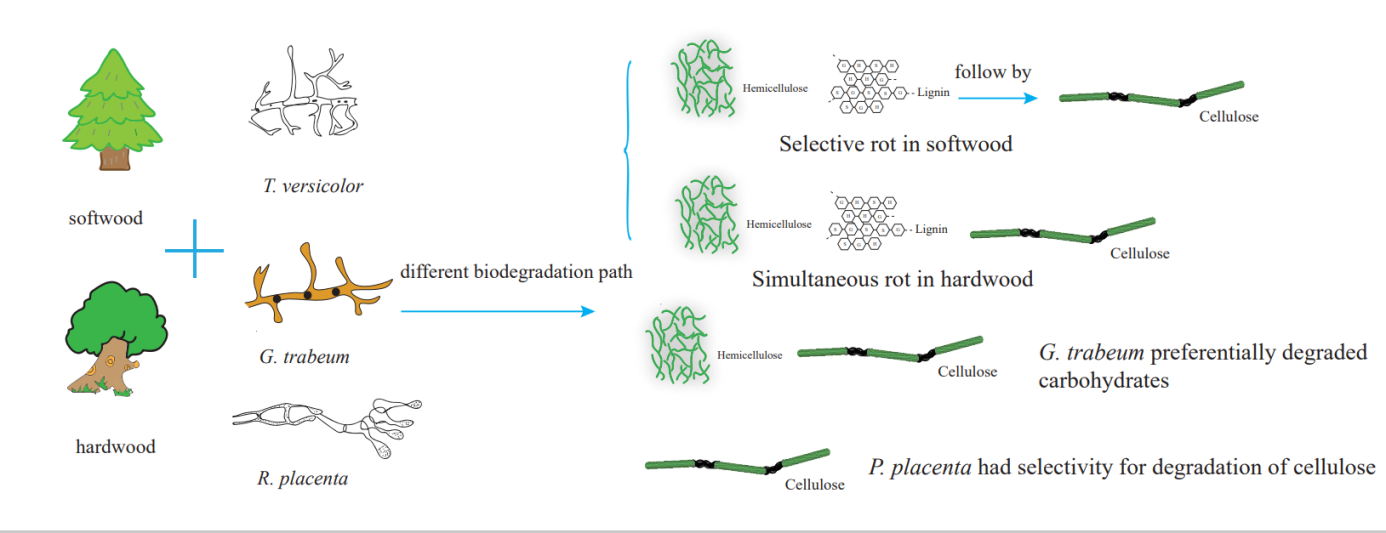
Mass losses of wood samples in different decay periods are summarized in Table 1. It can be seen that the mass losses of softwoods were higher decayed by both two brown rot fungi than white rot fungi, with the mass losses of 28.59% and 36.19% decayed by G. trabeum and R. placenta respectively compared to 13.09% decayed by T. versicolor in pinus wood, and 66.52% and 45.87% decayed by G. trabeum and R. placenta respectively compared to 35.57% decayed by T. versicolor in C. lanceolata wood. In contrast, the mass losses of hardwoods decayed by white rot fungi exceeded that of brown rot fungi, which the mass loss was 40.75% decayed by T. versicolor compared to 32.65% and 19.05% decayed by G. trabeum and R. placenta in H.brasHiensis, as well as the mass loss was 80.88% decayed by T. versicolor compared to 65.54% and 36.88% decayed by G. trabeum and R. placenta in Populus wood. This discrepancy could be ascribed to the different types of lignin, in which there are guaiacyl lignin and syringyl lignin, and as such more methoxyl groups in hardwood were more easily degraded (Brischke & Hanske, 2016; Liu, Zhong, Ma, & Liu, 2018; Pointing, Parungao, & Hy De 2003). Therefore, softwood could possess more resistance against white rot fungi, which mainly decay lignin, as the softwood only contains guaiacyl lignin type and more lignin content as given in Table 2, which compiled from literatures. Therefore, the brown rot fungi were clearly more vigorous and aggressive than white rot fungi to softwood species, opposed to that the degradation ability of white rot fungi to hardwood was stronger than that of two brown rot fungi. Collectively, it could be suggested that there were different biodegradation paths between soft and hard wood, contributed by different chemical compositions between softwoods and hardwoods (Nannan, 2019; Pingping, Yichao, Can, & Qijun, 2012; Yuhui, Liang, Yaoli, & Xinzhou, 2020; Zongde, Guorong, & Jinyun, 2001).
Furthermore, it was worth mentioning that Pinus was more resistant to decay than C. lanceolata in softwood group and H. brasHiensis also exhibited more resistance than Populus in hardwood group, due to the noticeable variety in the densities from the wood tree-species (Knapic, Pirralho, Louzada, & Pereira, 2014), as shown in Table 3, in which the densities of Pinus and H. brasHiensis were higher than C.lanceolata and Populus respectively, with the densities were 0.472g/cm3 and 0.401g/cm3 in softwood group, and 0.650g/cm3 and 0.364g/cm3 in hardwood group respectively. This indicates that the density could be a factor, which influences the resistance performance of wood against decay fungi, as the loose fiber structure means that the cell micropores were large to be penetrated and eroded accordingly by fungi more easily (Sasaki & Yamanaka, 2020; Zhenfu, Biao, Buyun, Xuefeng, & Shiyu, 2012).
3.2. Chemical variation of woods after selective fungi attacks
To analyze the changes of chemical characterization, the FT-IR spectra of the samples are presented in Fig. 1. In the softwood group, when samples were exposed to white rot fungi T. versicolor, the absorption peaks at 1735 cm-1, 1510 cm-1 and 1266 cm-1 shifted to lower wavelength before 8 weeks decay, manifesting T. versicolor initially degraded hemicellulose and lignin, while cellulose was retained, which caused selective rot. The reason for the selective rot of softwood was that the tough S3 layer of the tracheid cell wall prevented the mycelium developing outward from the lumen, as the concentration of lignin in S3 was much lower than other regions of the cell wall structure, leading to preferential degradation of lignin (Goodell, 2003; Tamburini et al., 2017). In brown rot fungi, the bands at 1735 cm-1 and 1042 cm-1 decreased at 8 weeks, indicating polysaccharides were preferentially degraded.
In hardwood samples, the absorption peak at 1735 cm-1 was reduced at 4 weeks decay, the bonds at 1510 cm-1, 1245 cm-1 and 1045 cm-1 were decreased after T. versicolor decayed for 8 weeks, showing hemicellulose degraded preferentially in the early stage, followed by lignin and cellulose, which caused simultaneous rot in both hardwood samples. It could explain that the branched chain structure of hemicellulose was more easily eroded by fungi in the initial stage, which might lead to breakup of lignin-carbohydrate complex bonds that linking hemicellulose and lignin (Eller, Kirker, Mankowski, Hay, & Palmquist, 2020), contributing to the easy structural destruction of lignin with the decay stage prolonged. In two brown rot fungi, the absorption peaks at 1735 cm-1, 1400 cm-1 and 1042 cm-1 were reduced at 4 weeks decay, the bands at 1626 cm−1 and 1245 cm−1 decreased after 8 weeks decay, suggesting that fungi could degrade the polysaccharide initially, followed by the lignin in advanced stage (Shi, Xing, & Lia, 2012; Xia et al., 2018).
3.3. Change in crystallinity
The crystallinities of woods after fungi attack are determined by XRD and the results are depicted in Fig. 2, which can also be corresponded to the mass losses (Table 1). An obvious trend was observed that crystallinities of woods exposed to white rot fungi T. versicolor elevated during the decay stage, with the crystallinities increasing by 11.17% in pinus and 16.90% in populus. The main reason is that the amorphous structures of hemicellulose and lignin, especially the hemicellulose with many branched chains, could be easily eroded and deconstructed by white rot fungi, which can secret the oxidase, such as laccase, Li-peroxidase and Mn-Peroxidase, leaving relatively higher concentration of structured cellulose and hence resulting in relatively increased crystallinity.
Both brown rot fungi exposure resulted in continuous decrease in the crystallinities of wood samples during the decay period. As only cellulose has crystalline structure among the three main chemical compositions of wood, this trend obtained from crystallinities suggests that cellulose may be degraded and deconstructed more seriously compared with hemicellulose and lignin.(Z. Bi, Zhao, Morrell, Lei, & Yan, 2021). Notably, the crystallinities of H.brasHiensis and Populus exposed to R. placenta decreased from 30.26% and 22.97% to 28.25% and 18.49% at 4 weeks respectively, while the mass loss was only 0.08% and 0.38%. This phenomenon implied that R. placenta had selectivity for deconstruction in cellulose, and it was in the reproducing and growing state in the initial stage, but they could already impact and even decompose cellulose macromolecules, contributing to the decrease of polymerization degree (GQ et al., 2013; Zhang, LM, You, TT, & Zhou, 2016).
3.4. XPS spectroscopy analysis
In order to obtain the surface chemical composition, XPS analysis was carried out to investigate the changes of carbon atoms C1-C3, and results are portrayed in Fig. 3 and Table 4. It can be seen that for the white rot fungi exposure, whether softwood or hardwood, the ratio of C1 decreased, which mainly came from lignin and wood extract, while the ratio of C2 increased, which has been proved to be mainly from cellulose due to a carbon bound to a single noncarbonyl oxygen atom (Viltres, Odio, Lartundo-Rojas, & Reguera, 2020). For the brown rot fungi exposure, the results were in an opposite situation. It can be inferred that the white rot fungi mainly attacked lignin, whereas the brown rot can easily degrade cellulose compared to lignin both in hardwood and softwood, owning to that white rot fungi can secret lignin enzymes, such as laccase, Mn-peroxidase and Li-peroxidase to degrade lignin, while brown rot fungi can mainly secret hydrolases but lack the ability to secrete lignin enzymes. Therefore, it can selectively degrade carbohydrates (E. Bari et al., 2019; Kocaefe, Kocaefe, Boluk, & Krause], 2013; Okello, Mwilu, Noah, Zhou, & Sadik, 2012; Peng, Wang, Zhang, Wang, & Cao, 2021; Viltres et al., 2020; Zhidkov, Boukhvalov, Akbulatov, Frolova, & Kurmaev, 2021). In addition, the ratio of C2 decreased more obvious in R. placenta than in G. trabeum, and it also proved that R. placenta could decompose cellulose selectively, which is in agreement with the results in XRD analysis.
3.5. Microstructural change and mycelial distribution
The microstructural changes in wood cell walls and the mycelial distribution observed through fluorescence microscope and SEM showed that at the beginning, mycelium appeared in the vessels and spread to the fibers as the time increases for all three fungi (Fig. 4 and Fig. 5), then invading the membrane of the pits and damaging the cell wall during the degradation process. In all wood samples, it can be observed that fungi already colonized in cell lumens attacked by white rot fungi T. versicolor for only 4 weeks due to the conspicuously present hyphae in the lumina, and hyphae appeared in clusters after 8 weeks. Furthermore, the fluorescence intensity also dimmed compared with the sound wood. It can infer that T. versicolor grew along cell lumens during its colonization and the lignin can be decomposed as well (Zhenju Bi et al., 2022). For the brown rot fungi exposure, the fluorescence intensity weakened and the cell wall became thinner at 16 weeks, implying lignin can be modified at advanced decay stages (Kocaefe et al., 2013). In addition, a large number of pits in cross field were destroyed, indicating fungi were more likely to grow and reproduce in the cross field, resulting in the destruction of the pits. Furthermore, it was found that fungi attacked to parenchyma cells via pits and the wood rays were the primary paths for the spread of mycelium (Peng et al., 2021).
To understand the underlying mechanism of the transitions of chemical compositions in wood cell walls more clearly, the technique of Confocal Raman Microscopy was performed in this current work. Confocal Raman Microscopy can provide an intuitionistic observation of lignin and carbohydrates in cell walls with a high resolution, which is crucial to the understanding of the interaction mechanism between fungi and wood components. As shown in Fig. 6 and 7, in wood samples decayed by white rot fungi, the reduction of lignin distribution concentration was severe, while carbohydrates retained. Contrary to the distribution of lignin and carbohydrates decayed by white rot fungi, both brown rot fungi exposure resulted in obvious and extensive degradation of carbohydrates in cell walls due to the relatively low content of carbohydrates distribution, while the lignin concentrations were relatively increased, indicating that brown rot fungi had a preferable ability on degradation in carbohydrates. Results in this part are consistent with conclusions aforementioned.