Sand fly distribution and species collections
In this study, 12 species of sand flies belonging to 8 species for genus Phlebotomus and 4 species for genus Sergentomyia, were identified (Table 1, Additional file 2: Table S1). A total of 1167 sandflies (283 males and 884 females) were collected utilizing CDC light traps, sticky traps, aspirators and, funnel traps from three climate zones including six districts (Table 1, Additional file 2: Table S1, Additional file 3: Figure S2).
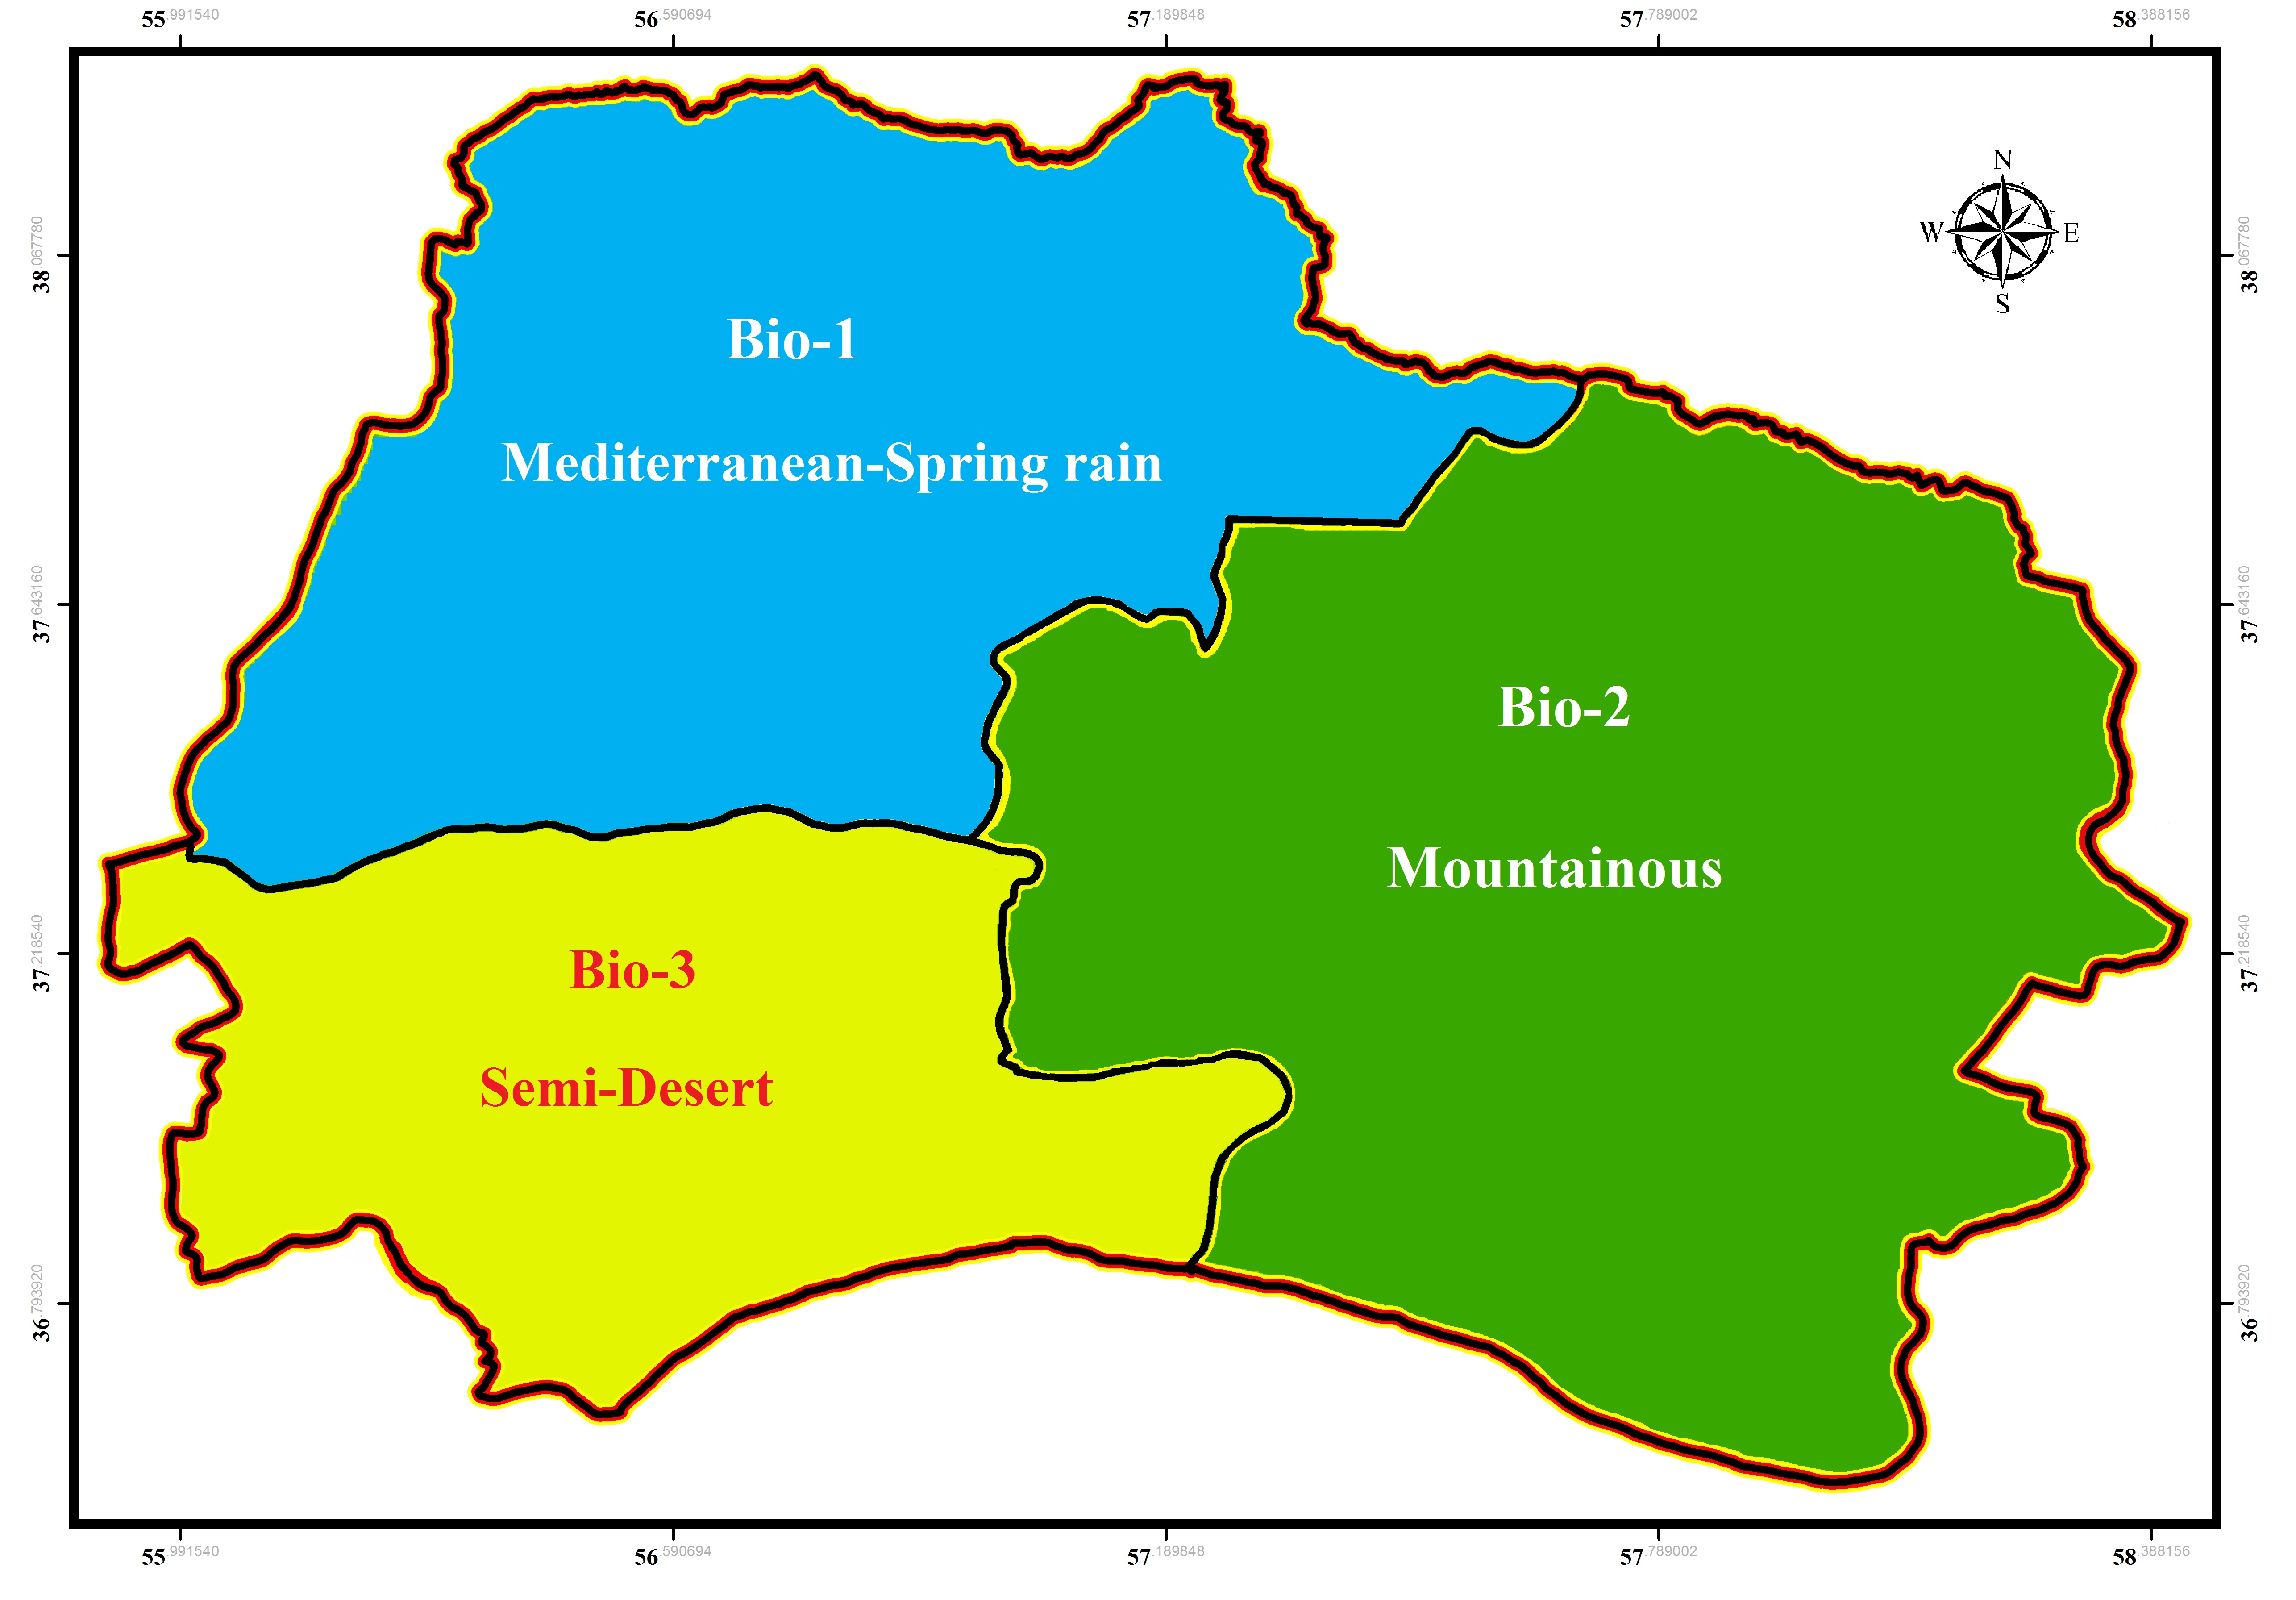
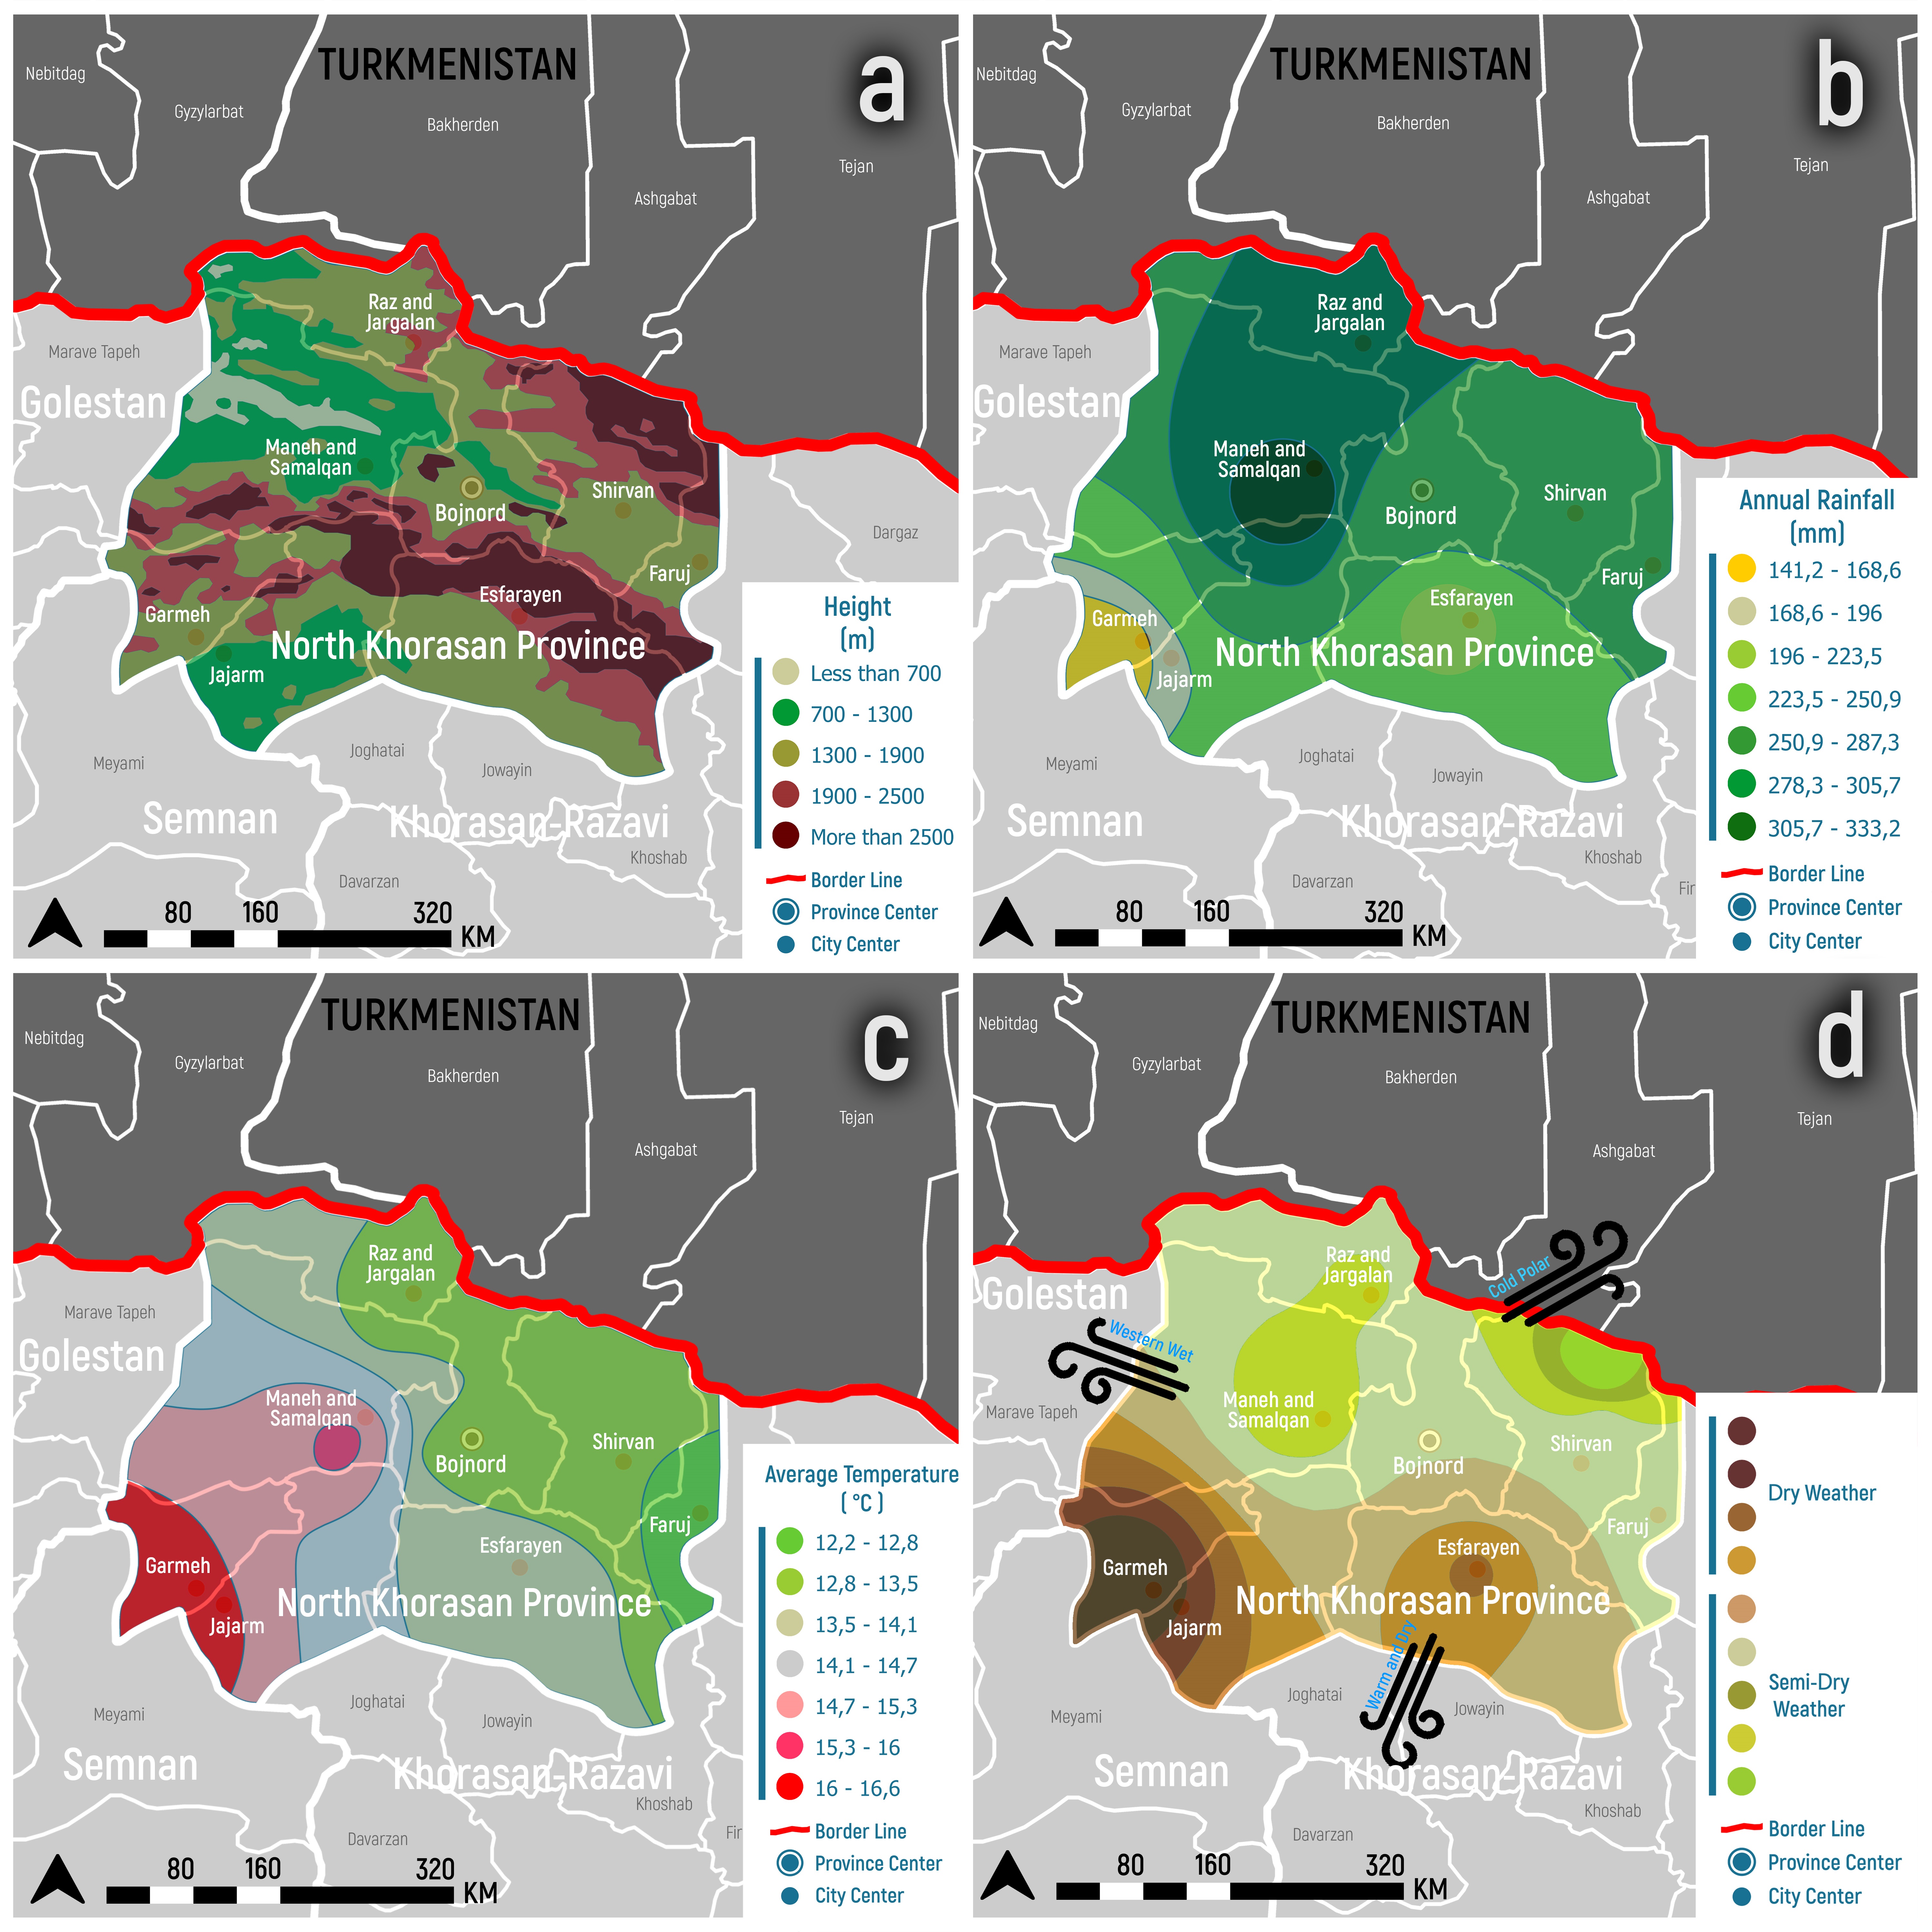
We analyzed the expression of SP15, protein of salivary glands, from blood-fed of uninfected female in 10 individual P. papatasi sand flies from each location at each period of the season (early, mid, or late) (Figs. 6, 7, 8, Table 2, Additional file 4: Table S2), and also the LeIF expression was quantified from Leishmania major isolated from infected female of P. papatasi sand fly with fresh blood-fed, gravid, and semi gravid status (Figs. 9, 10, 11, Table 2, Additional file 5 Table S3). Four principal climatic elements of studied region (wind, annual precipitation, temperature, and humidity) were considered to determine bioclimatic classification and distribution of sand fly species of Northern-Khorasan province (Figs. 1, Additional file 1: Figure S1). Among aforementioned factors, annual temperature, humidity and rainfall have the greatest effects on the sand flies lives. After evaluating the impact of principle climatic factors on climatic variables, three regions were classified as homogeneous climate zones (Table 1, Additional file 2: Table S1 (stations sheet), Additional file 3: Figure S2). The regions are as follows: (1) The Mediterranean with spring rains area in northwestern including Razo- Jargalan, and Maneh-o Samalqan (Table 1, Additional file 1: Figure S1, Additional file 2: Table S1). (2) The cold-mountainous area in southwestern including northern parts of Garmeh, in central including Bojnord, and in eastern including Shirvan, Faruj, and Esfarayen. (3) The low rain fall and warm-semi dry area including Jajarm, southern and western parts of Garmeh and Esfarayen, respectively (Additional file 1: Figure S1).
Table 2
Comparison of salivary gland and Leishmania gene expression levels (SP15 & LeIF) isolated from field-caught P. papatasi in three Bio-climate zones of Northern Khorasan province.
| Isolated source | Status | Climate ecotopes | Frequency of Distribution of Gene expression | P value (P < 0.05)MW |
| (A) Mediterranean** | (B) Mountainous* | (C) Semi arid• | Mean ± SEM of All 14 sites Expression Fold | All 14 sites Expression Fold |
| (A) | (B) | (C) | A vs B | A vs C | B vs C |
| P. papatasi | Salivary protein SP15 (Fold Change) | Blood-Fed | Early (June) 7 out of 14{ | 1.20 | 0.32 | 1.67 | 1.40429 ± 0.382118 | 1.585 ± 0.419459 | 2.77571 ± 0.434103 | 0.6295N | 0.0101S | 0.0180S |
| 0.96 | 0.54 | 3.14 |
| 0.42 | 0.49 | 2.23 |
| 1.70 | 1.94 | 2.12 |
| 0.20 | 1.73 | 2.85 |
| 0.56 | 2.92 | 5.63 |
| 2.80 | 3.89 | 3.88 |
| Mid (Aug) 7 out of 14{ | 1.21 | 1.58 | 1.99 | 1.87071 ± 0.423889 | 2.095 ± 473827 | 4.13571 ± 0.575062 | 0.7652N | 0.0035S | 0.0054S |
| 0.31 | 0.29 | 3.88 |
| 0.65 | 0.57 | 2.81 |
| 1.77 | 2.10 | 2.70 |
| 3.23 | 3.42 | 3.50 |
| 0.53 | 0.85 | 6.31 |
| 3.83 | 4.40 | 7.37 |
| Late (Sep) 7 out of 14{ | 1.79 | 1.92 | 2.30 | 3.91929 ± 1.00625 | 3.37286 ± 0.770445 | 6.70214 ± 1.44592 | 0.5972N | 0.0115S | 0.0030S |
| 0.55 | 0.48 | 4.37 |
| 1.19 | 1.60 | 3.62 |
| 3.83 | 3.72 | 4.41 |
| 1.97 | 1.48 | 4.10 |
| 3.27 | 1.39 | 9.79 |
| 4.80 | 6.49 | 24.13 |
| Leishmania parasite (P. papatasi) | LeIF (Fold Change) | Gravid 7 out of 14{ | 0.770 | 1.090 | 0.920 | 1.90557 ± 0.298908 | 1.55971 ± 0.164003 | 0.997929 ± 108543 | 0.5502N | 0.0101S | 0.0123S |
| 2.070 | 1.500 | 1.340 |
| 0.920 | 1.700 | 0.590 |
| 1.810 | 1.210 | 0.430 |
| 0.993 | 0.940 | 0.790 |
| 1.440 | 1.110 | 0.970 |
| 2.130 | 1.830 | 1.120 |
| Semi-Gravid 7 out of 14{ | 0.460 | 0.820 | 0.410 | 1.63629 ± 0.230047 | 1.29536 ± 0.17331 | 0.956429 ± 159147 | 0.3012N | 0.0326S | 0.1543N |
| 1.530 | 1.720 | 1.360 |
| 0.670 | 0.560 | 0.600 |
| 0.980 | 0.850 | 0.530 |
| 2.070 | 1.640 | 0.840 |
| 2.910 | 0.990 | 1.470 |
| 2.414 | 2.210 | 1.320 |
| Blood-Fed 7 out of 14{ | 0.210 | 0.16 | 0.11 | 0.577857 ± 0.119376 | 1.07714 ± 0.188427 | 0.355 ± 0.0988436 | 0.0596N | 0.0886N | 0.0035S |
| 1.190 | 1.90 | 0.17 |
| 0.090 | 1.70 | 1.02 |
| 1.280 | 0.81 | 0.18 |
| 0.190 | 0.24 | 0.09 |
| 0.340 | 0.11 | 0.11 |
| 1.130 | 0.39 | 0.52 |
| * Bojnord, Shirvan, Garmeh, Faruj, and Esfarayen Counties. |
| ** Raz-o Jargalan, and Maneh-o Samalqan Counties. |
| • Jajarm, southern parts of Garmeh and, western areas of Esfarayen Counties, SEM: Standard Error of Mean, MW, Mann-Whiteny U Test |
| { The remaining 7 variables are shown in Supplementary 3, S: Significant, N: No significant |
The data of CL and VL vector presence (P. papatasi, VL species: chinensis group, major group, P. kandelaki, Paraphlebotomus species: P. sergenti, P. caucasicus, P. ansari, P. alexandri, Sergentomyia species: S. sintoni, S. dentata, S. sumbarica, S. baghdadis) were imported to ArcMap, which transfers the raw data into visualized information to be used as a hazard map for ZCL, ACL, and VL transmission in each bioclimatic zones of Northern Khorasan province (Figs. 2, 3, 4, 5, Additional file 2: Table S1). In the genus Phlebotomus, P. papatasi were in all climate regions (n = 800 specimens: 68.55%). Regarding, P. papatasi was the most abundant one in spatial cluster of mountainous regions particularly in Baba Aman, Quch Qaleh, and Paygho where human dwellers are almost in all ecotopes, ranging from 11.25–18% (Fig. 2, Table 1), and the least abundant one of them was observed in Gholaman and Darkesh of Mediterranean region, and the farthest eastern part of mountainous regions (Fig. 2). P. alexandri, proven vector of VL and suspected vector of CL, was the second-most widespread species caught in mountainous climate zone (Fig. 3, Table 1, Additional file 2: Table S1 (xy sheet)). From 153 P. alexandri, 60.79% (n = 93 specimens) were caught from rodent burrows’ ecotope in sylvatic habitats, while 39.21% P. alexandri (n = 60 specimens) were found in peridomestic animal shelters. Paraphlebotomus species were found only in spatial cluster of mountainous and Mediterranean bio-climate (BC) zones (Fig. 3, Table 1). Sergentomyia genus was prevalent almost in all three bio-climate areas (Fig. 4, Table 1). However, Sergentomyia was more prevalent only in spatial cluster of Mediterranean and mountainous BC zones especially more for Gholaman, Qareh Bashloo and, Quch Qalleh-Olya with the mean of range between 10.26–16.33% (Fig. 4, Table 1). S. baghdadis and S. sintoni were predominant species of Sergentomyia genus in mountainous foci (Fig. 4, Table 1, Additional file 2: Table S1 (xy sheet)) and a lower frequency is shown in green parts of Fig. 4. VL vectors presence was the most abundant in spatial cluster of Mediterranean region mainly in Raz-o Jargalan and, Maneh-o Samalqan namely Gholaman and Darkesh (Fig. 5, Table 1).
Species diversity
A series of ecological parameters and indices were utilized to characterize the sand fly populations in different areas. Species diversity of sand flies was evaluated using the values of Shannon-wiener index (Hʹ), evenness (E), and richness (S) along with localities of studied areas (Table 3, Additional file 6: Table S4). Analyzing the sand fly species richness, diversity and, evenness indices revealed differences in communities of three bio-climate zones. The highest Shannon diversity index and richness were obtained from the population of Paraphlebotomus species with the maximum rate (Hʹ = 1.098, R = 1.224) in the Mediterranean region, in comparison with other BC areas (Table 3). The second richness index was related to Sergentomyia species (R = 1.154) in semi-desert community, and the second Shannon diversity index was also related to Paraphlebotomus and Sergentomyia species with the same rate along with the third most richness index (Hʹ = 1.039, R = 1.060) in mountainous BC zone (Table 3). P. papatasi sand flies indicated no evenness and diversity in all collected BC zones, however its richness was varied from the minimum 0.083 (Paygho) to the maximum 0.936 (Baba Aman) in Mediterranean BC ecotopes. In terms of Jaccardʼs similarity coefficient for sand fly communities, the similarity of each main locality was ranged from the lowest between Malkesh (mountainous) and Paygho (mountainous), Emarat (semi-arid), Qarahche-Robat (semi-arid), Ashkhane (Mediterranean), Darkesh (Mediterranean) with 25% JSC index similarity to the highest among mountainous localities and, between semi-desert (Emarat, Qarache-Robat) and Mediterranean (Ashkhane, Darkesh) BC zones with 100% JSC index (Table 4, Additional file 6: Table S4).
SP15 and LeIF expressions
Quantitative data for the expression profiles of SP15 and LeIF of salivary and Leishmania genes were summarized in Table 2, Additional file 7: Table S5, in terms of the physiological status (blood-fed, gravid and semi-gravid) and bio-climate classification (Mediterranean, mountainous and semi-arid) for female P. papatasi sand flies. Fold change ratios were ranged from the least as 0.12 in June-early to the highest as 24.13 in September-late for SP15 in three Bio-Climate zones (BCz) (Figs. 6, 7, 8). Expression fold of SP15 was ranging from 0.12 in Mediterranean BCz (Gholaman) to 6.41 in semi-arid BCz (Garmeh-Houmeh) in June-early (Fig. 6). One way ANOVA (Kruskal-Wallis test, KWt = 8.548) of SP15 fold expression in June-early indicated that the medians were significant (P = 0.0139, P < 0.05) in all three BC zones (Fig. 6, Table 2, Additional file 7: Table S5). Although SP15 fold changes had a marginal increase from Mediterranean BCz to mountainous BCz in June-early, it had also a remarkable rising expression in semi-arid BCz at three times of collection (Fig. 12a, b, c). Mann Whitney U test (MWt) was performed to compare SP15 expression fold change ratios between each two BCz in early (June), mid (August), and late (September). Regarding, the obtained data were analyzed and tabulated in Table 2, Additional file 7: Table S5. Expression fold ratios of SP15 were ranged from 0.31 in Mediterranean BCz (Darkesh) to 7.9 in semi-arid BCz (holy tomb of Emamzade-Ebrahim, Sankhast County) in August-mid (Fig. 7, Additional file 4: Table S2). The Kruskal-Wallis test was KWt = 11.19 for SP15 fold expression in Mid (August) and, the median was significant (P = 0.0037, P < 0.05) in three BC zones (Fig. 12b, Table 2, Additional file 7: Table S5). The expression profiles of SP15 salivary gene were ranged from 0.48 in mountainous BCz (Malkesh) to 24.13 in semi-desert BCz (Kouran district) in September-late (Fig. 8, Additional file 4: Table S2). The Kruskal-Wallis test was KWt = 10.60 for SP15 fold changes in late (September), and the median was significant (P = 0.0050, P < 0.05) in all BC zones (Fig. 12c, Table 2, Additional file 7: Table S5). The expression profiles of salivary SP15 gene in three regionalized bio-climate locations are as followings: Semi-desert > Mountainous > Mediterranean (Fig. 12a, b, c, Table 2, Additional file 7: Table S5).
The effect of physiological status of blood meal (blood-fed, gravid, and semi-gravid) on expression of LeIF gene was examined from natural Leishmania-wild-caught P. papatasi sand flies in three BC zones. Gravid P. papatasi indicated the highest LeIF fold expression in Mediterranean BCz (1.9 ± 0.298) (Figs. 11, 12f, Table 2, Additional file 7: Table S5) following semi-gravid in Mediterranean (1.6 ± 0.23) (Figs. 10, 12e, Table 2, Additional file 7: Table S5), and then again gravid with a slight difference in mountainous BC zones (1.55 ± 0.164) (Figs. 10, 12f, Table 2).
Fold changes ratios for LeIF expression was ranged from the least as 0.03 for blood-fed status in semi-desert BC zone (Sankhast) (Figs. 9, 12d, Additional file 5: Table S3) to 4.82 as the highest expression fold for gravid status in Mediterranean BC zone (Gholaman) (Figs. 11, 12f, Additional file 5: Table S3). The Kruskal-Wallis test was KWt = 9.046 for LeIF fold expression in gravid status of P. papatasi, the median was significant (P = 0.0109, P < 0.05) in three BC zones (Figs. 11, 12f, Table 2, Additional file 7: Table S5). Abdominal position of semi-gravid showed no significant fold changes for LeIF expression of Leishmania parasites in wild-caught P. papatasi in all classified bio climate ecotopes (KWt = 5.285, P = 0.0712, P < 0.05) (Figs. 10, 12e, Table 2, Additional file 7: Table S5). Statistical analysis for blood-fed status of P. papatasi exhibited a significant fold change in LeIF expression of Leishmania parasites (KWt = 10.19, P = 0.0061, P < 0.05) in three regionalized BC zones (Figs. 9, 12d, Table 2, Additional file 7: Table S5). The expression profiles of LeIF from natural Leishmania-field-caught P. papatasi sand flies were as followings: gravid of A, B and, C > semi-gravid of A, B and, C > blood-fed of A and C in three regionalized BC zones (Fig. 12d, e, f, Table 2, Additional file 7: Table S5).
