During and after the aging, the electrical properties and surface changes of the polymer insulators were investigated by the following analysis techniques.
3.1. Leakage Current Analysis
Leakage current analysis is used as appropriate information about insulator's assessment in recent studies. Reciprocal correlation between destruction factors and leakage current is only one reason for its many applications [10]. One of the acceptance criteria in aging tests is leakage current according to the IEC 62217 standard.
The insulator performance was evaluated in a high voltage laboratory by measuring the leakage current in the 20.5 kV voltage test. Water conductivity was set to 4 µS/m at 25°C during leakage current test in light fog condition for salt fog and boiling water samples after cleaning. Figure 4 shows the typical circuit diagram for leakage current measurement.
The leakage current was measured after nine weeks (1500 hours) in the middle of the stressing time and 18 weeks (3000 hours) at the end of the stressing time by stopping the aging process for three weeks to evaluate the recovery properties of the polymer insulator. Figure 5 shows the leakage current results.
The leakage current of the weaker sample number 1 increased faster than the other samples. The maximum current for this sample was respectively 770 µA and 296 µA in the salt fog and immersion test after 18 weeks of stressing. According to the recorded leakage current for all samples, it was observed that in the aging test of boiling water, the maximum leakage current is approximately 40% lower than the salt fog test.
After three weeks rest in the middle and end of the stressing time, a reduction in leakage current in all samples was evident in the recovery properties of the polymer insulators. The recovery rate is affected by the composition of methyl groups and the presence of low molecular weight molecules that tend to expand on the surface. The main reason for the recovery of silicon rubber insulation in salt-fog test is a displacement of low molecular weight and in boiling water immersion test is reorientation of methyl-groups [11].
It was observed that the leakage current after three weeks of rest decreased approximately 80% in salt fog and 65% in boiling water samples, due to uniform surface aging in boiling water, the recovery properties of the insulators are less. Due to increasing the leakage current by increasing the boiling water test time, the electrical properties were further investigated to evaluate the mechanical properties, including the adhesion of the rod to the insulator body.
3.2. Leakage Current Harmonics
Harmonic analysis of leakage current can be considered as a criterion for assessing the state of polymer insulation [12]. Studies show that the low-frequency components of leakage current (fundamental, 3rd and 5rd harmonic) can be better related to aging than the peak values. Harmonic analysis using Fourier Transform is illustrated in Fig. 6.
When the third harmonic component of the leakage current is smaller than the fifth, the maximum leakage current is limited, and no erosion was observed on the insulator surface. With increasing aging, it’s third harmonic significantly increases with respect to the fifth harmonic [13].
As can be seen, the 3rd/5rd harmonic ratio in the weaker sample 1 increased faster than the other samples. In sample A1, the third harmonic surpassed the fifth harmonic after the fifth and fifteenth weeks, and in sample B1 after the ninth and nineteenth weeks. For other samples, the third harmonic amplitude is less than the fifth. In the boiling water test, the 3rd/5rd harmonic ratio is approximately 25% lower than the salt fog test.
Harmonic and maximum leakage current changes were similar in both aging tests. When the third harmonic component of the leakage current is smaller than the fifth component, the maximum leakage current is limited and no erosion was observed on the insulator surface. By increasing the third harmonic component of the leakage current, an increase in the electrical discharge of the dry band and also corrosion was observed on the surface. It was observed that in the weeks when the leakage current of the samples is more than 200 µA, the third harmonic of the leakage current is more than the fifth.
Therefore, harmonic analysis of leakage current and the use of third to fifth harmonic ratio can be considered as a criterion for evaluating the condition of polymer insulation to determine the end of life of insulators and provide maintenance services. The maximum leakage current and harmonic analysis can be used to confirm the onset of aging.
3.3. Hydrophobicity Test
According to the STRI classification guide, the degree of the insulation surface's water repellence can be divided into seven hydrophobicity classes (HCs) [14]. HC1 is the highest water-repellent class, while completely hydrophilic surfaces are in the HC7 category.
The hydrophobicity test was performed weekly on all samples before leakage current measurement by water spraying after cleaning and drying the samples. Summary of the hydrophobicity analysis after salt fog and boiling water tests at 18 weeks of stressing and two rest times are presented in Figs. 7 and 8 to evaluate the recovery properties and compare the changes with the reference samples.
Test results show that silicone rubber initially had high hydrophobicity. This property decreased with increasing stressing time. As expected, silicon rubber can regain its hydrophobic properties after a period of rest; the polymeric insulators' hydrophobicity improved up to 2 classes after each rest period. In a situation where environmental factors change rapidly; the recovery feature of polymer insulators enhances the performance of the power grid.
By comparing the hydrophobicity class of insulators in different weeks of aging with leakage current results, it was observed that the hydrophobicity class is directly correlated to the maximum leakage current.
3.4. Partial Discharge
The Partial discharge may be considered as the main cause of degradation of polymer insulators. A partial discharge test is performed to detect the cavities and surface erosion of insulator and mechanical defects during the aging process [15]. In IEC 62217 standard, defects in connections and moisture penetration are checked after 42 hours immersion in boiling water test, by using steep-front impulse voltage test. In this article, to evaluate the electrical and mechanical properties of insulator after the stressing, a partial discharge test method was proposed.
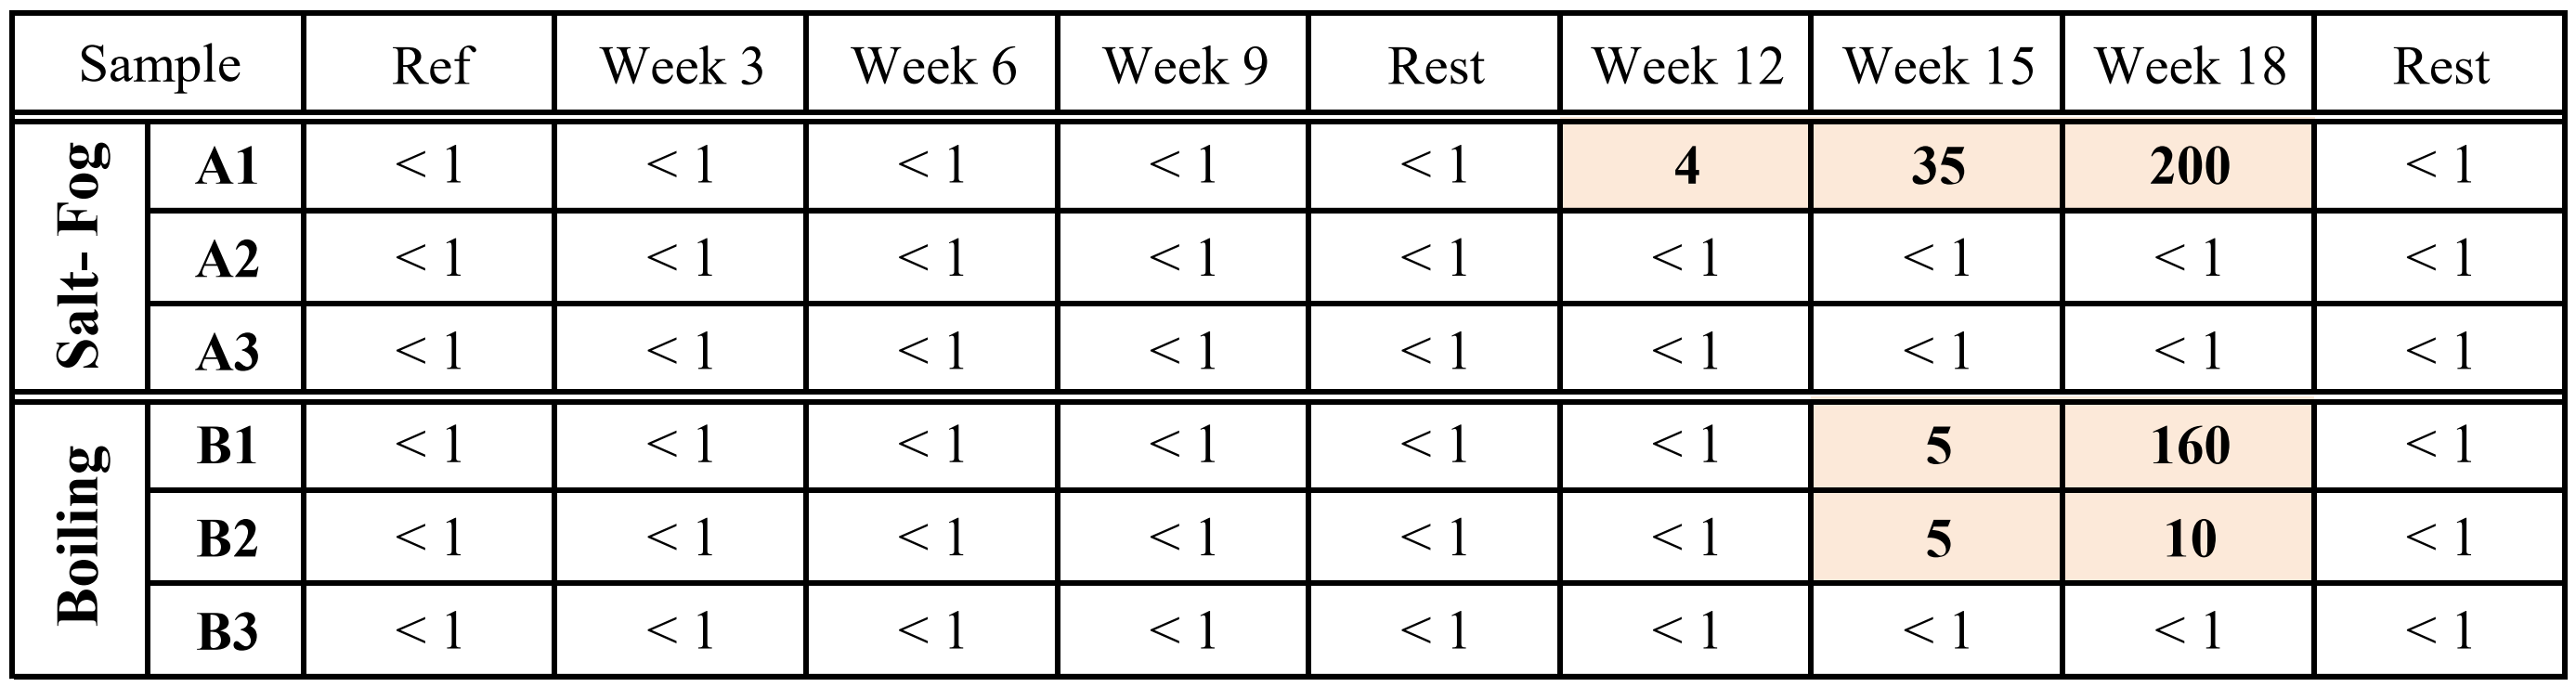
The wideband method was used to record partial discharge pulses. Partial discharge measurements were performed regularly every three weeks at 20kV voltage. The partial discharge results are presented in Table 1.
At the beginning of the aging process, partial discharge of all samples was below 1 pC and oscillating (due to ambient noise). Therefore, it can be concluded that all samples are free of defects that produce partial discharge, including surface destruction of the sample and internal mechanical damage to the insulator rod, same as reference samples.
At the end of the stressing time, the partial discharge of sample number 1 (A1 & B1) increased in salt fog and boiling water tests, which could be due to surface discharge, degradation, and loss of water hydrophobicity or moisture penetration into the insulator rod. After rest time, the partial discharge returned below 1 pC, which could be due to the improvement of surface properties and the recovery of silicon rubber on the insulator or dry-off of the moisture that has penetrated the fittings' connection, rod, and polymer insulator.
For sample B2, partial discharges reached 10 pC at the end of the stressing time. Also, the mechanical properties of this sample were weakened, which was bent by applying a vertical force to the rod insulator. Therefore, it can be concluded that the boiling water aging test affects simultaneously the electrical and mechanical properties of polymer insulators.
3.5. SEM Analysis
Analysis of surface changes was performed by Scanning Electron Microscopy (SEM). SEM analysis provides high-resolution imaging, useful for a qualitative estimation of the type and extent of surface degradation or erosion [16].
Specimens with a 10×10 mm2 were cut from the surface of reference and aged insulators and coated with a thin layer of gold under a vacuum situation. These specimens were analyzed with an electron microscope using a voltage of 20.0 kV. The results of SEM test in 5, 50, and 200 µm scales are presented in Fig. 9.
In salt fog tests, due to the dry band discharge, deep degradation was observed in the form of grooves, cavities, and scatters. In the boiling water tests, surface degradation was observed uniformly.
3.6. EDAX Analysis
Energy Dispersive X-ray Analysis (EDAX) is an x-ray technique used to identify the housing material elemental composition during aging processes [17]. The data generated by EDAX analysis consist of spectra showing peaks corresponding to the elements making up the actual composition of the samples. The pieces of 20×20 mm2 were cut from the reference and aged samples.
Silicone rubber is an elastomer composed of containing duplicate silicone oxygen (Si-O) backbone and two methyl groups (CH3) for each silicon atom and contains fillers to improve its properties. The methyl groups are responsible for the highly hydrophobic surface properties.
ATH (Alumina Trihydrate) is used as a filler to obtain a combination with enhanced physical and chemical properties and improved long-term resistance [18].
When the polymer insulators aged due to surface degradation for thermal activity, methyl groups (CH3) oxidized and converted to O-H groups with high hydrophilic properties. After stressing, the carbon percentage had decreased, and the oxygen percentage increased.
|
(CH3)2SiO + 4 O2 → SiO2 + 2 CO2 + 3 H2O
|
(1)
|
|
2 Al(OH)3 → Al2O3 + 3 H2O
|
(2)
|
The EDAX analysis results are shown in Table 2, which represents the atomic percentage of elements on the surface of reference and aged samples.
Table 2
EDAX analysis results (atomic percentages of the heavy atoms)
|
C%
|
O%
|
Al%
|
Si%
|
C/O
|
|
|
Ref. 1
|
29.60
|
27.92
|
8.24
|
34.24
|
1.06
|
|
A1
|
21.8 (26%↓)
|
41.7 (49%↑)
|
6.32 (23%↓)
|
30.21
|
0.52 (51%↓)
|
|
B1
|
19.8 (33%↓)
|
43.6 (56%↑)
|
6.87 (17%↓)
|
29.71
|
0.45 (58%↓)
|
|
Ref. 2
|
37.47
|
20.86
|
11.12
|
30.55
|
1.80
|
|
A2
|
32.7 (13%↓)
|
27.4 (31%↑)
|
9.56 (14%↓)
|
30.28
|
1.20 (33%↓)
|
|
B2
|
31.9 (15%↓)
|
28.6 (37%↑)
|
10.3 (7%↓)
|
29.20
|
1.12 (38%↓)
|
|
Ref. 3
|
38.32
|
23.06
|
14.14
|
24.48
|
1.66
|
|
A3
|
31.2 (19%↓)
|
30.8 (34%↑)
|
12.0 (15%↓)
|
26.02
|
1.01 (39%↓)
|
|
B3
|
32.8 (14%↓)
|
32.0 (39%↑)
|
12.8 (9%↓)
|
22.36
|
1.02 (39%↓)
|
By decomposing ATH, water and white powder of aluminum oxide are produced. Therefore, the reduction of the Al element due to ATH decomposition can be introduced as a sign of aging. Due to the higher heat in the electrical discharge, Al decrease is more evident in the salt fog test.
In addition, after stressing due to the decomposition of PDMS bonds, a decrease in C element and an increase in O element was observed. The reduction in the C/O ratio is almost similar in both aging tests.
3.7. TGA Analysis
Thermo Gravimetrical Analysis (TGA) is a technique that measures the weight changes of a sample during a thermal test. In this method, the temperature is increased at a constant rate, and the weight loss of volatile components is measured. TGA test is an effective method for assessing the thermal stability of polymer content and filler based on weight loss at different temperatures [19].
About 20 mg of samples were cut and heated from 25°C to 800°C at the rate of 10°C per minute. In TGA analysis, material volume sampling was performed, while aging affects the surface of the samples. Thus, weight changes in different aging tests are not noticeable.
Figure 11 shows the TGA and derivative thermogravimetry (DTG) diagrams. Two step weight losses are observed. The two-step weight loss percentage and residual weight are presented in Table 3.
The first step of weight loss from 230°C – 370°C is associated with the release of water from the ATH filler and the production of Al2O3. The second step of weight loss from 370°C – 600°C is related to the SiR decomposition.
DTG data show the rate of material degradation with temperature change. The minimum value of the DTG curve is at 340 ° C when water is released from ATH.
The volume of ATH filler in samples 1 and 2 are approximately equal, and in sample 3 is about 25% larger than the other two samples.
In the boiling water test has water uptake and possible leaching of filler particles during the water immersion, hence immersion boiling water test affects more on the filler. The lowest leakage current was recorded for sample 3 with the highest ATH volume. In the salt fog test with higher temperature during electrical discharge, the lowest leakage current was recorded for sample 2 with higher quality SiR.
Table 3
First and second weight loss determined for the TGA analysis
|
First Weight Loss (%)
|
Second Weight Loss (%)
|
Residue Weight (%)
|
|
|
Ref. 1
|
13.27
|
34.79
|
51.94
|
|
A1
|
14.46
|
34.21
|
51.33
|
|
B1
|
13.73
|
33.42
|
52.85
|
|
Ref. 2
|
13.12
|
34.41
|
52.46
|
|
A2
|
12.94
|
34.85
|
52.21
|
|
B2
|
13.56
|
32.15
|
54.29
|
|
Ref. 3
|
16.77
|
31.48
|
51.76
|
|
A3
|
16.92
|
31.30
|
51.78
|
|
B3
|
16.82
|
29.03
|
53.61
|
3.8. FTIR Analysis
The polymeric insulators were tested by Fourier Transform Infrared Spectroscopy (FTIR). FTIR spectroscopy is an analytical technique to identify the initial structural bonding of the polymeric housing materials [20].
The peak corresponding to wavenumber 1270 − 1255 cm-1 belongs to the Si-CH3 group. The peaks of 1100 − 1000 cm-1 and 840 − 790 cm-1 belong to the Si-O-Si group and the Si-(CH3)2 group. The peaks of the wave numbers 3700 − 3200 cm-1 and 1640 cm-1 correspond to the hydroxyl groups [21]. FTIR analysis diagram of virgin samples and after the end of test by considered recovery effects is shown in Fig. 12.
If the samples aged, the polymeric groups corresponding to wavenumber 1270 − 1255, 1100 − 1000, and 840 − 790 cm-1 reduced, and the peaks corresponding to wavenumber 3700 − 3200 cm-1 increased. The ratio of FTIR peaks associated with Si-O-Si and O-H bonds can be introduced as the oxidation coefficient.
Table 4 shows the changes in absorbance bonds of reference and aged samples. According to FTIR results on aged samples, methyl compounds (C-H) significantly decreased compared to reference samples. It was observed that after stressing of the polymer insulator, the bonds related to the spectra of 1255 to 1270, 1000 to 1100, and 780 to 840 decreased, and the bonds related to the spectra of 3200 to 3700 increased. The degree of oxidation of polymeric insulator compounds after stressing can be investigated by the maximum ratio of the Si-O-Si bond spectrum (1000 to 1100) related to the central PDMS polymer insulation bond to the O-H bond (3200 to 3700) of ATH. The change in 1260 wavelength absorption related to the Si-CH3 compound is a good indicator for measuring aging because this chain breaks easily.
Table 4
|
Si-(CH3)2
780–840 cm− 1
|
Si-O-Si
1000–1100 cm− 1
|
Si-CH3
1255–1270 cm− 1
|
OH of ATH
3200–3700 cm− 1
|
OH of ATH / Si-O-Si
|
|
|
Ref. 1
|
0.89
|
0.92
|
0.47
|
0.10
|
9.04
|
|
A1
|
0.85 (5.2%↓)
|
0.88 (2.4%↓)
|
0.38 (18.7%↓)
|
0.17 (64.1%↑)
|
5.38 (40.5%↓)
|
|
B1
|
0.88 (1.0%↓)
|
0.89 (3.0%↓)
|
0.45 (4.9%↓)
|
0.13 (24.0%↑)
|
7.07 (21.8%↓)
|
|
Ref. 2
|
0.91
|
0.93
|
0.48
|
0.23
|
3.96
|
|
A2
|
0.76 (16.1%↓)
|
0.86 (5.4%↓)
|
0.36 (24.9%↓)
|
0.26 (11.9%↑)
|
3.35 (15.4%↓)
|
|
B2
|
0.74 (19%↓)
|
0.90 (3.1%↓)
|
0.35 (26.5%↓)
|
0.28 (17.6%↑)
|
3.27 (17.6%↓)
|
|
Ref. 3
|
0.80
|
0.90
|
0.44
|
0.34
|
2.66
|
|
A3
|
0.78 (2.1%↓)
|
0.89 (1.2%↓)
|
0.40 (9.7%↓)
|
0.36 (7.8%↑)
|
2.44 (8.4%↓)
|
|
B3
|
0.68 (14%↓)
|
0.88 (2.3%↓)
|
0.35 (20.9%↓)
|
0.39 (15.3%↑)
|
2.26 (15.3%↓)
|
The ratio of OH bond spectrum (3200 to 3700) to Si-O-Si bond spectrum (1000 to 1100) for reference samples 2 and 3 is less than sample number 1, which indicates the higher quality of the polymer used in these insulators. Similar to the results of the leakage current test, in the salt fog and boiling water aging tests, the highest decrease in the ratio of O-H to Si-O-Si bond spectrum was observed in sample number 1.
3.9. Summery
Table 5 presents the analysis results of two tests of salt fog and boiling water aging.
Table 5
|
Maximum Leakage Current
(µA)
|
3rd /5rd Harmonics Ratio
(%)
|
Hydrophobicity Classes
(HC)
|
Maximum Partial Discharge
(pC)
|
Decrease C/O Ratio
in EDAX
(%)
|
Decrease O-H/Si-O
in FTIR
(%)
|
|
|
A1
|
770
|
140.2
|
HC6
|
200
|
51
|
40.5
|
|
B1
|
296
|
134.6
|
HC5
|
160
|
58
|
21.8
|
|
A2
|
26.7
|
79.5
|
HC3
|
PD Free
|
33
|
15.4
|
|
B2
|
107.4
|
65.2
|
HC3
|
10
|
38
|
17.6
|
|
A3
|
37.4
|
78.9
|
HC4
|
PD Free
|
39
|
8.4
|
|
B3
|
54
|
66.1
|
HC3
|
PD Free
|
39
|
15.3
|