The work presented herein lead to the development of a karyotyping method for Rangifer tarandus. Since most autosomes are similar in this species, the capacity to generate color banding patterns specific to each chromosomes provides an interesting tool for chromosome identification. Specific sets of probes can be selected and reamplified to highlight a subset of chromosomes or of chromosomal regions.
The color patterns allowed to significantly improve the genomic reference built from scaffolds assembled bioinfomatically to a chromosome-level assembly. Completely sequenced chromosomes represent major scientific advances which undoubtedly represent a valuable resource for further genomic studies. However, very seldom are initial draft genomes assembled to this extent. The use of proximal tagging strategies and various DNA sequencing platforms that provide different coverage and read lengths can yield sufficient data to generate super-scaffolds (2, 3, 5, 46), but even these large genomic fragments rarely cover entire chromosomes. One of the main obstacles is the presence of repeated elements that make it impossible to establish with certainty the relative positions of scaffolds (5). Cytogenetics offers a complementary strategy to bioinformatics by physically positioning sequences of interest through in situ hybridization (4, 7, 44, 47–51).
To date, animals for which complete chromosome-mapped genomes are available for reference purposes include humans (52), mice (53), Drosophila (54), zebra fish (55), chickens (56), cattle (57), swine (58), sheep (59), and goats (60). However, several wild species of conservation concern have not been fully chromosome-assembled (3, 4, 6, 61). For instance, four Rangifer tarandus draft genome assemblies have been published in recent years (20, 22–24). However, none have reached chromosome-level assembly. Herein, we used Oligopaint FISH probes (modifiable synthetic short oligonucleotides) to anchor the 68 currently largest Rangifer tarandus scaffolds from the most recent R. tarandus genome (20) to chromosomes. The oligonucleotide-based technology was chosen instead of the de novo synthesis of DNA probes from bacterial artificial chromosomes (BAC) since this latter method is less efficient and more expensive (7, 62–64). Another alternative could have been to use existing probe-sets developed in other species but even with meticulous sequence selection, hybridization success rate can vary considerably (48). Moreover, these probes generally target both single-copy sequences and repetitive sequences, which significantly reduces specificity and possible applications (65).
Long synthetic oligo have been used to probe genomic regions as small as 6.7 kb (33, 35). Shorter probes (≤ 100 bp) have been effective for 10 kb regions (34, 36), albeit more efficient when targeting 52 kb to 2.1 Mb to hybridize on nuclei (36). The probe sets designed in our study targeted 401.5 kb on average, a length for which our probe sets containing 1 500 oligo appeared to be optimal. Mean oligo density per probe was thus 3.74/kb, lower than the 5.5/kb previously used for targeting 500 kb (36). However, mean densities as low as 1.71/kb have been used successfully to hybridize with 500 kb sequences chosen within chromosomal sets (42). Our hybridization results show that small variations in the number of oligo per probe, oligo density and the targeted sequence length has little impact on detection, and that the method is therefore robust and flexible.
Another parameter that could influence probe detection in oligo-based technology, particularly the resolution at which probes are distinguishable from each other, is inter-probe distance. In the present study, the lowest inter-probe distance (excluding the distance between probes of adjacent scaffolds) was 7.4 Mb, that is, between the first and second probes of chromosome 8. This is consistent with previous studies in which a 7–8 Mb gap between probes was sufficient (33, 41). The minimal inter-probe distance to ensure acceptable probability of detection and visualization is the main reason why smaller scaffolds could not be used. Overall, our probe design parameters allowed us to map all selected scaffolds, which account for 78% (2.01 Gb) of the entire R. tarandus genome. This coverage is comparable to other bioinformatic and FISH-assisted genome assemblies (4, 48).
While the probe-sets were designed to position and orient all selected scaffolds onto the chromosomal spreads, since the initial scaffolds were obtained from a bioinformatics assembly, the designed probe-sets were also confirming the existence of the in sillico derived fragments and allowed the detection of chimeric sequences. A total of 18 breaks in synteny were previously identified when mapping R. tarandus scaffolds to a bovine genome (20). Such analysis cannot distinguish true chromosomal rearrangements from chimeric assembly. The split scaffolds identified in the present study match five of the seven largest previously identified potential inter-species discrepancies, confirming that these were examples of scaffolding errors. Furthermore, colour patterns did reveal an intra-scaffold rearrangement. All corrected scaffolds were among the 40% largest, which seems concordant with the increased number of sequence matching events needed to lengthen the scaffolds. Several reference genomes have been corrected after publication by visualizing potential errors through FISH probe hybridization (6–8), thus supporting the usefulness of cytogenetics in genome assembly. Corrected scaffolds reduced syntenic breaks observed previously (20) and further confirmed the reported high synteny between Cervidae and Bovidae (22, 23, 66).
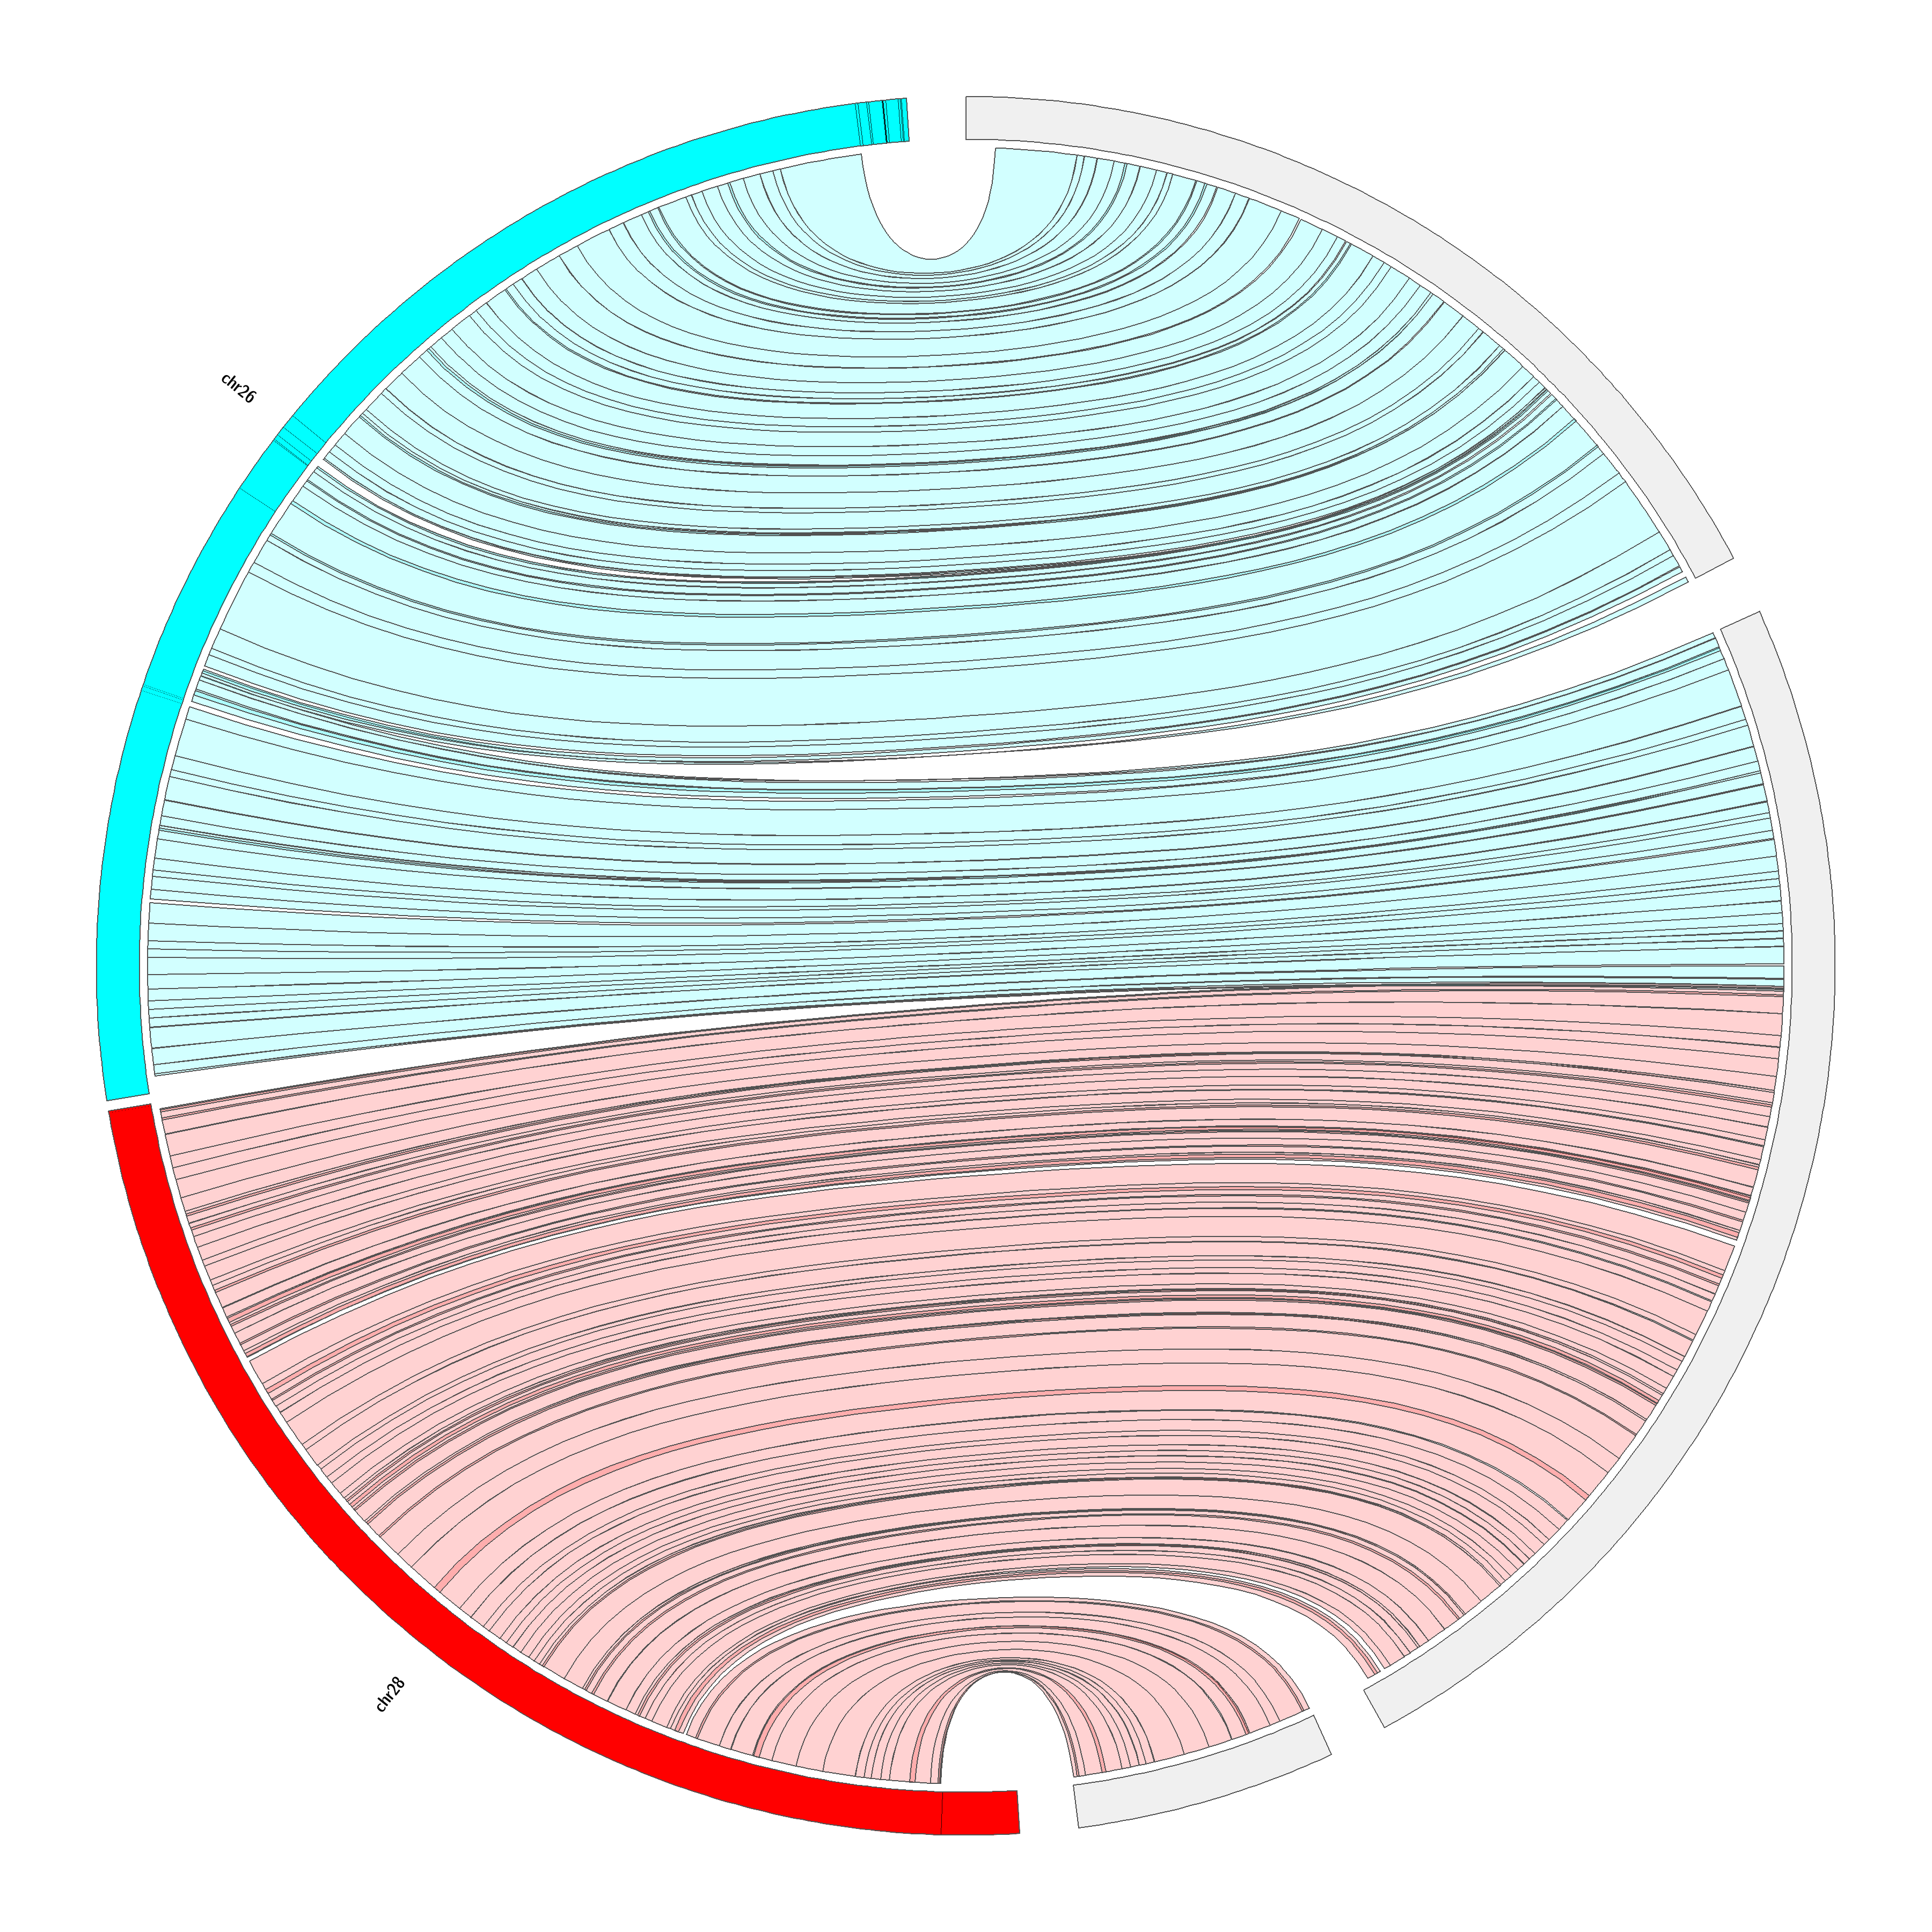
Despite this high synteny between Cervidae and Bovidae, chromosomal rearrangements that were not highlighted in the previous genome mapping (20) were revealed by cytogenetics. Several studies comparing species in the infraorder Pecora revealed evolving chromosomal rearrangements (25, 47, 49, 67–71). A chromosome painting study comparing B. taurus and several deer species including red deer, milu deer (Elaphurus davidianus), rusa deer (Cervus timorensis russa), Eld’s deer (Rucervus eldii), fallow deer (Dama damas), roe deer (Capreolus capreolus), Chinese muntjac (Muntiacus reevesi) and moose has revealed karyotype differences traceable to fission of chromosomes 1, 2, 5, 6, 8 and 9 and tandem fusion of chromosomes 26 and 28 (49). Our results support the same karyotypic evolution and suggest that bovine chromosome 28 has the same centromeric region as R. tarandus chromosome 6 (Figure S2). We therefore hypothesize that bovine chromosome 26 centromere formed after the fission. The centromere of bovine chromosome 28 has been associated also with the centromere of C. elaphus chromosome 15, which also contains both bovine chromosomes 26 and 28 (66). Although fission of B. taurus chromosomes 26 and 28 was unambiguously predicted by bioinformatics (20), fission of chromosomes 1, 2, 5, 6, 8 and 9 was not, thus showing the usefulness of physical mapping.
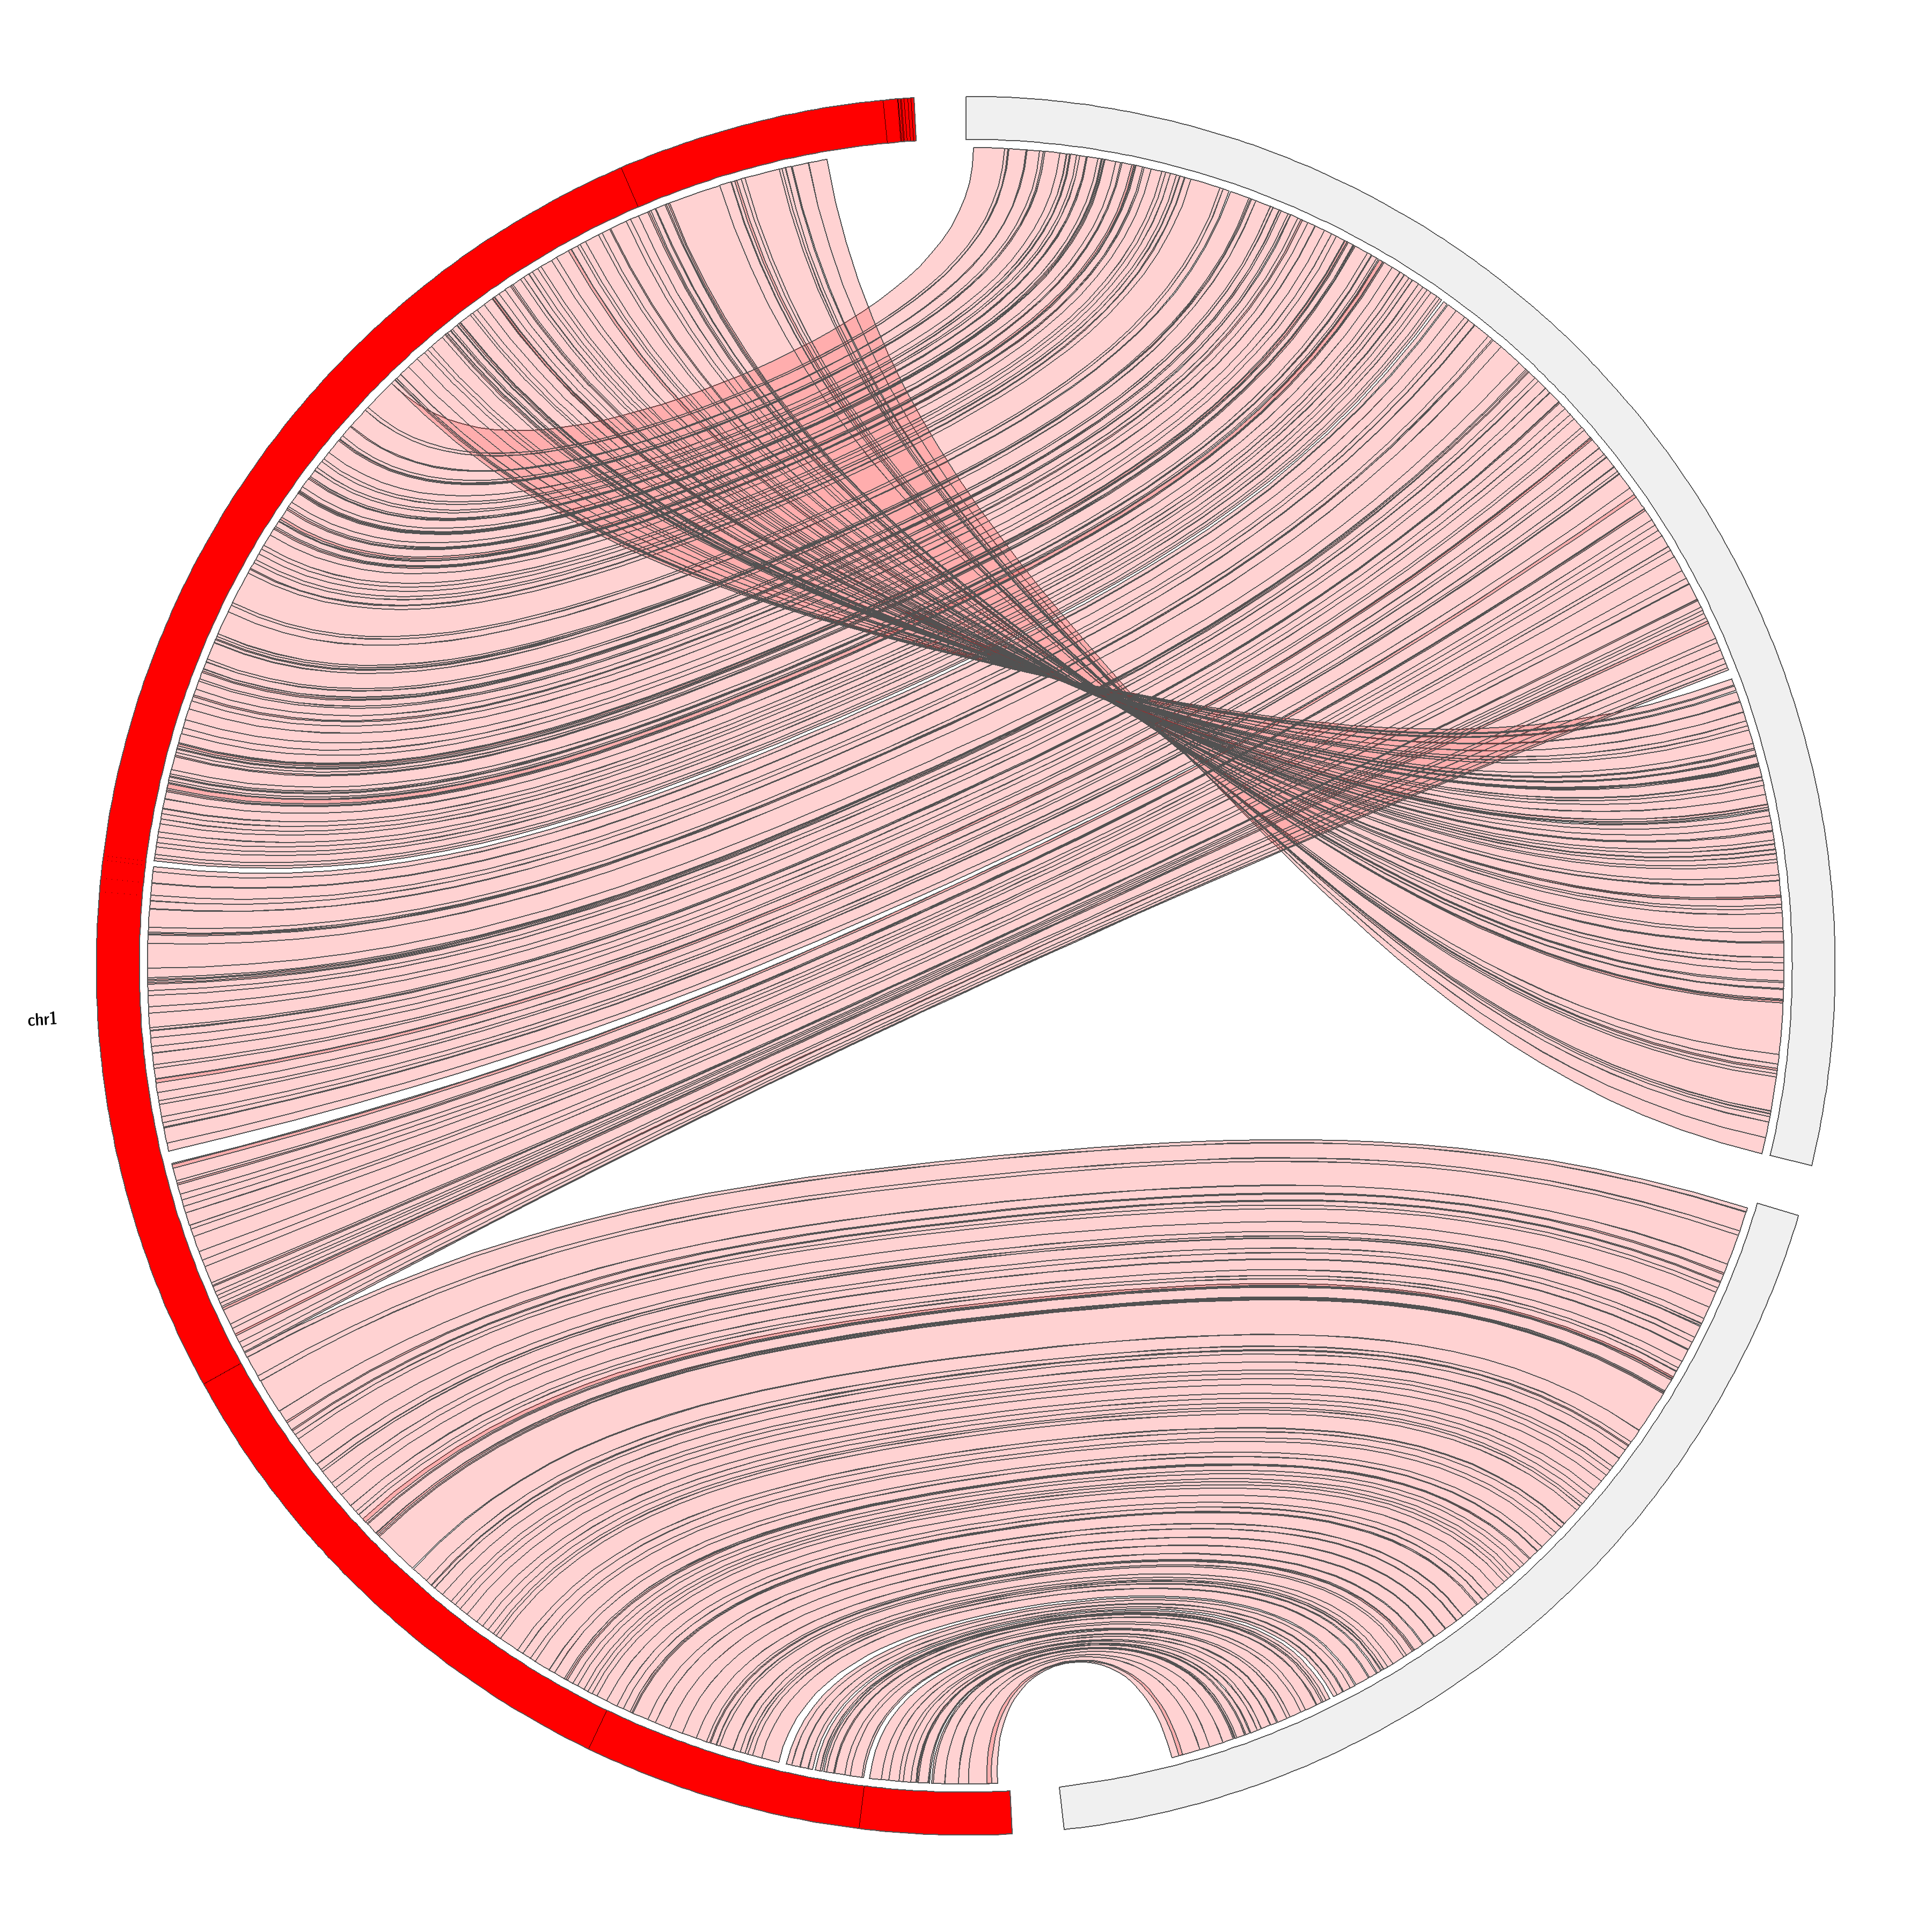
Bovine chromosome 1 represent an interesting case as it has been associated with many chromosomal rearrangements among Cetartiodactyla (49). In nine Cervidae species studied in that review, bovine chromosome 1 was found to be split into a smaller acrocentric chromosome and a larger acrocentric or submetacentric chromosome. In our mapping, the scaffold associated with the proximal part of bovine chromosome 1 is located alone on a small acrocentric R. tarandus chromosome, and the distal part is located on the submetacentric R. tarandus chromosome numbered 34.
To explore Cervidae chromosomal evolution further, we mapped the bovine first chromosome related scaffolds to the latest versions of the mule deer genome (Odocoileus hemionus; GCA_020976825.1) and the red deer (Cervus elaphus; GCA_910594005.1) genome. It has been reported that the distal portion of the larger chromosome resulting from the split of the bovine chromosome has undergone a translocation to the middle/proximal region in several Cervidae species (47, 49, 66). Furthermore, in the Capreolinae subfamily, containing the genera Odocoileus, Rangifer and Alces among others, a pericentric inversion within a large acrocentric chromosome leading to a submetacentric type has been reported (25, 29, 67). Based on suggested karyotype evolution (25, 67), cross-species hybridization (49) and genome assembly (66), C. elaphus does not contain this pericentric inversion. Our mapping shows the same scaffold order on C. elaphus, O. hemionus and R. tarandus, suggesting that these three cervid genomes contain the same translocation. The pericentric inversion was not confirmed directly by FISH since no non-inverted chromosome was probed for comparison. However, BAC probe hybridization results for R. tarandus chromosomes (49) and our R. tarandus assembled genome comparison with B. taurus genome (Figure S3) tend to support this rearrangement. Based on these observations, we suggest a karyotype evolution scheme including Bos taurus, Capra hircus, Cervus elaphus, Rangifer tarandus and Odocoileus hemionus (Fig. 8) in which fission of an ancestral bovine chromosome 1 ortholog gave rise to a small acrocentric R. tarandus chromosome containing one scaffold (in green) and a larger one containing three scaffolds (yellow, blue, and red) within which a translocation moved the distal portion to near the centromere in extant Cervidae. The chronology of these two chromosomal rearrangement events remains to be determined. Finally, a pericentric inversion of the proximal portion occurred, leading to a submetacentric configuration in the genera Odocoileus and Rangifer (Fig. 8). We expect that both the translocation and the pericentric inversion occurred in Alces alces and other Odocoileus species since their karyotypes are closely related according to previous phylogenetic mapping (25). Further FISH experiments will be needed to test this hypothesis. Since cross-species hybridization can sometimes proves to be informative specially to confirm specific evolutionary genomic reorganizations (47, 49), all probes developed herein for R. tarandus have been made available (supplemental data).