The acrylic resins used in the tanning process are generally high molecular weight polymers formed by repeating smaller units called monomers. The properties they provide to the leather depend basically on the type of monomers used during the synthesis and the molecular weight of the resins. As mentioned, the most commonly used monomers are acrylic acid, acrylonitrile, styrene, and maleic anhydride. The purpose of this study was to develop an acrylic resin where part of the acrylic acid monomer was replaced with a biomass-derived polysaccharide (BPS).
A radical polymerization reaction between an acrylic acid monomer and BPS was carried out. A graft copolymer with a defined backbone and randomly distributed branches or side chains different from the main chain was obtained. The synthesis reaction of the new copolymer graft AA is shown in Fig. 1.
3.1. Product characterization
GPC determination was performed according to the previous section. The number average molecular weight (Mn) is the statistical average molecular weight of all the polymer chains in the sample. Weight average molecular weight (Mw) was obtained taking into account the contributions of each molecular weight. Finally, the polydispersity index (PDI) was defined by Eq. 1. The results are shown in Table 3.
PD=\(\frac{Mw}{Mn}\) Eq. 1
Table 3
Number average molecular weight, weight average molecular weight, and polydispersity index of the standard acrylic polymer and AA graft polymer with BPS.
|
Sample
|
Mn (g/mol)
|
Mw (g/mol)
|
PDI
|
|
Standard acrylic
|
65,910
|
734,579
|
11.15
|
|
AA
|
192,332
|
582,634
|
3.03
|
Standard acrylic had a higher molecular weight (Mw) but a lower Mn value. Because its PDI value was higher than that of AA, the latter was less polydisperse. This might be due to the incorporation of the biopolymer.
IR spectra data allowed identifying the functional groups that characterize polymers and their constituent monomers. IR spectra of sustainable acrylic resin AA and of acrylic acid are shown in Fig. 1 and Fig. 2, respectively. The main absorption bands of the functional groups present in acrylic acid were identified. The band of the –OH bond of the carboxyl group appeared at 3063 cm− 1, followed by the CH2 band at 2661 cm− 1. The C = O group band appeared at 1704 cm− 1, the C-H band appeared at 1434 cm− 1, and the doublet appeared at 1298 cm− 1 and 1243 cm− 1 due to C-O bond stretching (Pretsch et al. 1989).
The spectrum of the product obtained was compared to that of acrylic acid. The spectrum of the polymer synthesized in the laboratory showed a wide, intense absorption band at 3376 cm− 1, related to –OH bond stretch vibration. The CH2 band and the carbonyl group band appeared at 2934 cm− 1 and 1707 cm− 1, respectively. Finally, the absorption band representing C-O-C interaction appeared at 1152 cm− 1, thus suggesting the formation of the ester bond not present in acrylic acid (Pretsch et al. 1989).
The results of biobased carbon content, COD, BOD5 and sample biodegradability are shown in Table 4.
Table 4
Biobased carbon content, COD, BOD5 and biodegradability of the products studied.
|
Sample
|
Biobased content (%)
|
BOD5 (mg/L)
|
COD (mg/L)
|
BOD5/COD
|
|
Standard acrylic
|
0
|
2,867
|
304,000
|
0.01
|
|
AA
|
46
|
195,250
|
276,000
|
0.71
|
Biobased carbon content is a measure of the amount of biomass-derived carbon (C-14) in a product as compared to its total organic carbon content, and is expressed in percentage. Petroleum-derived products do not contain carbon-14. Standard acrylic has 0% biobased carbon content and therefore is not a biobased product (it is made 100% from petrochemical resources). AA has 46% biobased carbon content, meaning that 46% of the product’s carbon originates from biomass resources and 54% from petroleum-derived materials.
Unlike the BOD5 values obtained, the COD values for both products were similar (9% variation). Both COD and BOD are parameters that allow determining the oxygen demand strength of sewage, COD being a chemical oxidation process and BOD being a biological oxidation process. BOD5 values are lower than COD values because COD measures the oxygen demand for the decomposition of both organic and inorganic materials in sewage. Higher BOD5 values suggest that more oxygen is being consumed by the sample.
Finally, the BOD5/COD ratio allows obtaining an estimated value of the sample’s biodegradability. The value for standard acrylic was 0.01 (non-biodegradable), while the value for AA was 0.71 (biodegradable). These results evidenced that adding the biomass-derived polysaccharides to an acrylic resin substantially improves biodegradability.
Leather assessments
Products were applied as sole products at the retanning stage according to a standard formulation in Table 2.
BOD5 and COD values in residual baths were analyzed to determine bath biodegradability. The results are shown in Table 5.
Table 5
COD, BOD5 and biodegradability in residual baths.
|
Sample
|
COD (mg/L)
|
BOD5 (mg/L)
|
BOD5/COD
|
|
Standard acrylic
|
4,330
|
325
|
0.1
|
|
AA
|
3,340
|
2,560
|
0.8
|
The residual baths of standard acrylic showed a lower BOD5 value as compared to AA, a trend similar to that obtained with the BOD5 of the product. Regarding biodegradability, biodegradable baths with AA (BOD5/COD = 0.8) and non-biodegradable baths with standard acrylic (BOD5/COD = 0.1) were obtained.
Both the degree of whiteness and lightfastness (or accelerated aging) was determined to prevent yellowing issues, mainly on light or colorless leather articles. The parameters indicated for degree of whiteness are: L* (luminosity, where the greater the value, the greater the luminosity), a* (red/green, where + a* tends to red and -a* tends to green), and b* (yellow/blue, where + b* is yellower and -b* is bluer). The values of the lightfastness test are expressed in blue scale. An 8-point rating scale was used, where 0 is extremely poor lightfastness and 8 is excellent lightfastness. Heat resistance values were expressed in a 5-point grey scale, where 1 is the minimum value and 5 the maximum value. The standard acrylic resin was slightly whiter with higher L*=82.91 vs. 80.81value for AA, and similar a*=-3.7 for the standard acrylic vs. -3.87 for AA. b* values were also similar with b*=-2.14 for the standard acrylic and − 1.87 for AA. On the other hand, very good lightfastness and heat resistance values were obtained. Both products were within specifications (≥ 3) and little oxidizable by environmental factors such as light and/or temperature. Therefore, introducing the biomass derivative does not decrease the good fastness properties of the standard acrylic resin. Fastnesses results are shown in Table 6.
Table 6
Degree of whiteness and fastness tests.
|
Sample
|
Degree of whiteness
|
Lightfastness**
|
Heat resistance
(GS)
|
|
L*
|
a*
|
b*
|
|
Standard acrylic
|
82.91
|
-3.71
|
-2.14
|
4Y
|
3/4
|
|
AA
|
80.81
|
-3.87
|
-1.87
|
4Y
|
3/4
|
| **Y: Yellowing |
The degrees of softness, thickness, firmness, physical resistance and color properties in crust hides are shown in Table 7. The percent variation between samples for softness, thickness and resistances was also calculated. On the other hand, tightness was expressed according to the Satra break/pipiness scale, where 1 is the maximum value and 8 is the minimum value, and color levelness was expressed from 1 to 5, where 1 is the minimum value and 5 is the maximum value.
AA was softer, although slightly less full, and improved elongation and tear load as compared to standard acrylic. The tensile strength of the new biopolymer was slightly lower than that of the standard product. While good firmness was provided by standard acrylic, AA was 1 point better and reached the maximum value. On the other hand, AA provided high color intensity –the L* value was lower (less luminosity) without decreasing color levelness.
Table 7
Degrees of softness, thickness, firmness, physical resistance, color intensity and color levelness in crust hides.
|
Sample
|
Softness
|
Thickness (mm)
|
Tensile (MPa)
|
Elong(%)
|
Tear (N)
|
Firmness
|
Color intensity (L*)
|
Color levelness
|
|
Standard acrylic
|
3.5
|
1.5
|
26.85
|
17.68
|
159.4
|
2
|
55.82
|
5
|
|
AA
|
3.7
|
1.4
|
24.65
|
20.67
|
182.1
|
1
|
52.49
|
5
|
|
Variation
|
+ 6%
|
-7%
|
-8%
|
+ 17%
|
+ 14%
|
-
|
-
|
-
|
Life cycle assessment
The purpose of life cycle assessment (LCA) was to compare the environmental impacts related to the manufacture of the new biopolymer AA and the standard product.
The functional unit was 1 Kg of manufactured product. The reference flow was the Kilograms of the two products manufactured on an industrial scale between September 2019 and September 2020. The limits of the system include raw material extraction, raw material transformation, and product production. Distribution, use, and end-of-life were omitted.
Calculations were performed with the impact categories of EF2.0 midppoint for Life Cycle Impact Assessment (LCIA). OpenLCA 1.8.0 software and the Ecoinvent 3.7.1 database were used.
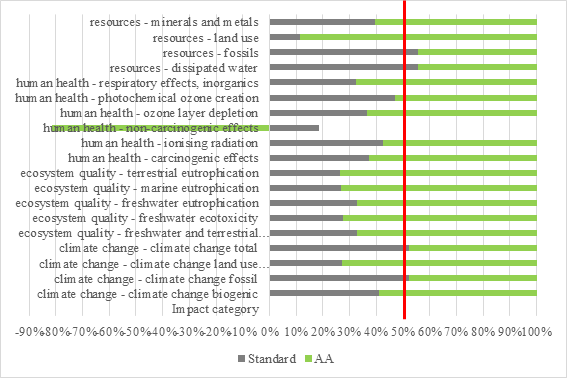
Nineteen impact categories divided into four large groups (resources, health, climate change, and ecosystem) were considered.
The results are shown in Graph 1 as a stacked bar chart with 50% contribution as red line.
Biopolymer AA has a greater environmental impact in the categories related to (non-fossil) natural resources, toxicity parameters, and human health. This is due to sugarcane cultivation, the origin of the polysaccharide derivative. Sugarcane cultivation has a high environmental impact due to the high use of fertilizers, herbicides or pesticides, which increase eutrophication, acidification, or waters with low concentrations of dissolved oxygen (Yu et al. 2008; Simpson et al. 2009; Hein and Leemans 2012; Verdade et al. 2012; El Chami et al. 2020). Also, because sugarcane is burnt to facilitate harvesting, it releases greenhouse gases that impair human health and pollute the air (El Chami et al. 2020). In turn, the standard resin has a greater impact in all the categories related to fuels and fossil resources, which are obtained from petroleum. In general, a greater impact of AA in 14 of the 19 categories selected was observed. In the non-carcinogenic effect category, AA was much better than the standard acrylic resin because sugarcane cultivation uptakes Zn, Cu and Ni. AA was also better than the standard resin in the climate change and carbon footprint categories, reduced by 9%.
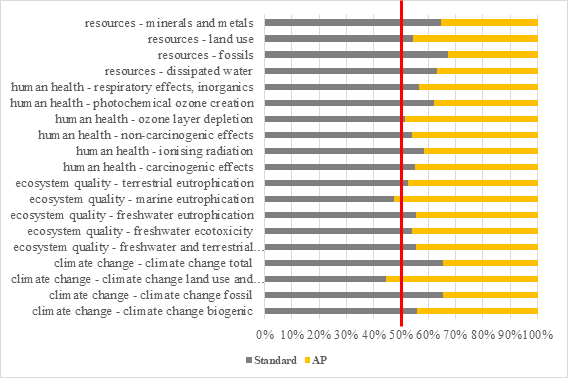
On account of the high environmental impact of the polysaccharide derivative, a sensitivity analysis was performed where the polysaccharide derivative was replaced with a protein derivative (AP). The results are shown in Graph 2 as a stacked bar chart with 50% contribution as red line.
In this case, there is an improvement in 17 of the 19 categories studied, and therefore a clearly reduced environmental impact of AP vs. standard is obtained. The incorporation of protein derivatives improved the results vs. polysaccharide derivatives, where only 5 of the 19 categories improved. Product AP decreased the carbon footprint by 47%, as compared to 9% by product AA. This is because the protein derivative used is a byproduct, which causes a much smaller environmental impact.