Ongoing Recipient Immune Dysfunction Accounts for Early Post-LT Mortality
We first sought to assess the prevalence of early post-LT mortality potentially attributable to persistent CAID. From 2007-2017, 779 LTs performed at a single center was retrospectively analyzed. Median biologic MELD at transplant was 29, with 30% (233/779) of patients having MELD ≥35.3 Liver disease severity and proportion transplanted with MELD ≥35 increased over time (rs=+0.84, p=0.001 Figure 1a). Regardless of pre-LT MELD, overall post-LT mortality did not differ significantly (p=ns, Figure 1b). Twenty-three percent (175/779) expired within 5-years, with 7.7% (60/779) of deaths occurring within the first year. Of early deaths, 55.0% (33/60) were attributable to immune-related etiologies, including sepsis/infection (40.0%), malignancy (11.7%), and graft-versus-host disease (3.3%, Figure 1c). Thus, persistent CAID may exacerbate risk for early post-LT mortality.
Participants
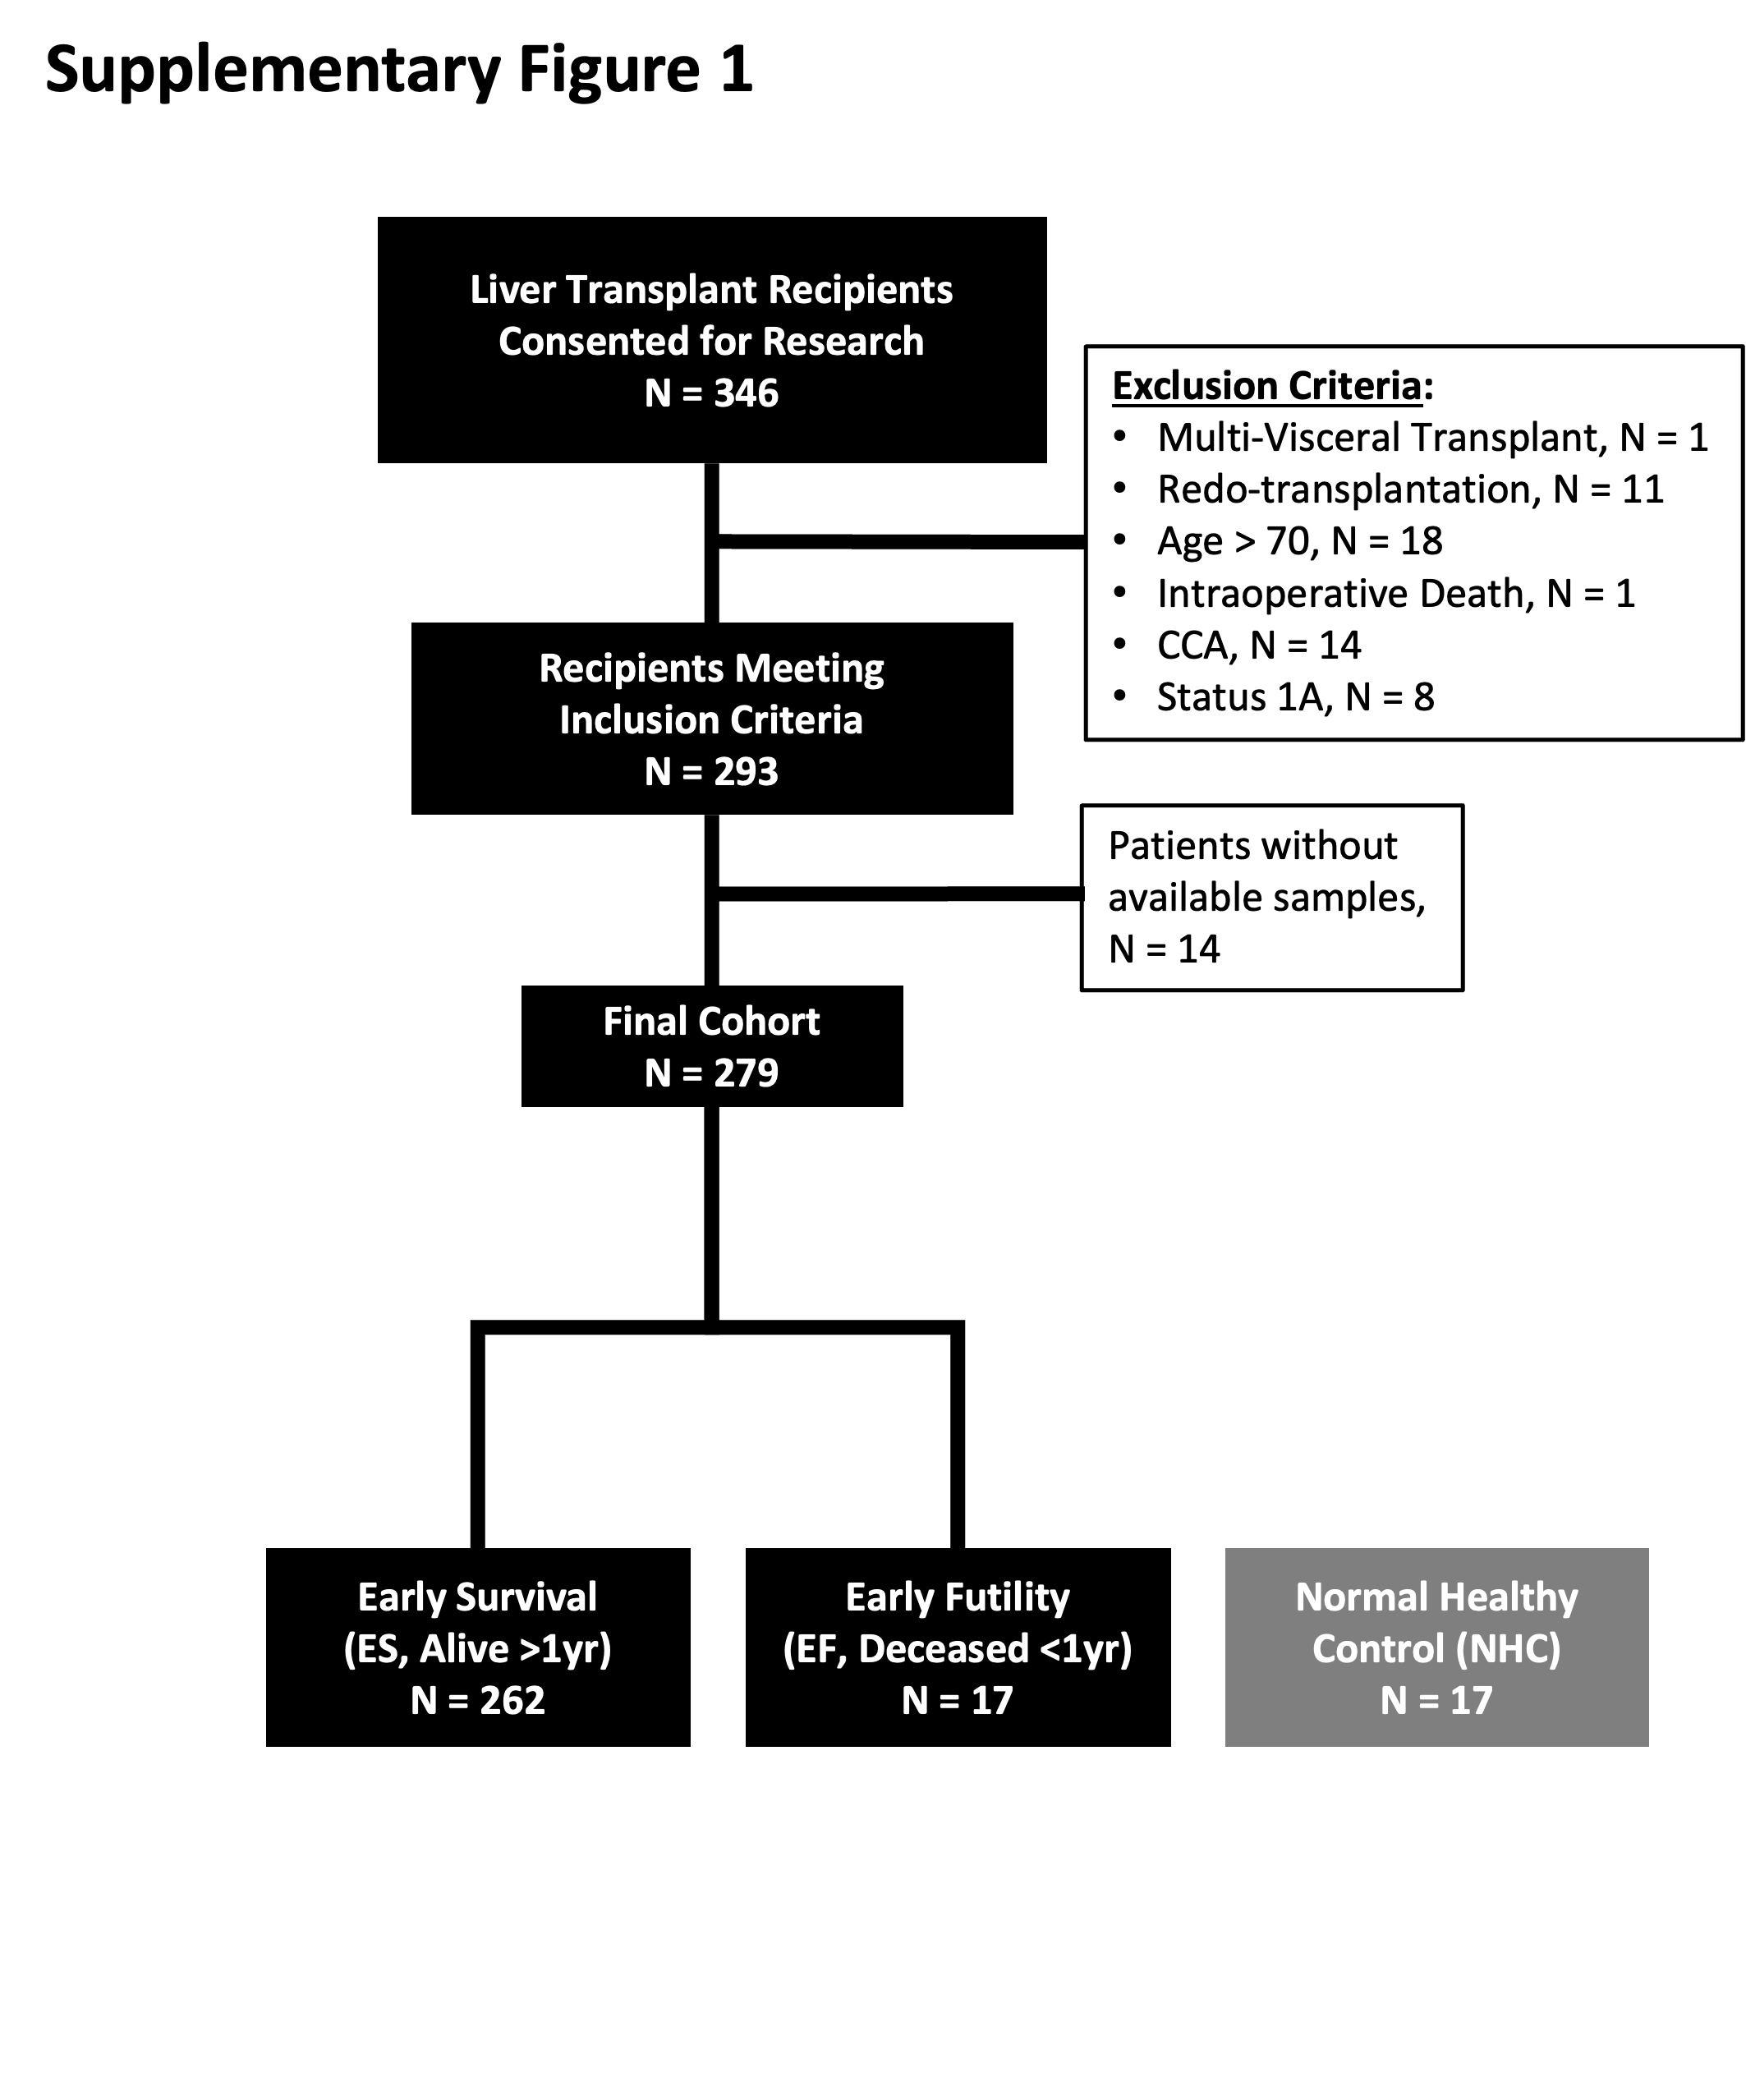
To assess biomarkers of pre-LT immune dysfunction, biospecimens were prospectively collected at transplant (T0). From 10/1/13–3/31/21, 346 patients were consecutively enrolled at two centers. Of these, 293 met inclusion and exclusion criteria. Fourteen lacked sufficient sample, resulting in an analysis cohort of 279 (Supplementary Figure 1). Donor and recipient characteristics are shown in Table 1. The top three causes of ESLD at both centers were HCV, ALRD, and steatotic liver disease (SLD). Whites and Latinx comprised the largest proportion of LT recipients. Median MELD at LT was 33. Overall cohort survival was 93.9%, 86.6%, and 79.6% at 1-, 3-, and 5-years, respectively. Median follow-up was 48.7 months (IQR 42.0-69.0). There were no missing outcomes.
Differences in center recipient characteristics reflected national shifts in the LT candidate population. From 2013-2021, median age at LT decreased, while biologic MELD score increased. HCV viremia decreased due to introduction of direct-acting antivirals (DAAs),35 while alcohol-related liver disease (ARLD) accelerated during COVID.36 HCC recipients decreased, reflecting 2020 liver allocation policy changes.37
Plasma Biomarkers of Immune Dysfunction are Elevated in Pre-LT Patient Samples
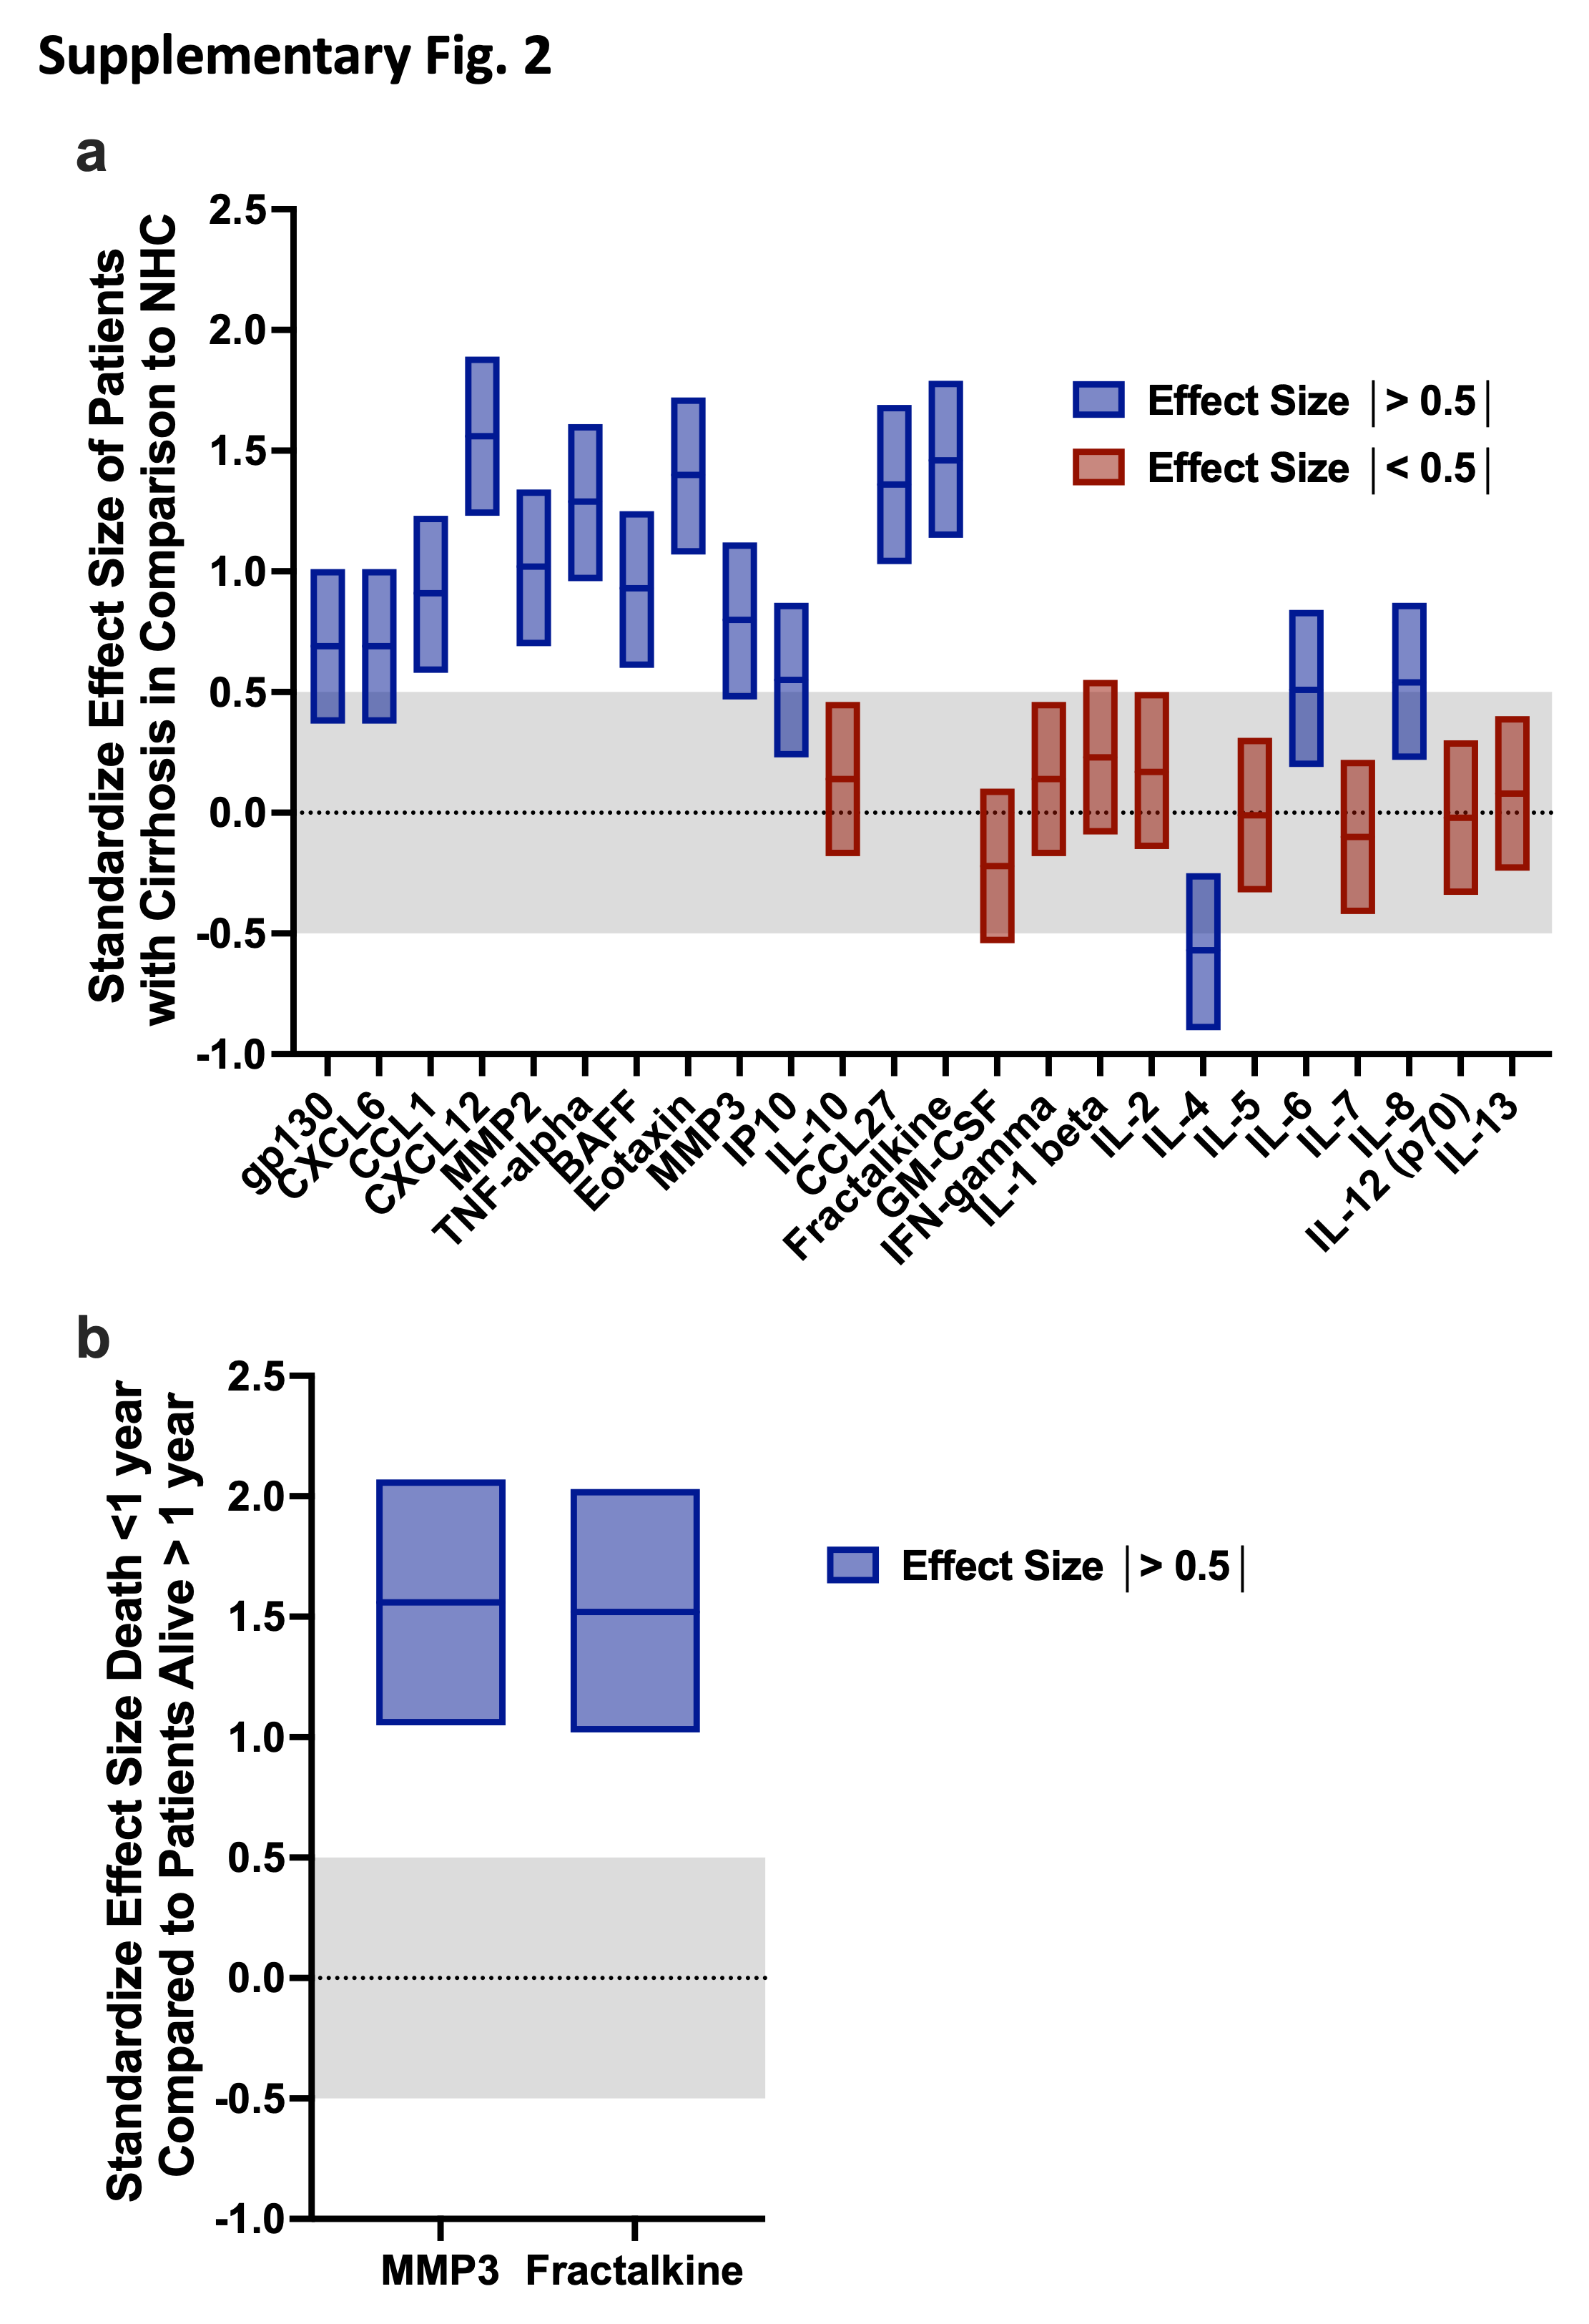
A panel of 24 biomarkers of immune dysfunction was analyzed on T0 patient plasma (<24 hours pre-LT) from consecutively enrolled recipients (n=279) and NHCs (n=17) (Supplementary Figure 1). Of those tested, median plasma values of BAFF, CCL1, CTACK, CXCL6, CXCL12, Eotaxin, Fractalkine (CX3CL1), IL-6, IL-8 (CXCL8), IP-10, MMP2, MMP3, sIL-6Rβ, and TNF-a were significantly elevated in cirrhotic patients with greater than 3-fold change in median values compared to NHC (Figures 2a and 2b). Effect size for candidate biomarkers of interest was >0.5 in 15/24 biomarkers (Supplementary Fig. 2a), suggesting adequate control population to identify potential alterations for most analytes.
Early Post-LT Mortality is Associated with Elevated Pre-LT Biomarkers of Immune Dysfunction
LT recipients were next stratified by survival within 1-year post-LT: those alive >1-year (ES–Early Survival, n=262) and those deceased ≤ 1-year (EF-Early Futility, n=17). Overall recipient demographics and co-morbidities were similar between groups, except for incidence of HCV (HCV IgG and HCV viral load), which was higher among EF patients (Table 2). Analysis of plasma cytokines and chemokines between these two populations demonstrated significant elevation of BAFF, CCL1, Eotaxin, Fractalkine (CX3CL1), IL-1β, MMP2, MMP3, and sIL-6Rβ in EF compared to ES (Figure 2c). When normalized to values amongst long-term survivors, all except BAFF and IL-1β remained significantly elevated in EF, with MMP3 (padj=0.0005) and Fractalkine (padj=0.0007) having the most significant elevation (Figure 2d).
Pre-Transplant Clinical and Biologic Predictors of the Risk of LT Futility
All significantly elevated biomarkers were combined with clinical and laboratory patient characteristics to assess pre-LT factors potentially associated with risk of EF. Variables were tested via Cox proportional hazard analysis to determine hazard risk of death≤1-year. On univariate analysis, pre-LT clinical predictors of EF include black race (p=0.04), HCV IgG positivity (p=0.003), detectable HCV viral load at transplant (p<0.001), and days of pre-LT dialysis (p=0.02). Common clinical variables traditionally considered in LT candidacy assessment did not confer increased risk of EF, functional status (Karnofsky score), medical acuity (MELD, ventilator, vasopressors, ICU), pre-LT infection, and HCC. No donor or intraoperative variables conferred increased risk of EF (Table 3). Pre-LT plasma cytokine and chemokine analysis revealed several markers associated with increased unadjusted hazard of EF. Pre-LT plasma BAFF (p=0.02), CCL1 (p=0.048), Eotaxin (p=0.003), Fractalkine (p<0.001), IL-1β (p<0.001), MMP2 (p<0.001), and sIL-6Rβ (p<0.001) and MMP3 (p<0.001) all conferred an increased risk of EF (Table 3).
Creation of a Pre-Transplant Risk Score for the Prediction of Post-LT Futility: The Liver Immune Frailty Index
Multivariate Cox proportional hazard analysis revealed that pre-transplant positive HCV IgG (HR 4.15 [1.45, 11.92] p=0.01), plasma MMP3 (per 1000 pg/mL increase, p=0.01), and plasma Fractalkine (per 100 pg/mL increase, p<0.001) conferred an increase in risk for 1-year post-LT mortality with a concordance statistic (C-statistic) of 0.85 (Table 4). Weighted points were calculated using linear transformation of the corresponding β-regression coefficients for the three finalized parameters (HCV IgG, MMP3, and Fractalkine). Statistical modeling defined the β coefficient, allowing direct comparison between variables to select those with greatest influence on mortality (the dependent variable). Subsequently, each value was transformed by the smallest absolute β coefficient and rounded to the nearest integer, yielding the assigned weighted points to calculate the liver immune frailty index (LIFI) risk score:
LIFI=[HCV IgG (Pos=1, Neg=0)]*25+[MMP3 (pg/mL)/1000]+[Fractalkine (pg/mL)/100]*5
In risk score calculations, quantitative concentrations of MMP3 and Fractalkine are continuous variables, while HCV IgG represents a binary assessment of HCV infection history (regardless of viremia). The relative contribution of the continuous variables in the LIFI calculation exceeded the discrete HCV IgG binary variable contribution. Median MMP3 concentration was 6,888pg/mL in ES and 19,084pg/mL in EF (range 227-65,217pg/mL), contributing 0.2-65.2 points towards LIFI. Similarly, median Fractalkine concentration was 314.3pg/mL in ES and 520.3pg/mL in EF (range 38.6-1,454.2pg/mL), contributing 1.9-72.71 points towards LIFI.
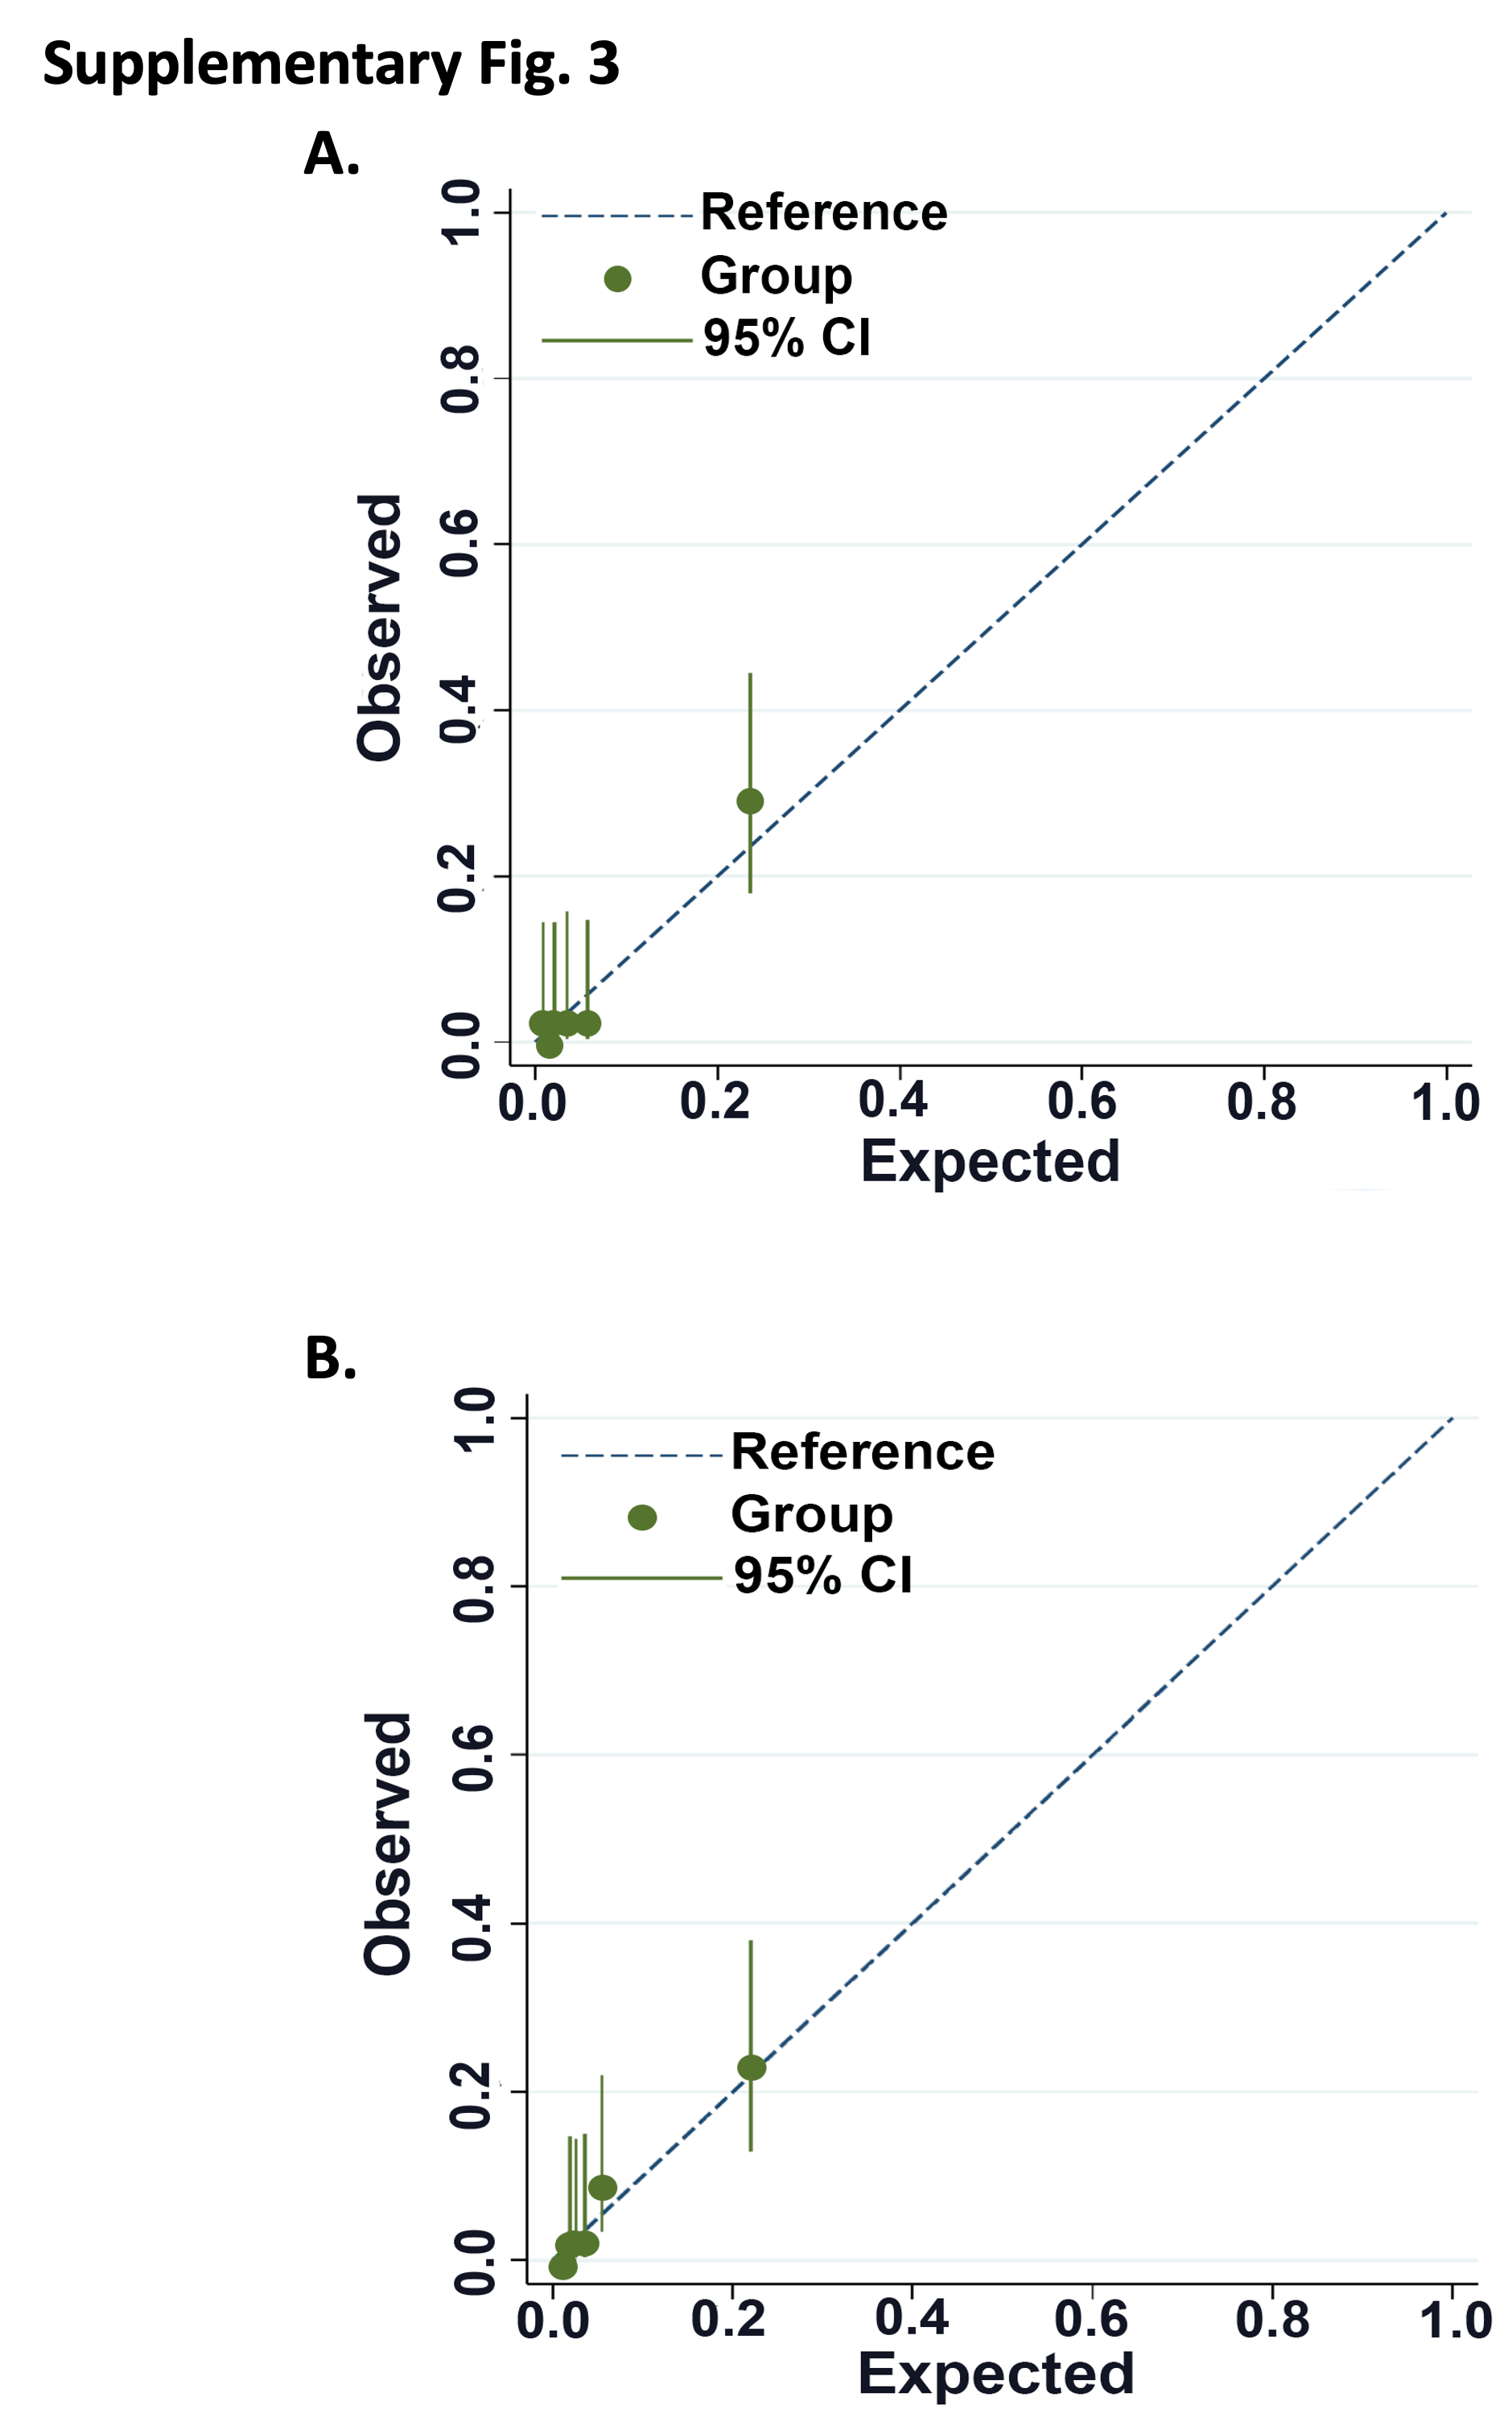
Patients were stratified into LIFI-low (<46, n=212), LIFI-moderate (46-79, n=55) and LIFI-high (≥80, n=12) tertiles of risk of EF (Table 4). The relative risk of death within one-year for LIFI-moderate is 8.99(95%CI 2.40-33.65, p<0.0001) and LIFI-high is 41.22(95%CI 12.16-139.78, p<0.0001) compared to patient classified as LIFI-low. On discrimination assessment, the model yielded a C-statistic=0.83. Internal validation with 2000 replicates resulted in finalized C-statistic=0.84. Calibration assessment demonstrated a Brier score=0.04 prior to and following internal validation (Table 4, Supplementary Fig. 3a.).
LIFI and Patient Outcomes: Survival and Clinical Complications Following Liver Transplant
Patient characteristics were similar between LIFI risk tertiles with the following exceptions (Supplementary Table 1): Median age was older (p=0.01), and blacks were more prevalent in LIFI-high (p=0.003). Incidence of CAD (p=0.02) and HTN (p=0.04) were increased in LIFI-high. As expected, the incidence of positive HCV IgG and viral load were greater in LIFI-high compared to the other two cohorts (p<0.01). Other pre-LT laboratory parameters and viral serologies were similar between groups. Recipient waitlist time was also markedly elevated for LIFI-high (p=0.04). Finally, donor age was slightly older in LIFI-high (p=0.02) and Liver donor risk index (LDRI) was greatest in LIFI-low (p=0.045).
Increasing LIFI tertile (low- to medium- to high) showed negative correlation with patient survival following LT (rs -0.2, p=0.012). Actual mortality at one- and two-years post-LT was worse in LIFI-high (58.3% and 75.0%) compared to 1.4%- and 5.9% for LIFI-low compared to 12.7% and 18.3% for LIFI-moderate (p=0.0013,Figure 3a). Seventeen patients died within one year of LT (Figure 3b). Consequences of immune dysfunction accounted for 86% of EF in LIFI-high, compared with 71% in LIFI-moderate and 0% in LIFI-low (p=0.03). Specifically, for LIFI-high, 57.1% (4/7) of patients expired due to infection and 28.6% (2/7) expired due to recurrent malignancy, both immune dysfunction-related phenomena. One additional LIFI-high patient (14.3%) expired from suicide in the setting of failure to thrive. Of note, mortality was most common in all patients who had LIFI score ≥65. Of these, 82% expired due to immune dysfunction-related etiologies.
Median graft survival was 8.3 months for LIFI-high, compared to >48 months for LIFI-moderate and -low (p<0.001, Figure 3c). Graft failure within 1 year was due to patient death with a functioning graft in 57.1% (15/28) . Non-mortality-related graft failure included hepatic artery thrombosis in 25.0% (7/28), ischemic cholangiopathy in 7.1% (2/28), primary nonfunction in 3.4% (1/28), delayed graft function in 3.4% (1/28), rejection in 3.4% (1/28), and recurrent HCV in 3.4% (1/28). Graft failure resulted in retransplant in 11/28 cases. Two patients expired while awaiting retransplant. Death-censored one-year graft survival was similar between groups (p=ns, Figure 3c), reflecting that graft loss primarily resulted from recipient death.
During the first year following LT, LIFI-high patients spent more days in the hospital (p=0.03) and had more frequent culture-positive Infections within one year (p=0.004). Pneumonia within 30-days was also increased in LIFI-high (p=0.048), LIFI-high were four times more likely to develop post-LT infections (p=0.01), suggesting persistent immune dysfunction. Treatment for acute rejection within 1-year was 2x more common in LIFI-low than LIFI-high (LIFI-high 8.3% [n=1], LIFI-low 16.5% [n=35], p=0.46). Of these, tejection was biopsy-proven in 22/35 cases for LIFI-low and 1/1 case in LIFI-high. Early ACR<90 days post-LT accounted for 42.8% of ACR cases in LIFI-low. The one case of ACR in LIFI-high was Banff 2-3 ACR at day 135 days, but this patient was subsequently diagnosed with recurrent HCV by biopsy two weeks later. Altogether, these data suggest that immune dysfunction present at the time of LT in LIFI-high may persist following LT and results in clinically significant sequela.
Alternative Pre-Transplant Risk Score Excluding HCV IgG as a Covariate.
The incidence of HCV as primary indication for LT has decreased from 30-40% to 10-15% over the past decade. Of 279 study cohort patients, only 17 (4.7%) received LT prior to introduction of DAAs, and 56.2% of HCV IgG+ patients had SVR at the time of LT. Due to the inclusion of HCV as a covariate in the setting of declining incidence of disease, however, the clinical utility of a risk score including HCV as a covariate might wane as HCV incidence falls. To account for this, we performed alternative model development of a LIFI risk score excluding HCV as a covariate (LIFIMF, LIFI only MMP-3 and Fractalkine, Supplemental Table 2). Based only on the covariates MMP-3 (HR 1.06 per 1000pg/mL increase [1.03-1.08], p<0.001) and Fractalkine (HR 1.33 for 100 pg/mL increase [1.16-1.53], p<0.001), LIFIMF is calculated based on the following formula:
LIFIMF Risk Score= [MMP3 (pg/mL)]/1000 + 5 * [Fractalkine (pg/mL)]/100
Raw LIFIMF scores subdivide patients into risk tertiles of low-(<36), moderate-(36-69), and high-(≥70) risk of death <1-year post-LT. Discrimination assessment demonstrates a C-statistic=0.83 in development and 0.84 on bootstrap validation with 2000 replicates, which is comparable to the LIFI model including HCV IgG. Calibration assessment (Supplementary Fig. 3b) demonstrates a Brier score of 0.04 both prior to and following internal validation.