Baseline Characteristics
The demographic and clinical characteristics were shown in Table 1. A total of 514 hospitalized patients with confirmed SARS-CoV-2 infection including 282 mild, 162 severe and 70 critical cases were included in the present analysis. The media age was 54 years, ranged from 23 to 96 years, and older in the severe and critical suffers. Totally, 271 (53.1%) patients were male, and the proportion of male was much higher than female in the critical ones (70.0%). The common symptoms were fever (87.6%), cough (70.2%), fatigue (58.4%), chest tightness (52.0%), shortness of breath (44.2%), expectoration (29.8%), muscle soreness (19.8%) and pharyngodynia (2.9%). Compared with mild patients, more serious fever (92.6% and 90.0% respectively) with higher maximal temperature, chest tightness and shortness of breath were observed in the severe and critical patients. Hypertension (43.2%), diabetes (19.3%) and cardiovascular disease (12.7%) were the most common comorbidity. Especially, hypertension was associated with disease severity that higher in severe (60.5%) and critical (55.7%) patients. The severe to critical patients exhibited more serious infection and inflammation with higher white blood cell and neutrophil, declined lymphocyte, enhanced levels of CRP, ESR, procalcitonin and ferritin (all P<0.001).
Table 1 Baseline Characteristics of COVID-19 patients.
|
|
Total
(N=514)
|
Mild
(N=282)
|
Severe
(N=162)
|
Critical
(N=70)
|
P
|
|
Age (years)
|
54 (48-68)
|
50 (45-64)
|
65 (56-72)
|
64 (57-72)
|
<0.001
|
|
Gender (male/female)
|
271/243
|
135/147
|
87/75
|
49/21
|
0.004
|
|
Fever
|
450 (87.6%)
|
237 (84.0%)
|
150 (92.6%)
|
63 (90.0%)
|
0.025
|
|
Highest temperature, °C
|
38.5 (37.9-39.0)
|
38.5 (37.8-39.0)
|
38.5 (38.0-39.0)
|
38.8 (38.2-39.0)
|
0.020
|
|
Cough
|
361 (70.2%)
|
195 (69.2%)
|
122 (75.3%)
|
44 (62.9%)
|
0.137
|
|
Expectoration
|
153 (29.8%)
|
81 (28.7%)
|
52 (32.1%)
|
20 (28.6%)
|
0.735
|
|
Fatigue
|
300 (58.4%)
|
160 (56.7%)
|
93 (57.4%)
|
47 (67.1%)
|
0.274
|
|
Shortness of breath
|
227 (44.2%)
|
87 (30.9%)
|
92 (56.8%)
|
48 (68.6%)
|
<0.001
|
|
Chest tightness
|
267 (52.0%)
|
130 (46.1%)
|
87 (53.7%)
|
50 (71.4%)
|
<0.001
|
|
Pharyngodynia
|
15 (2.9%)
|
11 (3.9%)
|
2 (1.2%)
|
2 (2.9%)
|
0.275
|
|
Muscle soreness
|
102 (19.8%)
|
63 (22.3%)
|
29 (17.9%)
|
10 (14.3%)
|
0.241
|
|
Presenting Comorbidity
|
|
|
|
|
|
|
Hypertension
|
222 (43.2%)
|
85 (30.1%)
|
98 (60.5%)
|
39 (55.7%)
|
<0.001
|
|
Diabetes
|
99 (19.3%)
|
45 (16.0%)
|
40 (24.7%)
|
14 (20.0%)
|
0.079
|
|
Cardiovascular disease
|
65 (12.7%)
|
32 (11.4%)
|
21 (13.0%)
|
12 (17.1%)
|
0.422
|
|
Chronic obstructive pulmonary disease
|
21 (4.1%)
|
6 (2.1%)
|
11 (6.8%)
|
4 (5.7%)
|
0.044
|
|
Bronchial asthma
|
10 (2.0%)
|
7 (2.5%)
|
2 (1.2%)
|
1 (1.4%)
|
0.621
|
|
Cerebralvascular disease
|
9 (1.8%)
|
9 (3.2%)
|
7 (4.3%)
|
5 (7.1%)
|
0.322
|
|
Chronic liver disease
|
8 (1.6%)
|
2 (0.7%)
|
4 (2.5%)
|
2 (2.9%)
|
0.226
|
|
Chronic kidney disease
|
21 (4.1%)
|
2 (0.7%)
|
5 (3.1%)
|
2 (2.9%)
|
0.138
|
|
Malignancy
|
28 (5.5%)
|
13 (4.6%)
|
12 (7.4%)
|
3 (4.3%)
|
0.412
|
|
Infection and Inflammation
|
|
|
|
|
|
|
White blood cell (x109/L)
|
5.65 (4.38-7.60)
|
5.08 (4.04-6.64)
|
6.12 (4.66-8.34)
|
9.74 (7.19-12.27)
|
<0.001
|
|
Neutrophil (x109/L)
|
3.98 (2.97-6.32)
|
3.46 (2.62-4.38)
|
4.82 (3.48-6.73)
|
8.53 (6.30-11.41)
|
<0.001
|
|
Lymphocyte (x109/L)
|
0.93 (0.68-1.27)
|
1.08 (0.82-1.47)
|
0.77 (0.59-1.04)
|
0.54 (0.44-0.80)
|
<0.001
|
|
Procalcitonin (ng/mL)
|
0.09 (0.05-0.16)
|
0.06 (0.04-0.09)
|
0.12 (0.07-0.20)
|
0.33 (0.17-0.89)
|
<0.001
|
|
C-reactive protein (mg/L)
|
34.82 (11.10-71.97)
|
16.55 (4.00-38.99)
|
52.82 (29.27-77.53)
|
114.60 (74.27-138.80)
|
<0.001
|
|
Erythrocyte sedimentation rate (mm/h)
|
46 (25-69)
|
34 (19-53)
|
61 (44-80)
|
71 (44-82)
|
<0.001
|
|
Ferritin (ng/mL)
|
332.1 (127.1-768.9)
|
160.2 (101.7-300.2)
|
620.1 (391.0-862.8)
|
1768.2 (1215.3-2000.0)
|
<0.001
|
|
Fibrinogen (g/L)
|
4.44 (3.58-5.07)
|
4.14 (3.35-4.95)
|
4.73 (4.04-5.19)
|
4.58 (2.48-5.52)
|
<0.001
|
Note: Continuous variables are presented as median (25th-75th percentiles), and categorical variables are presented as count (percentage).
Alimentary symptoms and liver function injury
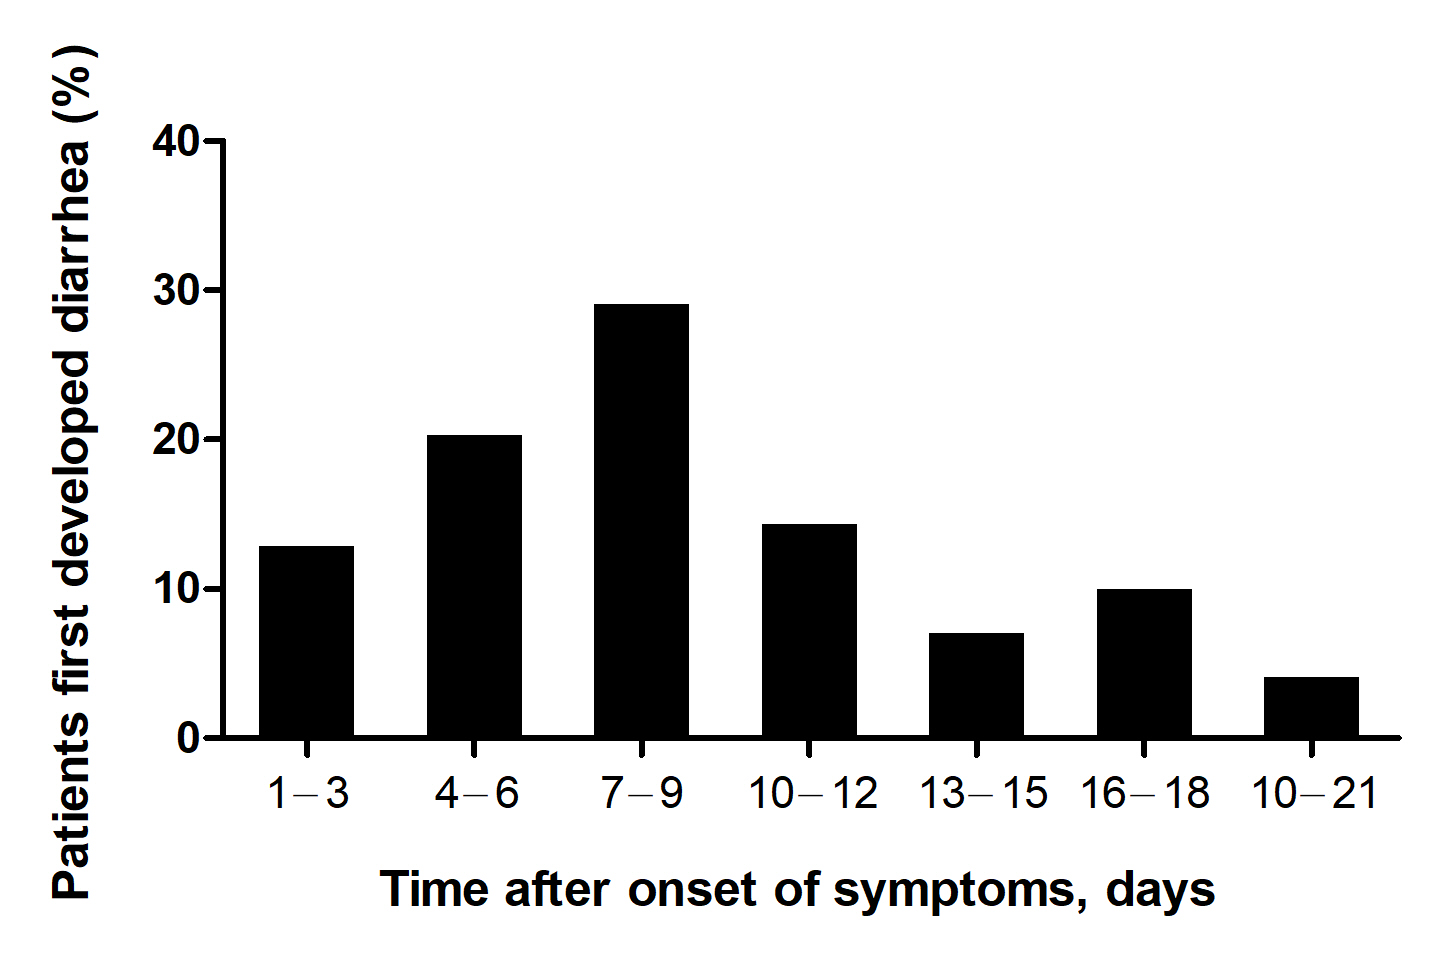
A series of alimentary symptoms including poor appetite (50.2%), diarrhea (25.5%), nausea (16.3%), vomit (11.9%) and abdominal pain (3.3%) presented in COVID-19 patients (Table 2). Diarrhea was quite common gastrointestinal symptom with higher morbidity in the severe and critical patients (32.1% and 27.1% respectively) than the mild patients (21.3%). The diarrhea was mainly watery in nature without mucus or blood, and abdominal pain was rarely observed. The severity of diarrhea varied among patients, most patients had a few loose or watery stools but some patients had up to 20 bowel movements per day. About 13.2% patients developed diarrhea in the first 3 days after the onset of symptoms, and 63.2% diarrhea was occurred in the previous 10 days (Figure S1). There were 31 patients (6.03%) presented with diarrhea in the absence of respiratory symptoms, including 23 mild cases and 8 severe cases (Figure 2). Moreover, 9 patients (1.75%) had only diarrhea without fever and respiratory symptoms.
Table 2 Digestive system involvements in COVID-19 patients include the alimentary symptoms and liver function injury.
|
|
Total
(N=514)
|
Mild
(N=282)
|
Severe
(N=162)
|
Critical
(N=70)
|
P
|
|
Alimentary symptoms
|
|
|
|
|
|
|
Poor appetite
|
258 (50.2%)
|
124 (44.0%)
|
92 (56.8%)
|
42 (60.0%)
|
0.007
|
|
Nausea
|
84 (16.3%)
|
50 (17.7%)
|
27 (16.7%)
|
7 (10.0%)
|
0.291
|
|
Vomit
|
61 (11.9%)
|
33 (11.7%)
|
23 (14.2%)
|
5 (7.1%)
|
0.310
|
|
Diarrhea
|
131 (25.5%)
|
60 (21.3%)
|
52 (32.1%)
|
19 (27.1%)
|
0.040
|
|
Abdominal pain
|
17 (3.3%)
|
11 (3.9%)
|
5 (3.1%)
|
1 (1.4%)
|
0.243
|
|
Liver function injury
|
|
|
|
|
|
|
Total bilirubin (μmol/L)
|
10.8 (8.1-14.3)
|
10.2 (7.6-12.4)
|
11.5 (8.4-15.3)
|
14.9 (8.7-23.0)
|
<0.001
|
|
≤20.0μmol/L
|
458 (89.1%)
|
273 (96.8%)
|
140 (86.4%)
|
45 (64.3%)
|
<0.001
|
|
20.0∽34.2μmol/L
|
43 (8.4%)
|
9 (3.2%)
|
17 (10.5%)
|
17 (24.3%)
|
|
|
>34.2μmol/L
|
13 (2.5%)
|
0 (0.0%)
|
5 (3.1%)
|
8 (11.4%)
|
|
|
Direct bilirubin (μmol/L)
|
3.6 (2.6-4.9)
|
3.1 (2.4-4.0)
|
3.9 (3.0-5.2)
|
6.2 (4.0-10.8)
|
<0.001
|
|
≤6.8μmol/L
|
441 (85.8%)
|
269 (95.4%)
|
134 (82.7%)
|
38 (54.3%)
|
<0.001
|
|
6.8∽13.6μmol/L
|
61 (11.9%)
|
13 (4.6%)
|
23 (14.2%)
|
25 (35.7%)
|
|
|
>13.6μmol/L
|
12 (2.3%)
|
0 (0.0%)
|
5 (3.1%)
|
7 (10.0%)
|
|
|
Alanine aminotransferase (U/L)
|
34 (22-55)
|
28 (19-46)
|
41 (26-60)
|
87 (44-111)
|
<0.001
|
|
≤40U/L
|
290 (56.6%)
|
185 (65.8%)
|
81 (50.0%)
|
24 (34.8%)
|
<0.001
|
|
40∽80 U/L
|
163 (31.8%)
|
82 (29.2%)
|
59 (36.4%)
|
22 (31.9%)
|
|
|
≥80 U/L
|
59 (11.5%)
|
14 (5.0%)
|
22 (13.6%)
|
23 (33.3%)
|
|
|
Aspartate transaminase (U/L)
|
33 (23-47)
|
27 (20-39)
|
38 (26-55)
|
67 (44-82)
|
<0.001
|
|
≤40U/L
|
324 (63.3%)
|
222 (79.0%)
|
88 (54.3%)
|
14 (20.3%)
|
<0.001
|
|
40∽80 U/L
|
150 (29.3%)
|
55 (19.6%)
|
59 (36.4%)
|
36 (52.2%)
|
|
|
≥80 U/L
|
38 (7.4%)
|
4 (1.4%)
|
15 (9.3%)
|
19 (27.5%)
|
|
|
Lactate dehydrogenase (U/L)
|
277 (211-371)
|
229 (192-295)
|
314 (251-385)
|
561 (396-680)
|
<0.001
|
|
≤245U/L
|
204 (39.7%)
|
167 (59.4%)
|
37 (22.7%)
|
0 (0.0%)
|
<0.001
|
|
>245U/L
|
310 (60.3%)
|
115 (40.6%)
|
125 (77.3%)
|
70 (100.0%)
|
|
|
Alkaline phosphatase (U/L)
|
54 (43-71)
|
52 (43-66)
|
53 (43-67)
|
78 (62-122)
|
<0.001
|
|
≤150U/L
|
496 (96.5%)
|
280 (99.3%)
|
156 (96.3%)
|
60 (85.7%)
|
<0.001
|
|
>150U/L
|
18 (3.5%)
|
2 (0.7%)
|
6 (3.7%)
|
10 (14.3%)
|
|
|
γ-Glutamyl transferase (U/L)
|
31 (20-56)
|
27 (17-47)
|
33 (23-67)
|
60 (28-116)
|
<0.001
|
|
≤60U/L
|
396 (77.0%)
|
246 (87.2%)
|
115 (71.2%)
|
35 (50.0%)
|
<0.001
|
|
60∽120 U/L
|
67 (13.0%)
|
22 (7.8%)
|
28 (17.2%)
|
17 (24.3%)
|
|
|
≥120 U/L
|
51 (9.9%)
|
14 (5.0%)
|
19 (11.7%)
|
18 (25.7%)
|
|
|
Pre-albumin (g/L)
|
129.8 (90.4-186.5)
|
149.7 (117.5-207.3)
|
111.6 (80.5-156.2)
|
84.5 (56.2-109.9)
|
<0.001
|
|
Albumin (g/L)
|
30.1 (26.8-33.9)
|
32.1 (28.5-35.3)
|
28.8 (25.9-31.6)
|
26.8 (24.1-29.0)
|
<0.001
|
|
≥35 g/L
|
98 (19.1%)
|
79 (28.1%)
|
15 (9.2%)
|
4 (5.7%)
|
<0.001
|
|
30∽35 g/L
|
164 (31.9%)
|
111 (39.2%)
|
46 (27.6%)
|
9 (12.9%)
|
|
|
≤30 g/L
|
252 (49.0%)
|
92 (32.7%)
|
103 (63.2%)
|
57 (81.4%)
|
|
|
Globulin (g/L)
|
31.6 (28.6-35.2)
|
30.9 (27.8-33.6)
|
32.0 (29.3-36.1)
|
35.7 (31.2-39.5)
|
<0.001
|
|
≤30 g/L
|
180 (35.0%)
|
116 (41.3%)
|
51 (30.7%)
|
14 (20.0%)
|
<0.001
|
|
30∽35 g/L
|
203 (39.5%)
|
127 (44.8%)
|
59 (36.2%)
|
18 (25.7%)
|
|
|
≥35 g/L
|
131 (25.5%)
|
39 (13.9%)
|
54 (33.1%)
|
38 (54.3%)
|
|
|
Albumin/Globulin
|
1.0 (0.8-1.1)
|
1.0 (0.9-1.2)
|
0.9 (0.7-1.1)
|
0.8 (0.6-0.9)
|
<0.001
|
Note: Continuous variables are presented as median (25th-75th percentiles), and categorical variables are presented as count (percentage).
Liver injury was also frequently observed in patients with COVID-19 (Table 2), with increased ALT (43.3%), AST (36.7%) and decreased albumin (80.9%), but less increased total bilirubin (10.9%) and direct bilirubin (14.2%), which were more common in the severe to critical patients. It indicated a major damage of the hepatocytes and synthetic function, but not the function of bile secretion, in COVID-19 associated liver injury. However, most of the cases were mild injury. Those with relatively severe liver damage (ALT≥80 U/L) only accounted for 7.4% of the total patients, and 27.5% of the critical suffers. The liver injury was associated with higher inflammatory activity, such as increased white blood cell and neutrophil counts but declined lymphocyte counts, and elevated levels of CRP, ESR, procalcitonin and ferritin (Table S2).
Clinical characteristics of patients with and without diarrhea
There were 131 patients (25.49%, including 60 mild and 71 severe/critical cases) presented with diarrhea, and 383 patients (74.51%, including 222 mild and 161 severe/critical cases) without diarrhea (Figure 2). In the mild cases, patients with diarrhea had only slightly increased neutrophil (P=0.021) and decreased lymphocyte (P=0.011), but had no significant difference in multiorgan functions, compared with those absent of diarrhea (Table 3). In the severe/critical cases, there was increased WBC (P=0.030) and neutrophil (P=0.010) and trend to decreased lymphocyte (P=0.082), as well as higher level of inflammatory ferritin in patients with diarrhea relative to those without diarrhea. Moreover, diarrhea evidently companied with the more serious liver injury with increased activities of serum ALT, AST and LDH, and raised levels of total and direct bilirubin (Table 3).
Table 3 Comparisons of COVID-19 patients with and without diarrhea, including the systemic inflammation and multiorgan function.
|
|
Mild patients
|
Severe/ Critical patients
|
|
With Diarrhea
(N=60)
|
Without Diarrhea (N=222)
|
P
|
With Diarrhea
(N=71)
|
Without Diarrhea (N=161)
|
P
|
|
Age (years)
|
52 (38-63)
|
54 (46-66)
|
0.068
|
65 (57-72)
|
64 (57-71)
|
0.798
|
|
Gender (m/f)
|
26/34
|
109/113
|
0.428
|
43/28
|
93/68
|
0.690
|
|
Fever
|
45 (75.0%)
|
192 (86.5%)
|
0.045
|
62 (87.3%)
|
151 (93.8%)
|
0.098
|
|
Highest temperature, °C
|
38.3 (37.7-38.9)
|
38.5 (37.8-39.0)
|
0.140
|
38.7 (38.0-39.0)
|
38.5 (38.0-39.0)
|
0.542
|
|
Infection and Inflammation
|
|
|
|
|
|
|
|
White blood cell (x109/L)
|
5.08 (4.03-6.27)
|
5.08 (4.07-6.70)
|
0.387
|
7.45 (5.07-10.14)
|
6.28 (4.50-8.49)
|
0.030
|
|
Neutrophil (x109/L)
|
3.51 (2.66-4.76)
|
3.23 (2.40-3.96)
|
0.021
|
6.29 (3.91-8.48)
|
4.50 (3.04-7.32)
|
0.010
|
|
Lymphocyte (x109/L)
|
1.05 (0.81-1.40)
|
1.17 (0.90-1.88)
|
0.011
|
0.61 (0.42-0.89)
|
0.79 (0.57-1.07)
|
0.082
|
|
Procalcitonin (ng/mL)
|
0.06 (0.04-0.09)
|
0.05 (0.04-0.09)
|
0.119
|
0.14 (0.09-0.28)
|
0.14 (0.07-0.40)
|
0.571
|
|
C-reactive protein (mg/L)
|
17.52 (3.90-36.85)
|
16.55 (4.25-39.00)
|
0.956
|
67.35 (38.70-109.60)
|
65.92 (26.82-98.94)
|
0.499
|
|
Erythrocyte sedimentation rate (mm/h)
|
31.0 (18.0-44.0)
|
34.5 (20.3-53.8)
|
0.327
|
62.5 (44.0-80.3)
|
60.5 (42.5-81.0)
|
0.689
|
|
Ferritin (ng/mL)
|
173.9 (98.8-300.0)
|
160.2 (105.4-300.2)
|
0.896
|
818.0 (547.8-1562.3)
|
663.1 (404.8-1298.0)
|
0.041
|
|
Fibrinogen (g/L)
|
4.03 (3.39-4.88)
|
4.18 (3.48-5.01)
|
0.460
|
4.65 (4.03-5.21)
|
4.68 (3.85-5.38)
|
0.786
|
|
Multiorgan function injury
|
|
|
|
|
|
|
|
Total bilirubin (μmol/L)
|
10.5 (7.6-11.7)
|
10.2 (7.7-12.7)
|
0.632
|
12.5 (8.8-16.5)
|
10.5 (7.1-15.9)
|
0.024
|
|
Direct bilirubin (μmol/L)
|
3.1 (2.4-3.7)
|
3.0 (2.4-4.3)
|
0.339
|
4.6 (3.2-6.5)
|
3.8 (2.7-6.4)
|
0.046
|
|
Alanine aminotransferase (U/L)
|
24.0 (18.8-42.0)
|
30.0 (19.0-48.0)
|
0.230
|
53.0 (33.4-71.4)
|
43.0 (28.0-70.5)
|
0.036
|
|
Aspartate transaminase (U/L)
|
27.0 (21.8-34.3)
|
28.0 (20.0-39.0)
|
0.803
|
54.0 (33.8-74.5)
|
44.0 (31.0-68.3)
|
0.045
|
|
Lactate dehydrogenase (U/L)
|
225.5 (188.8-297.8)
|
229.0 (194.0-294.0)
|
0.634
|
381.5 (293.5-521.3)
|
320.0 (241.5-398.0)
|
<0.001
|
|
Pre-albumin (g/L)
|
155.4 (122.8-241.1)
|
148.7 (115.8-205.2)
|
0.198
|
101.5 (72.4-133.6)
|
106.1 (73.9-139.9)
|
0.925
|
|
Albumin (g/L)
|
32.5 (28.4-35.2)
|
33.5 (30.8-35.4)
|
0.413
|
27.2 (25.8-30.2)
|
28.3 (25.5-30.9)
|
0.443
|
|
Globulin (g/L)
|
30.9 (27.5-33.6)
|
30.9 (28.1-33.6)
|
0.452
|
33.6 (29.5-36.3)
|
33.0 (30.0-38.0)
|
0.663
|
|
High sensitive troponin I (ng/L)
|
3.3 (2.2-8.0)
|
3.9 (2.2-7.5)
|
0.590
|
8.90 (4.90-32.60)
|
5.90 (3.95-23.20)
|
0.076
|
|
Blood urea nitrogen (mmol/L)
|
4.03 (3.15-4.91)
|
4.09 (3.18-5.12)
|
0.667
|
5.17 (3.81-7.33)
|
5.09 (3.73-7.50)
|
0.905
|
|
Creatinine (μmol/L)
|
65.2 (53.7-82.9)
|
63.8 (54.7-78.9)
|
0.714
|
72.0 (58.6-88.0)
|
70.0 (58.7-87.9)
|
0.771
|
|
D-dimer (μg/mL)
|
0.41 (0.16-0.77)
|
0.37 (0.22-0.69)
|
0.604
|
0.93 (0.43-6.77)
|
0.55 (0.34-2.46)
|
0.039
|
|
Urine Protein (+)
|
0 (0.0%)
|
4 (1.9%)
|
0.299
|
14 (20.9%)
|
36 (25.0%)
|
0.514
|
|
Urine occult blood (+)
|
0 (0.0%)
|
11 (5.3%)
|
0.081
|
11 (16.4%)
|
26 (18.1%)
|
0.771
|
|
Fecal occult blood (+)
|
1 (1.8%)
|
2 (1.0%)
|
0.603
|
6 (9.0%)
|
1 (0.7%)
|
0.002
|
Continuous variables are presented as median (25th-75th percentiles), and categorical variables are presented as count (percentage).
Clinical characteristics of diarrhea patients with and without respiratory symptoms
In the patients with diarrhea, 100 subjects (19.45%, including 37 mild and 63 severe/critical cases) presented with respiratory symptoms and 31 subjects (6.03%, including 23 mild and 8 severe cases) absent of respiratory symptoms (Table S1). As it shown, there were higher proportion of mild cases in patients with diarrhea only (74.2%) or with respiratory symptoms only (58.0%) than those with both diarrhea and respiratory symptoms (37.0%) (Figure 2). Notably, the patients with diarrhea in the absence of respiratory symptoms were observed less systemic inflammatory activity, including the lower levels of CRP, ESR and Ferritin, relative to diarrhea combined with respiratory symptoms (Table 4).
Table 4 Comparisons of COVID-19 patients with diarrhea who are present and absent of respiratory symptoms.
|
|
Mild patients with Diarrhea
|
Severe/ Critical patients with Diarrhea
|
|
With respiratory symptoms
(N=37)
|
Without respiratory symptoms
(N=23)
|
P
|
With respiratory symptoms
(N=63)
|
Without respiratory symptoms
(N=8)
|
P
|
|
Age (years)
|
44 (34-63)
|
60 (55-63)
|
0.040
|
66 (58-72)
|
58 (55-63)
|
0.057
|
|
Gender (m/f)
|
21/16
|
5/18
|
0.008
|
37/26
|
6/2
|
0.375
|
|
Fever
|
28 (75.7%)
|
17 (73.91%)
|
0.878
|
56 (88.89%)
|
6 (75.00%)
|
0.266
|
|
Highest temperature, °C
|
38.4 (37.7-38.9)
|
38.0 (37.5-38.8)
|
0.385
|
38.8 (38.0-39.0)
|
38.3 (38.0-38.7)
|
0.158
|
|
Infection and Inflammation
|
|
|
|
|
|
|
|
White blood cell (x109/L)
|
5.14 (4.26-6.08)
|
4.67 (3.90-6.38)
|
0.704
|
6.43 (4.50-8.49)
|
5.94 (4.88-8.27)
|
0.964
|
|
Neutrophil (x109/L)
|
3.29 (2.41-3.82)
|
3.20 (2.46-4.00)
|
0.921
|
4.50 (2.98-7.32)
|
4.58 (3.76-7.14)
|
0.750
|
|
Lymphocyte (x109/L)
|
1.17 (0.75-1.97)
|
1.08 (0.96-1.71)
|
0.755
|
0.77 (0.54-1.04)
|
0.72 (0.51-0.88)
|
0.363
|
|
Procalcitonin (ng/mL)
|
0.06 (0.04-0.09)
|
0.07 (0.06-0.18)
|
0.087
|
0.14 (0.07-0.45)
|
0.15 (0.10-0.22)
|
0.960
|
|
C-reactive protein (mg/L)
|
21.11 (5.11-52.09)
|
4.55 (2.13-56.19)
|
0.041
|
79.74 (36.82-118.94)
|
51.87 (34.79-101.75)
|
0.034
|
|
Erythrocyte sedimentation rate (mm/h)
|
34 (20-61)
|
18 (18-32)
|
0.033
|
61 (45-81)
|
46 (35-71)
|
0.046
|
|
Ferritin (ng/mL)
|
240.62 (143.99-344.87)
|
155.74 (98.80-234.85)
|
0.042
|
960.61 (663.69-1439.03)
|
660.02 (364.72-1258.32)
|
0.026
|
|
Fibrinogen (g/L)
|
3.92 (3.20-4.68)
|
3.72 (3.05-4.69)
|
0.738
|
4.68 (3.81-5.38)
|
4.73 (4.42-5.12)
|
0.709
|
|
Multiorgan function injury
|
|
|
|
|
|
|
|
Total bilirubin (μmol/L)
|
9.60 (7.60-12.40)
|
10.60 (8.20-10.90)
|
0.933
|
10.90 (7.05-16.20)
|
9.60 (7.25-11.75)
|
0.757
|
|
Direct bilirubin (μmol/L)
|
3.00 (2.40-3.70)
|
3.20 (2.30-3.65)
|
0.709
|
3.80 (3.05-7.15)
|
3.15 (2.53-4.15)
|
0.358
|
|
Alanine aminotransferase (U/L)
|
26 (19-41)
|
22 (18-44)
|
0.386
|
52 (32-75)
|
38 (25-52)
|
0.034
|
|
Aspartate transaminase (U/L)
|
25 (21-35)
|
30 (23-34)
|
0.749
|
49 (31-77)
|
33 (27-54)
|
0.032
|
|
Lactate dehydrogenase (U/L)
|
218 (189-271)
|
227 (176-312)
|
0.808
|
314 (241-374)
|
406 (296-440)
|
0.220
|
|
Pre-albumin (g/L)
|
151.4 (128.5-212.0)
|
172.3 (114.4-266.7)
|
0.533
|
113.6 (73.9-147.7)
|
86.1 (75.0-106.4)
|
0.187
|
|
Albumin (g/L)
|
33.4 (30.7-36.9)
|
34.2 (32.6-35.1)
|
0.885
|
27.2 (25.7-30.5)
|
27.9 (26.4-28.8)
|
0.913
|
|
Globulin (g/L)
|
30.2 (27.5-34.3)
|
31.4 (27.8-32.9)
|
0.796
|
33.6 (29.5-36.2)
|
33.0 (28.9-36.5)
|
0.877
|
|
High sensitive troponin I (ng/L)
|
4.40 (2.60-11.10)
|
2.80 (1.37-3.32)
|
0.017
|
6.30 (4.20-28.20)
|
4.30 (3.65-14.05)
|
0.424
|
|
Blood urea nitrogen (mmol/L)
|
3.55 (3.06-4.37)
|
4.48 (3.51-5.46)
|
0.023
|
5.24 (4.04-8.30)
|
4.68 (3.26-4.91)
|
0.042
|
|
Creatinine (μmol/L)
|
66.0 (59.0-89.6)
|
60.8 (50.5-74.8)
|
0.188
|
71.2 (58.5-98.4)
|
63.5 (60.8-68.5)
|
0.141
|
|
D-dimer (μg/mL)
|
0.38 (0.16-0.71)
|
0.43 (0.26-0.85)
|
0.365
|
0.55 (0.34-2.90)
|
0.59 (0.48-1.69)
|
0.891
|
|
Urine Protein (+)
|
0 (0.0%)
|
0 (0.0%)
|
-
|
13 (22.03%)
|
1 (12.5%)
|
-
|
|
Urine occult blood (+)
|
0 (0.0%)
|
0 (0.0%)
|
-
|
11 (18.64%)
|
0 (0.0%)
|
-
|
|
Fecal occult blood (+)
|
1 (2.7%)
|
0 (0.0%)
|
-
|
6 (10.17%)
|
0 (0.0%)
|
-
|
Note: Continuous variables are presented as median (25th-75th percentiles), and categorical variables are presented as count (percentage).