Candidalysin is the main driver of transcriptional alterations in OECs during C. albicans infection
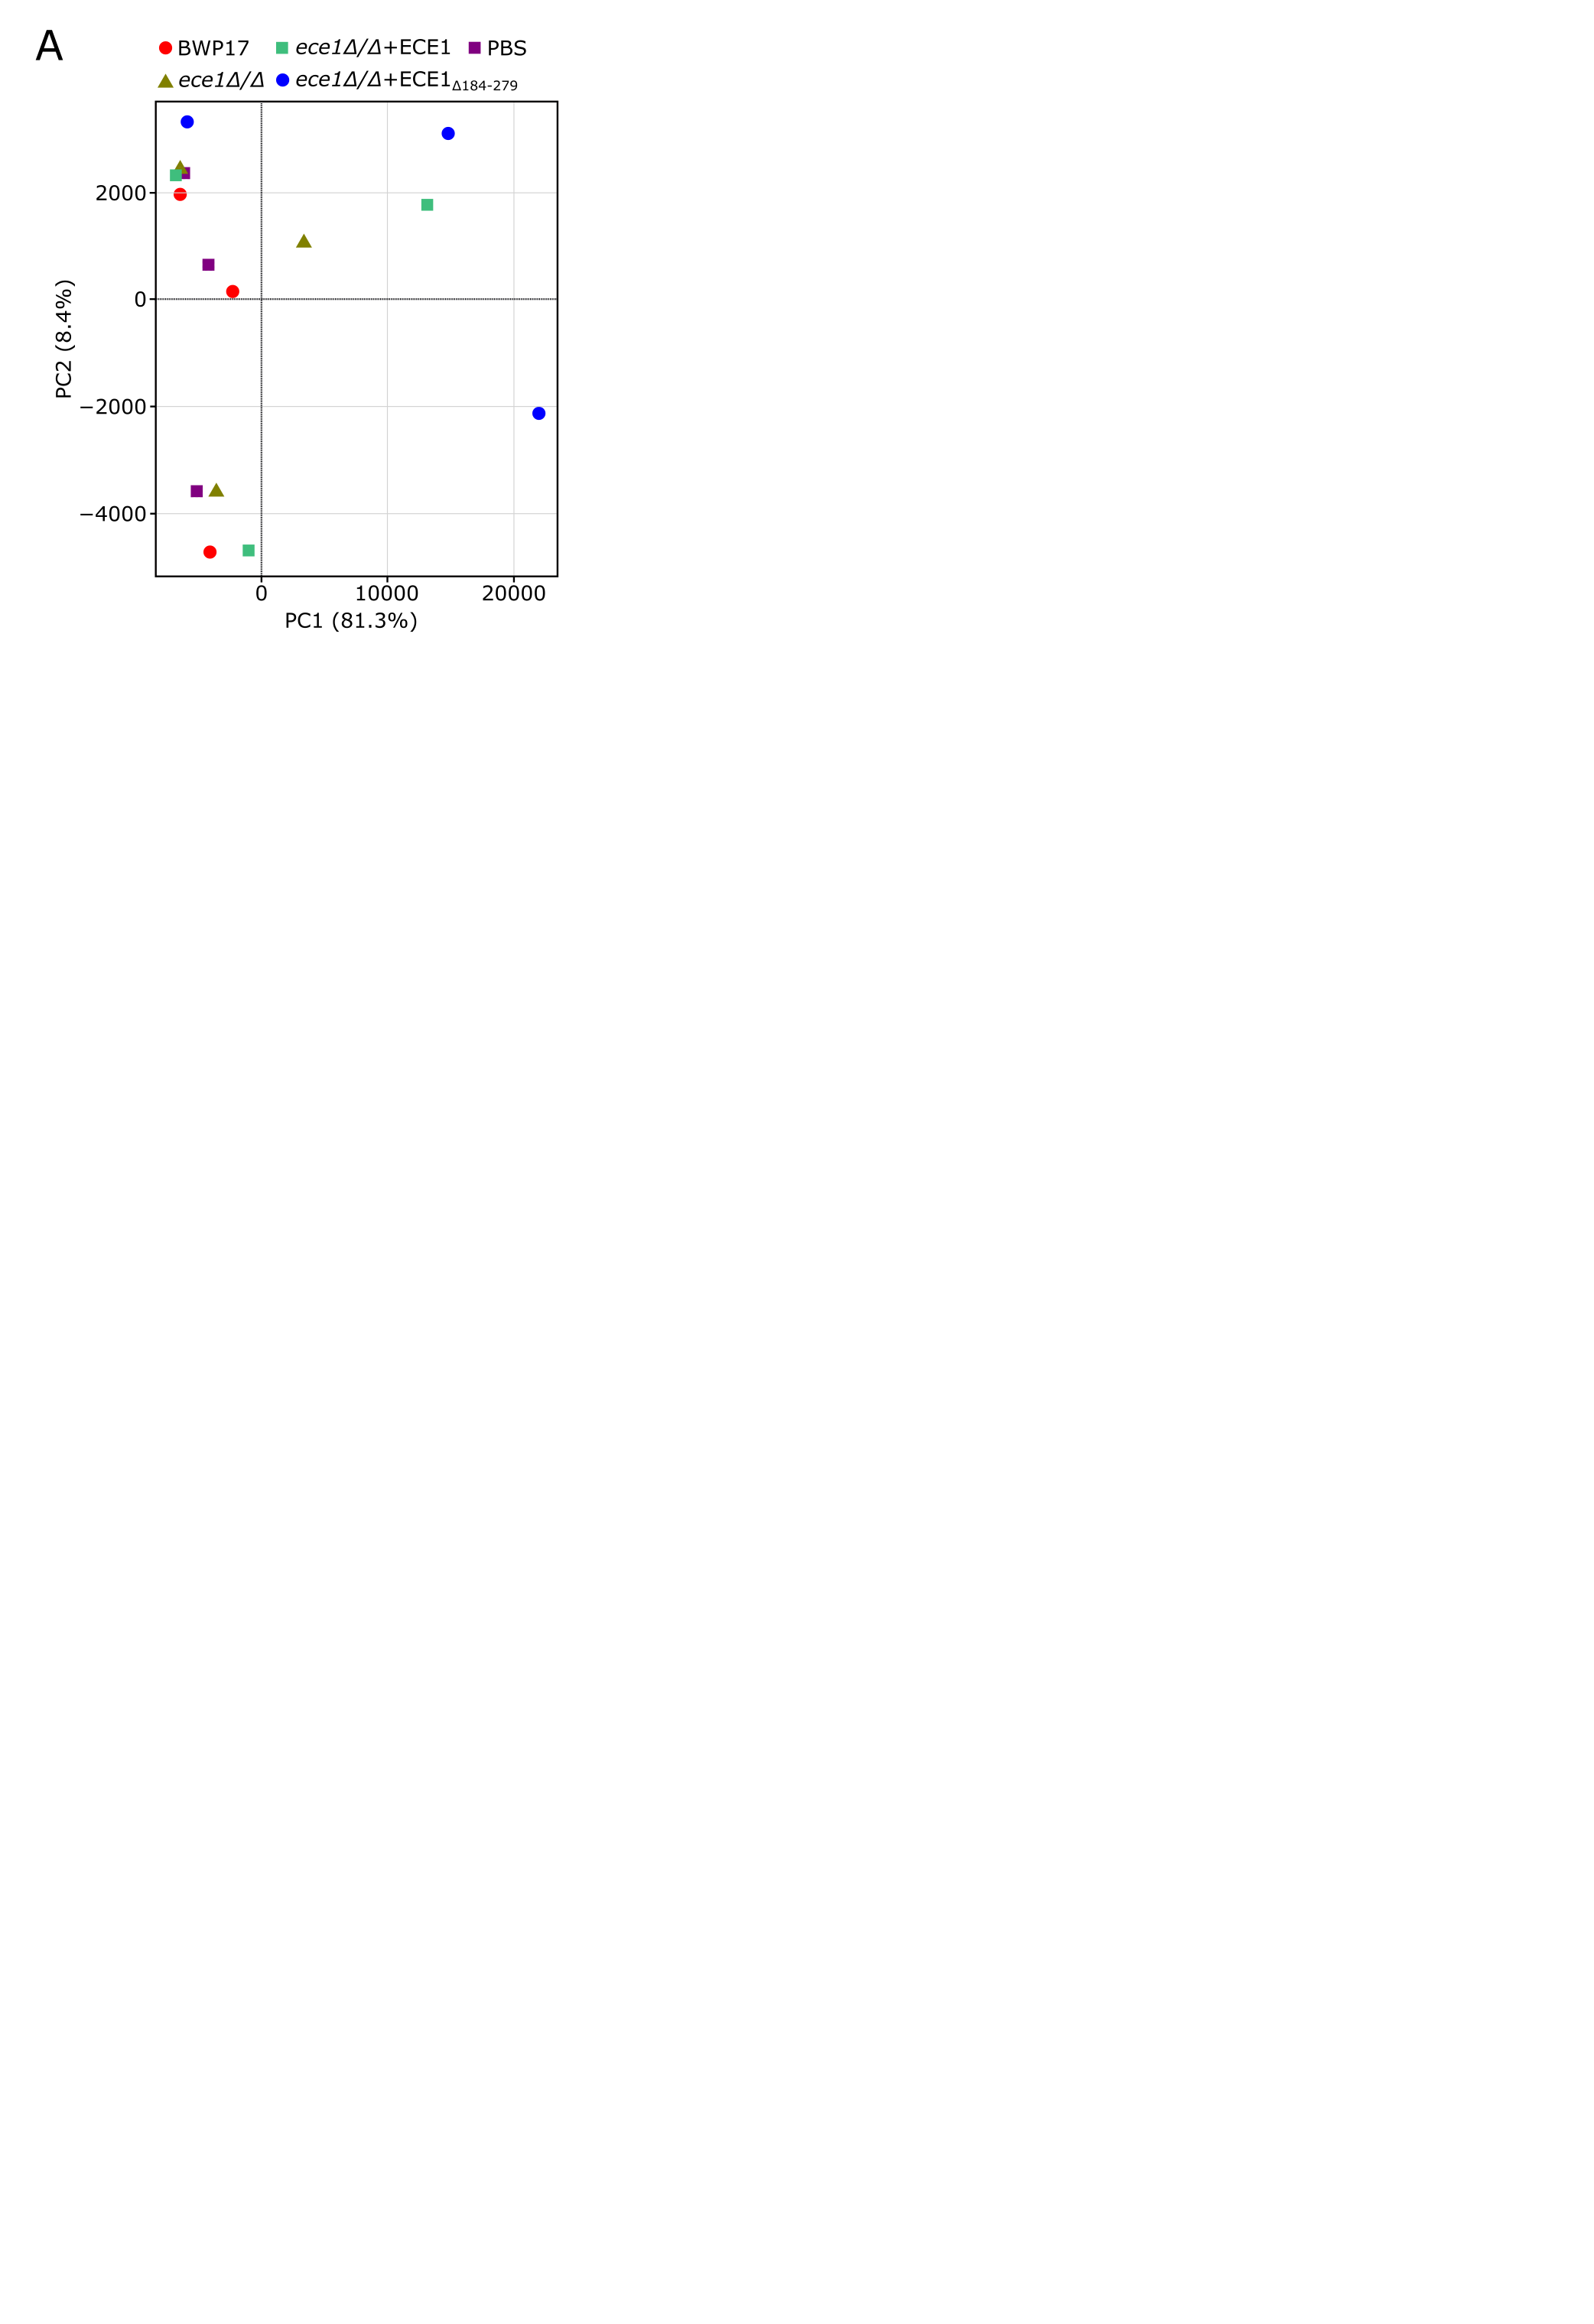
To identify the pathways mediating host cellular responses to C. albicans and the impact of its peptide toxin candidalysin during mucosal infection, we explored the transcriptomic changes of the human OEC cell line TR146 infected with wild-type (BWP17 + CIp30), candidalysin null (ece1Δ/Δ and ece1Δ/Δ + ECE1Δ184−279), and revertant (ece1Δ/Δ + ECE1) mutant C. albicans strains for 2 or 4 h. RNA-Seq analyses showed greater transcriptional changes as C. albicans infection progressed over time (Fig. 1A, B; S1A). Notably, fungal strains expressing candidalysin (BWP17 + CIp30 and ece1Δ/Δ + ECE1) clustered together but separately from another cluster containing candidalysin-deficient strains (ece1Δ/Δ and ece1Δ/Δ + ECE1Δ184−279), both clusters being distinct from PBS-treated cells. Similarly, our analyses showed strong correlations among samples of candidalysin-expressing strains at 4 h post-infection, with fewer significant correlations in samples at 2 h post-infection (Fig. 1C).
A set of 102 genes were significantly upregulated (false discovery rate (FDR) < 0.01) in the presence of all four C. albicans strains 4 h post-infection (Fig. 1D; Table S1), suggesting these might be key regulators of the early oral epithelium response to a fungal infection (0–4 h post-infection). These included genes involved in the epithelial immune response to C. albicans, such as the pro-inflammatory cytokines IL1A, IL1B, and IL36G, the chemokines CXCL8 and CCL20, and the transcription factors JUN, FOS, and FOSL1. Of note, some of these genes displayed a candidalysin-dependent response, as their expression was less prominent in strains with either partial (ece1Δ/Δ + ECE1Δ184−279) or complete (ece1Δ/Δ) ECE1 deletion (Fig. 2A), in accordance with previous experimental observations (Moyes et al., 2016; Naglik et al., 2019; Verma et al., 2018).
Central carbon metabolism in epithelial cells is regulated during C. albicans infection
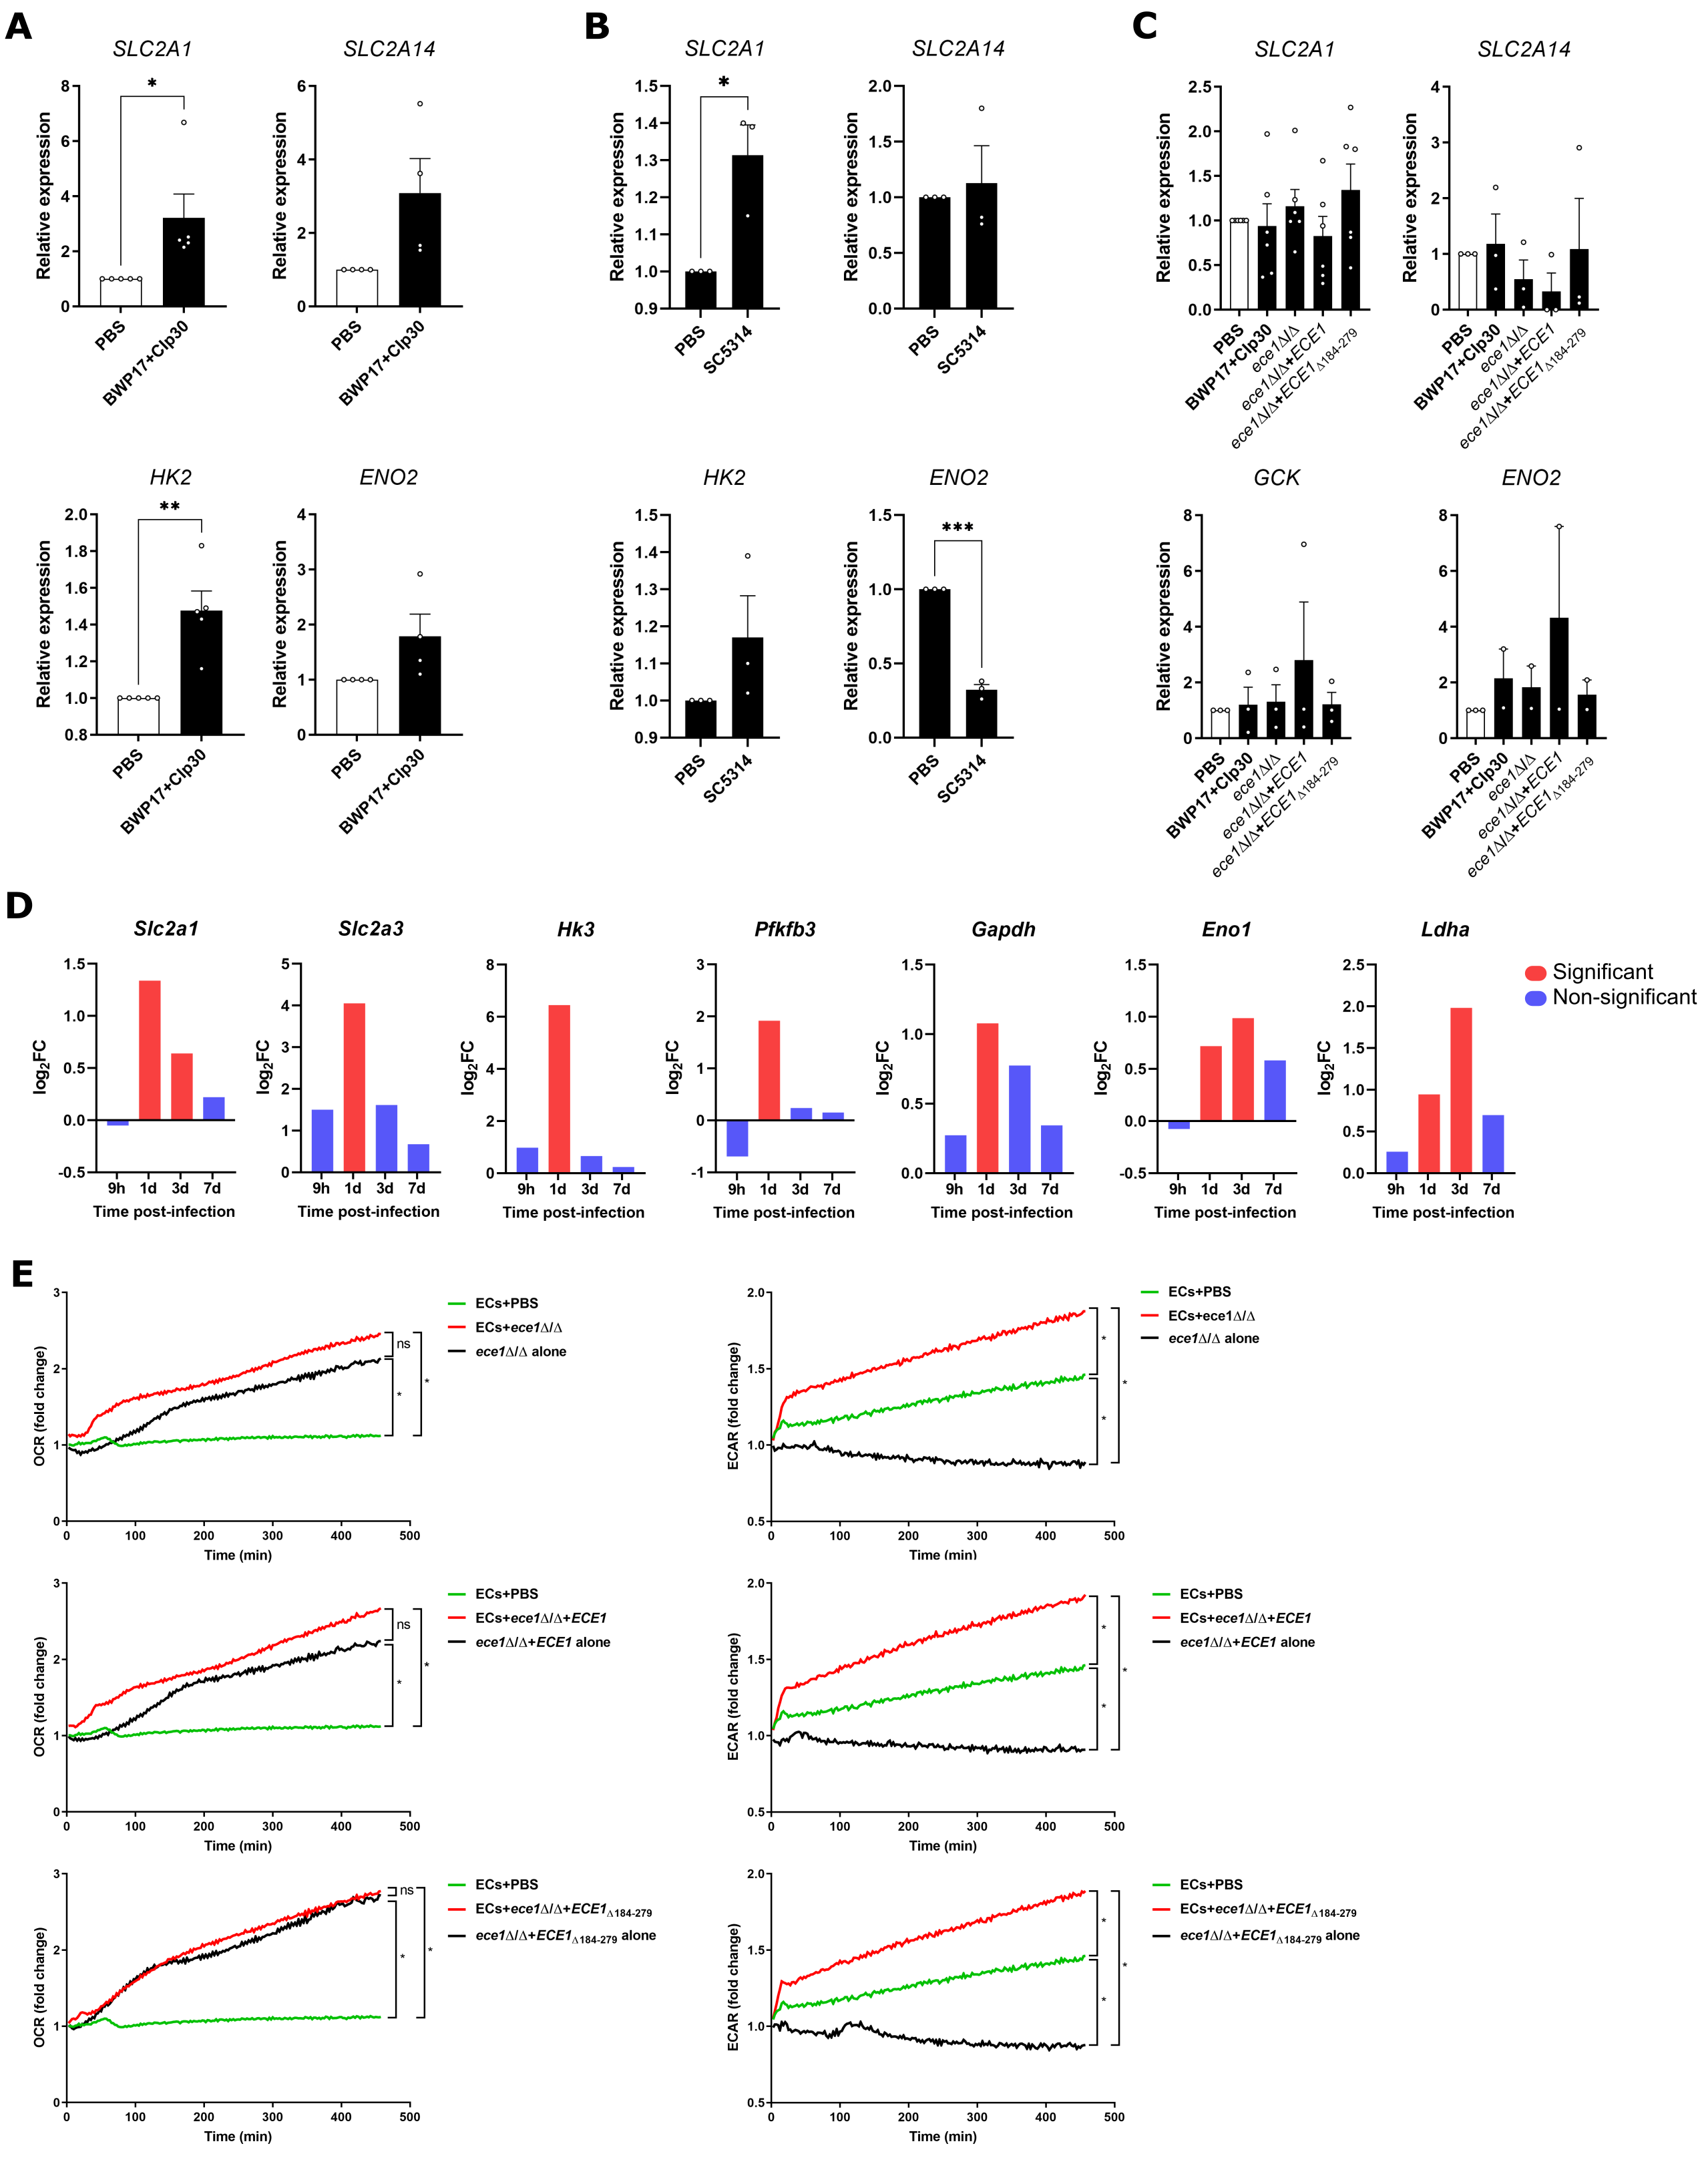
Our transcriptomic profiling indicated that C. albicans induced metabolic reprogramming of epithelial cells, as described in macrophages (Domínguez-Andrés et al., 2017; Tucey et al., 2018). Most notably, hexose uptake and processing genes showed increased expression upon fungal infection (Fig. 2A). This group of genes included the glucose transporters SLC2A1, SLC2A3, and SLC2A14, along with the glycolytic enzymes HK2, PFKFB4, and LDHA. Furthermore, SLC2A3 and SLC2A14 showed partial regulation by candidalysin (Fig. 2A). Of note, SLC2A3 and its duplicon SLC2A14 both showed a candidalysin-dependent upregulation, being substantially higher in cells infected by candidalysin-producing strains (BWP17 + CIp30 and ece1Δ/Δ + ECE1) than in those infected by candidalysin deficient strains (ece1Δ/Δ, ece1Δ/Δ + ECE1Δ184−279). We validated our expression data using RT-qPCR in TR146 cells 4 h post-infection with the same panel of fungal strains, confirming the upregulation of all three glucose transporters (Fig. 2B). Further gene expression analyses using RT-qPCR showed the downregulation of the class II glucose transporter SLC2A9 and the increased induction of the glycolytic genes GCK and ENO2 (Fig. 2B). Similar trends for these genes were observed in the non-carcinoma DOK cell line (Figure S2A) and reconstituted oral epithelial models constructed with primary epithelial cells (Figure S2B). Notably, gene expression returned to basal levels 24 h post-infection (Figure S2C), suggesting that metabolic reprogramming is transient. This transitory metabolic shift was also observed when analysing previously published time-course transcriptomics data from an OPC mouse model (Kirchner et al., 2019) in which the increased expression of glucose transporters, particularly Slc2a3, peaked one day post-infection and then declined (Figure S2D).
Next, we addressed the functional consequences of gene upregulation in epithelial cells upon infection. Whilst challenge with C. albicans did not affect oxidative phosphorylation, as determined by the oxygen consumption rate (OCR) of DOK cells (Fig. 2C), glycolysis as measured by the extracellular acidification rate (ECAR) showed a significant and sustained increase in response to infection (p < 0.05) (Fig. 2D). Of note, this increase in ECAR was observed with with all four fungal strains (Figure S2E), suggesting that changes in glycolysis are a morphology- and candidalysin-independent event.
To confirm that the Candida-induced metabolic reprogramming occurs in mucosal tissues during infection, we assessed the protein levels of key metabolic markers by immunohistochemistry in oral mucosal tissue biopsies from patients with chronic hyperplastic candidiasis (CHC) in comparison to non-infected hyperkeratosis tissue biopsies. In accordance with our in vitro observations, patients suffering from CHC showed increased membrane-associated expression levels of the glucose transporter GLUT1 (p < 0.001) (encoded by SLC2A1) in epithelial layers compared to individuals with hyperkeratosis. Similarly, the glucose transporter GLUT14 (SLC2A14) showed an increased expression trend (p < 0.0737) in CHC patients (Fig. 2E).
These datasets reveal that C. albicans infection reprograms epithelial cell metabolism towards aerobic glycolysis independently of morphology transition or candidalysin production.
Hexose metabolism controls epithelial immune responses to C. albicans
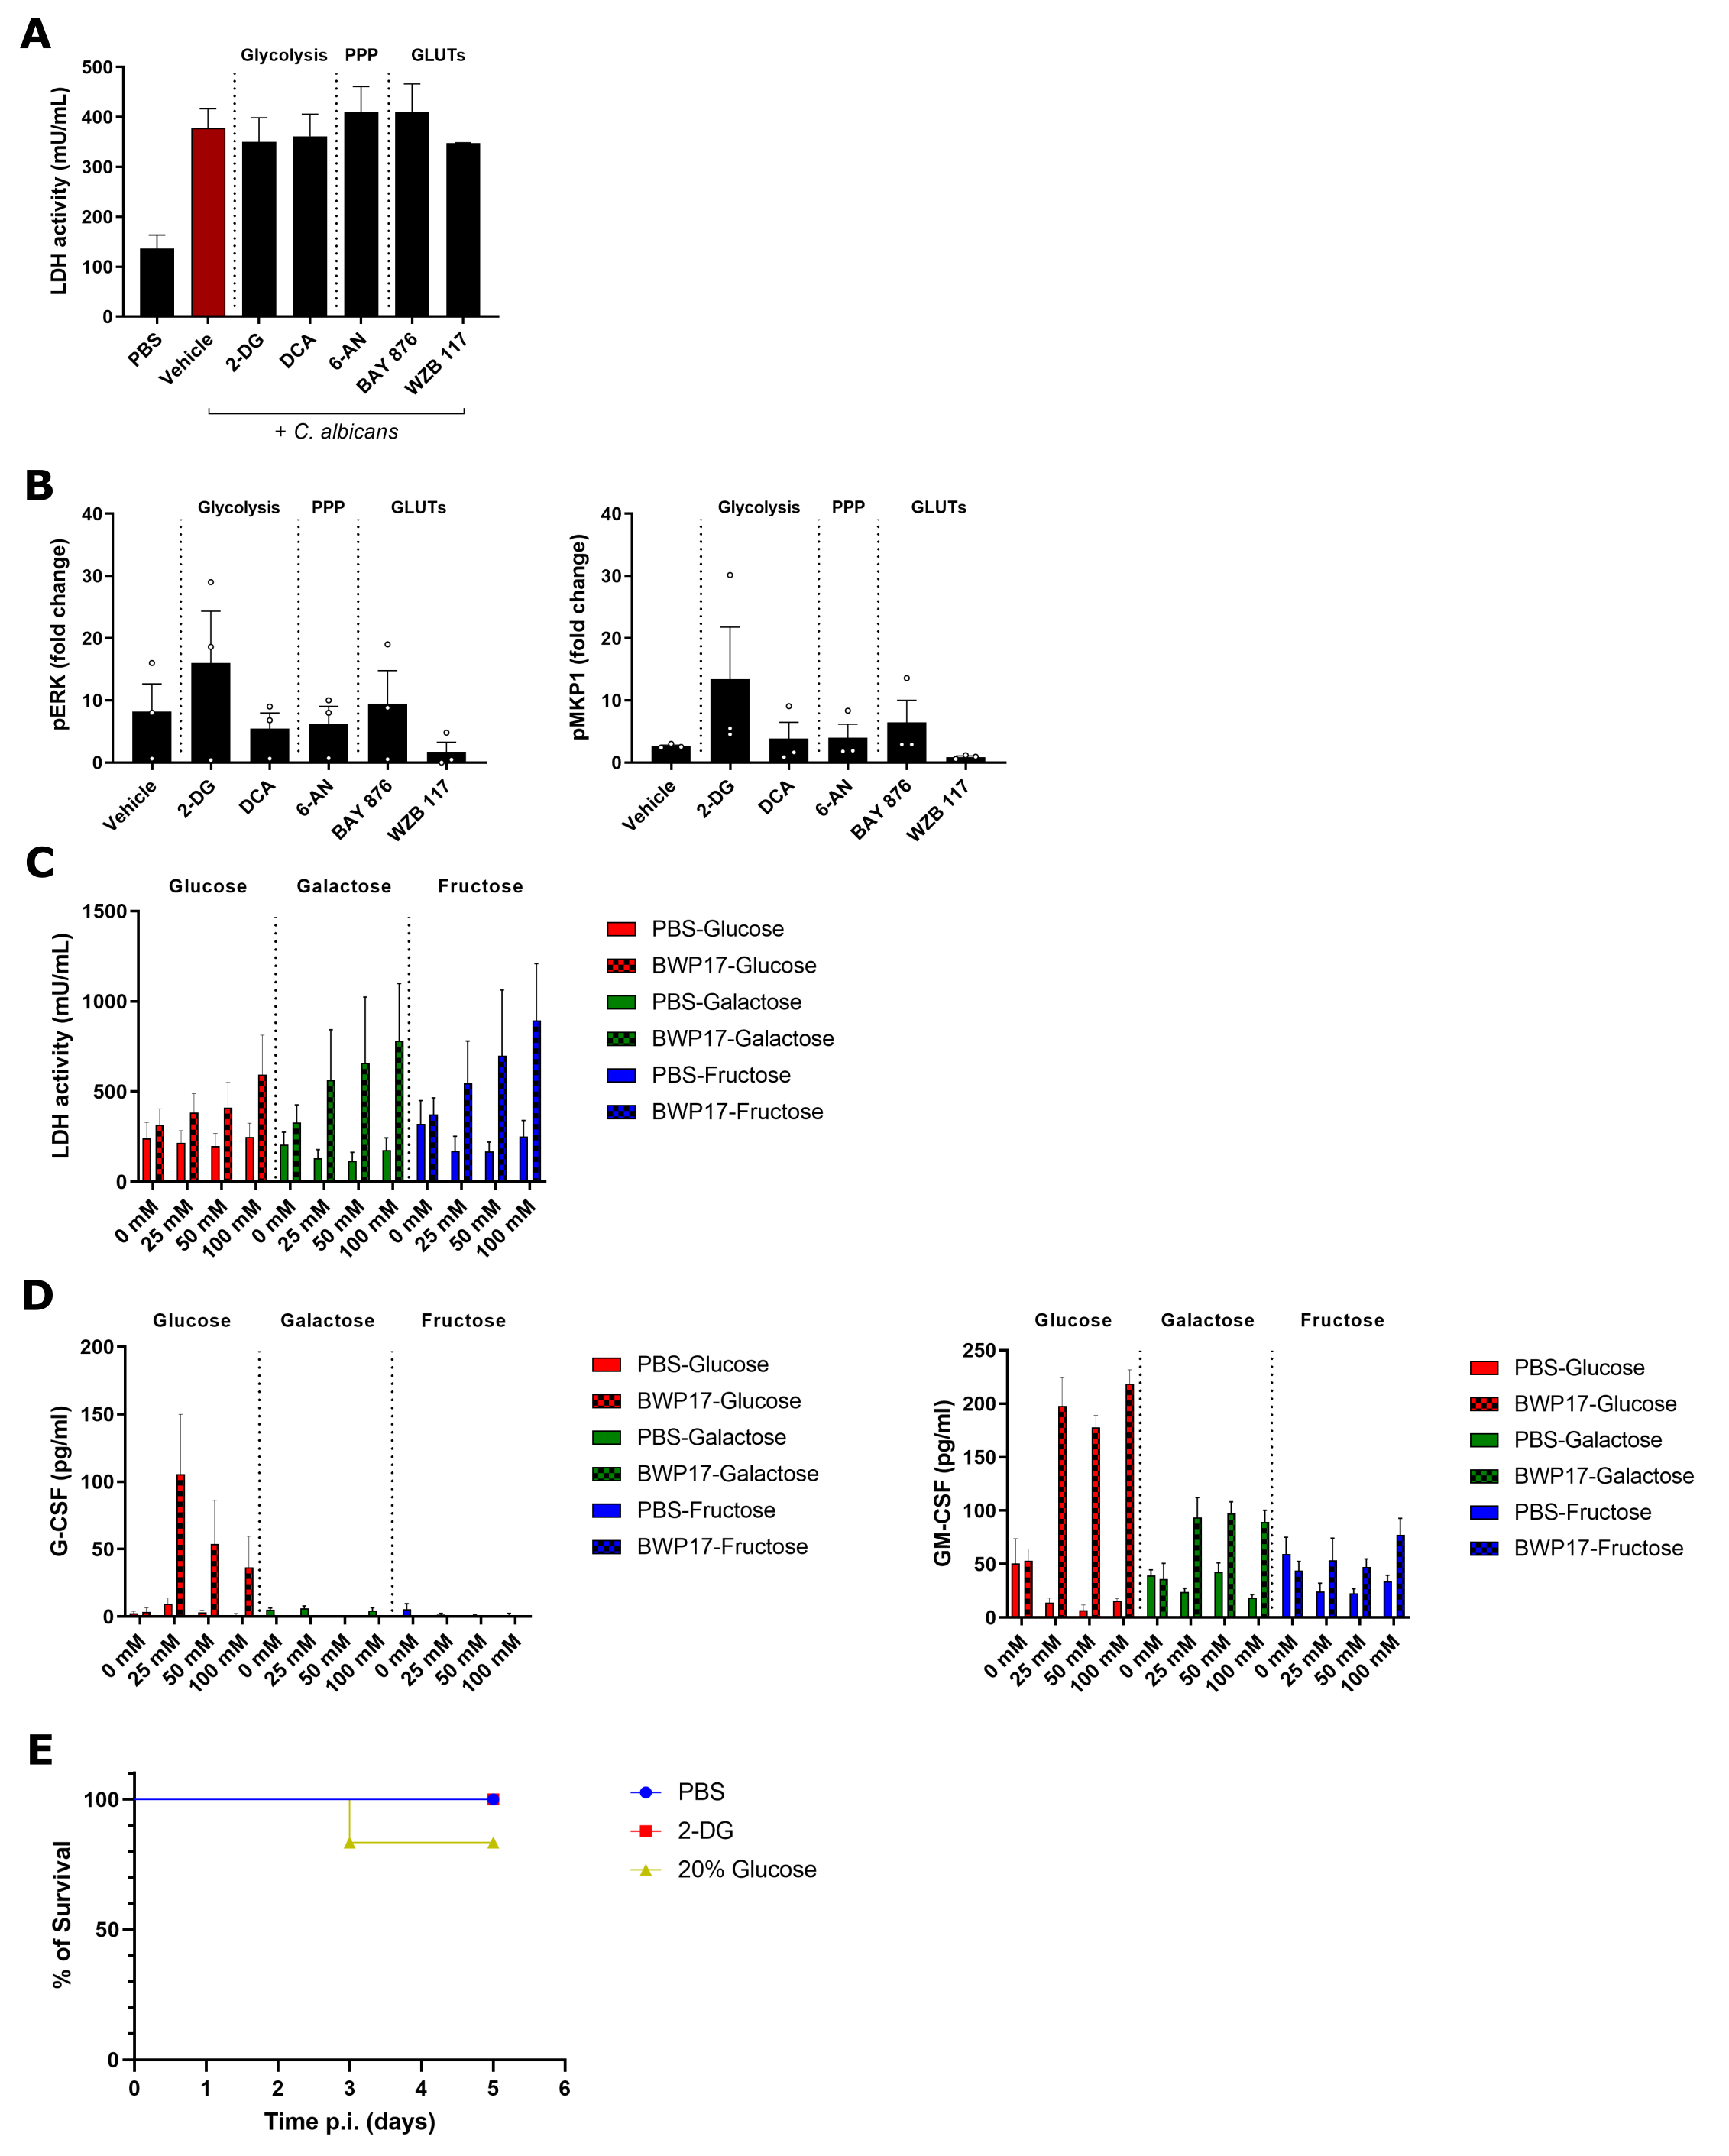
To determine the relevance of the C. albicans-induced metabolic reprogramming of OECs, we analysed the impact of pharmacological inhibition of glucose transport, glycolysis, and pentose phosphate pathways on OECs responses. The inhibition of any of these pathways had no significant impact on the C. albicans-induced damage (driven by candidalysin (Moyes et al., 2016)) in either the TR146 (Fig. 3A) or DOK (Figure S3A) cell lines. However, the inhibition of glycolysis using 2-deoxy-D-glucose (2-DG) or of both glucose transporters (GLUT1 and GLUT3/14) using WZB 117 led to a significant decrease in G-CSF secretion (33% and 43% reduction, respectively; p < 0.05), with a non-significant reduction in GM-CSF production when all GLUT proteins were inhibited (Fig. 3B). The upregulation of the AP-1 transcription factor component c-Fos (previously shown to be a key factor in the response to pathogenic C. albicans (Moyes et al., 2010)) upon infection was hampered when either glycolysis (using 2-DG, P = 0.1, or DCA, P = 0.008), GLUT1 (BAY 876, P = 0.006), or GLUT1/3/14 (WZB 117, P = 0.04) activity was inhibited. However, the inhibition of the pentose phosphate pathway did not appear to impact c-Fos production (P = 0.75) (Fig. 3C). In contrast, no significant changes were observed in the phosphorylation patterns of the upstream mitogen-activated protein kinase (MAPK) ERK1/2 or its regulatory phosphatase MKP-1 (Figure S3B), which are also primarily driven by candidalysin (Moyes et al., 2016). These results show that glucose transport and processing via glycolysis modulate the epithelial cell inflammatory output upon C. albicans infection via damage- and candidalysin-independent mechanisms.
The importance of glucose availability and homeostasis for innate immune cells during systemic candidiasis has been recently highlighted (Tucey et al., 2018). Glucose deprivation, driven by the increased glucose consumption of C. albicans, leads to macrophage cell death in vitro and more deleterious disease outcomes in a systemic murine model. This phenotype is rescued in the presence of continuous, maintained glucose levels. In sharp contrast, we observed that C. albicans infection of TR146 cells led to an increasing trend in cell damage with increasing glucose concentrations (Fig. 3D), which correlated with a higher fungal burden (Fig. 3E). Strikingly, when infections were performed with galactose or fructose as the sole hexose, even greater levels of epithelial damage were observed as compared to glucose (P = 0.006 and P < 0.001 for 25 mM galactose or fructose, respectively) (Fig. 3D). However, C. albicans growth in the presence of these hexoses was not as pronounced as in the presence of glucose. This an impaired damage protection response of OECs to C. albicans infection when galactose or fructose were the only hexoses available. Accordingly, we observed a significant decrease in G-CSF and GM-CSF release in cells growing with galactose or fructose, with the complete abolition of G-CSF production in the presence of these hexoses (Fig. 3F). Of note, an absence of these carbon sources led to very low cell damage and cytokine release, despite the presence of C. albicans (Fig. 3D-F). Furthermore, incubation of uninfected OECs in the presence of the different hexoses did not induce higher cell damage (Figure S3C) or cytokine release (Figure S3D). Overall, these data suggest that while glucose availability and utilisation are essential for generating immune responses to C. albicans, elevated concentrations of sugars in the environment might lead to more deleterious disease outcomes for superficial C. albicans infections.
To further study the impact of hexose metabolism and availability, we performed in vivo experiments using a murine model of oropharyngeal candidiasis (OPC). Mice were infected with C. albicans without any other treatment (“OPC” group), with intraperitoneal administration of 2-DG (“OPC + 2-DG” group), or with 20% glucose supplementation in the drinking water (“OPC + 20% glucose” group) (Fig. 3G). Notably, two days post 2-DG treatment we observed a significantly decreased tongue fungal burden (P = 0.01) and weight loss (P = 0.009) compared to controls (Fig. 3H-I). In contrast, mice supplemented with glucose showed a significant decrease in body weight (p < 0.001) despite no overall change in fungal burden (Fig. 3H-I), with some mice being culled two days post-infection after reaching the humane endpoints (Figure S3E).
C. albicans alters the epithelial metabolome
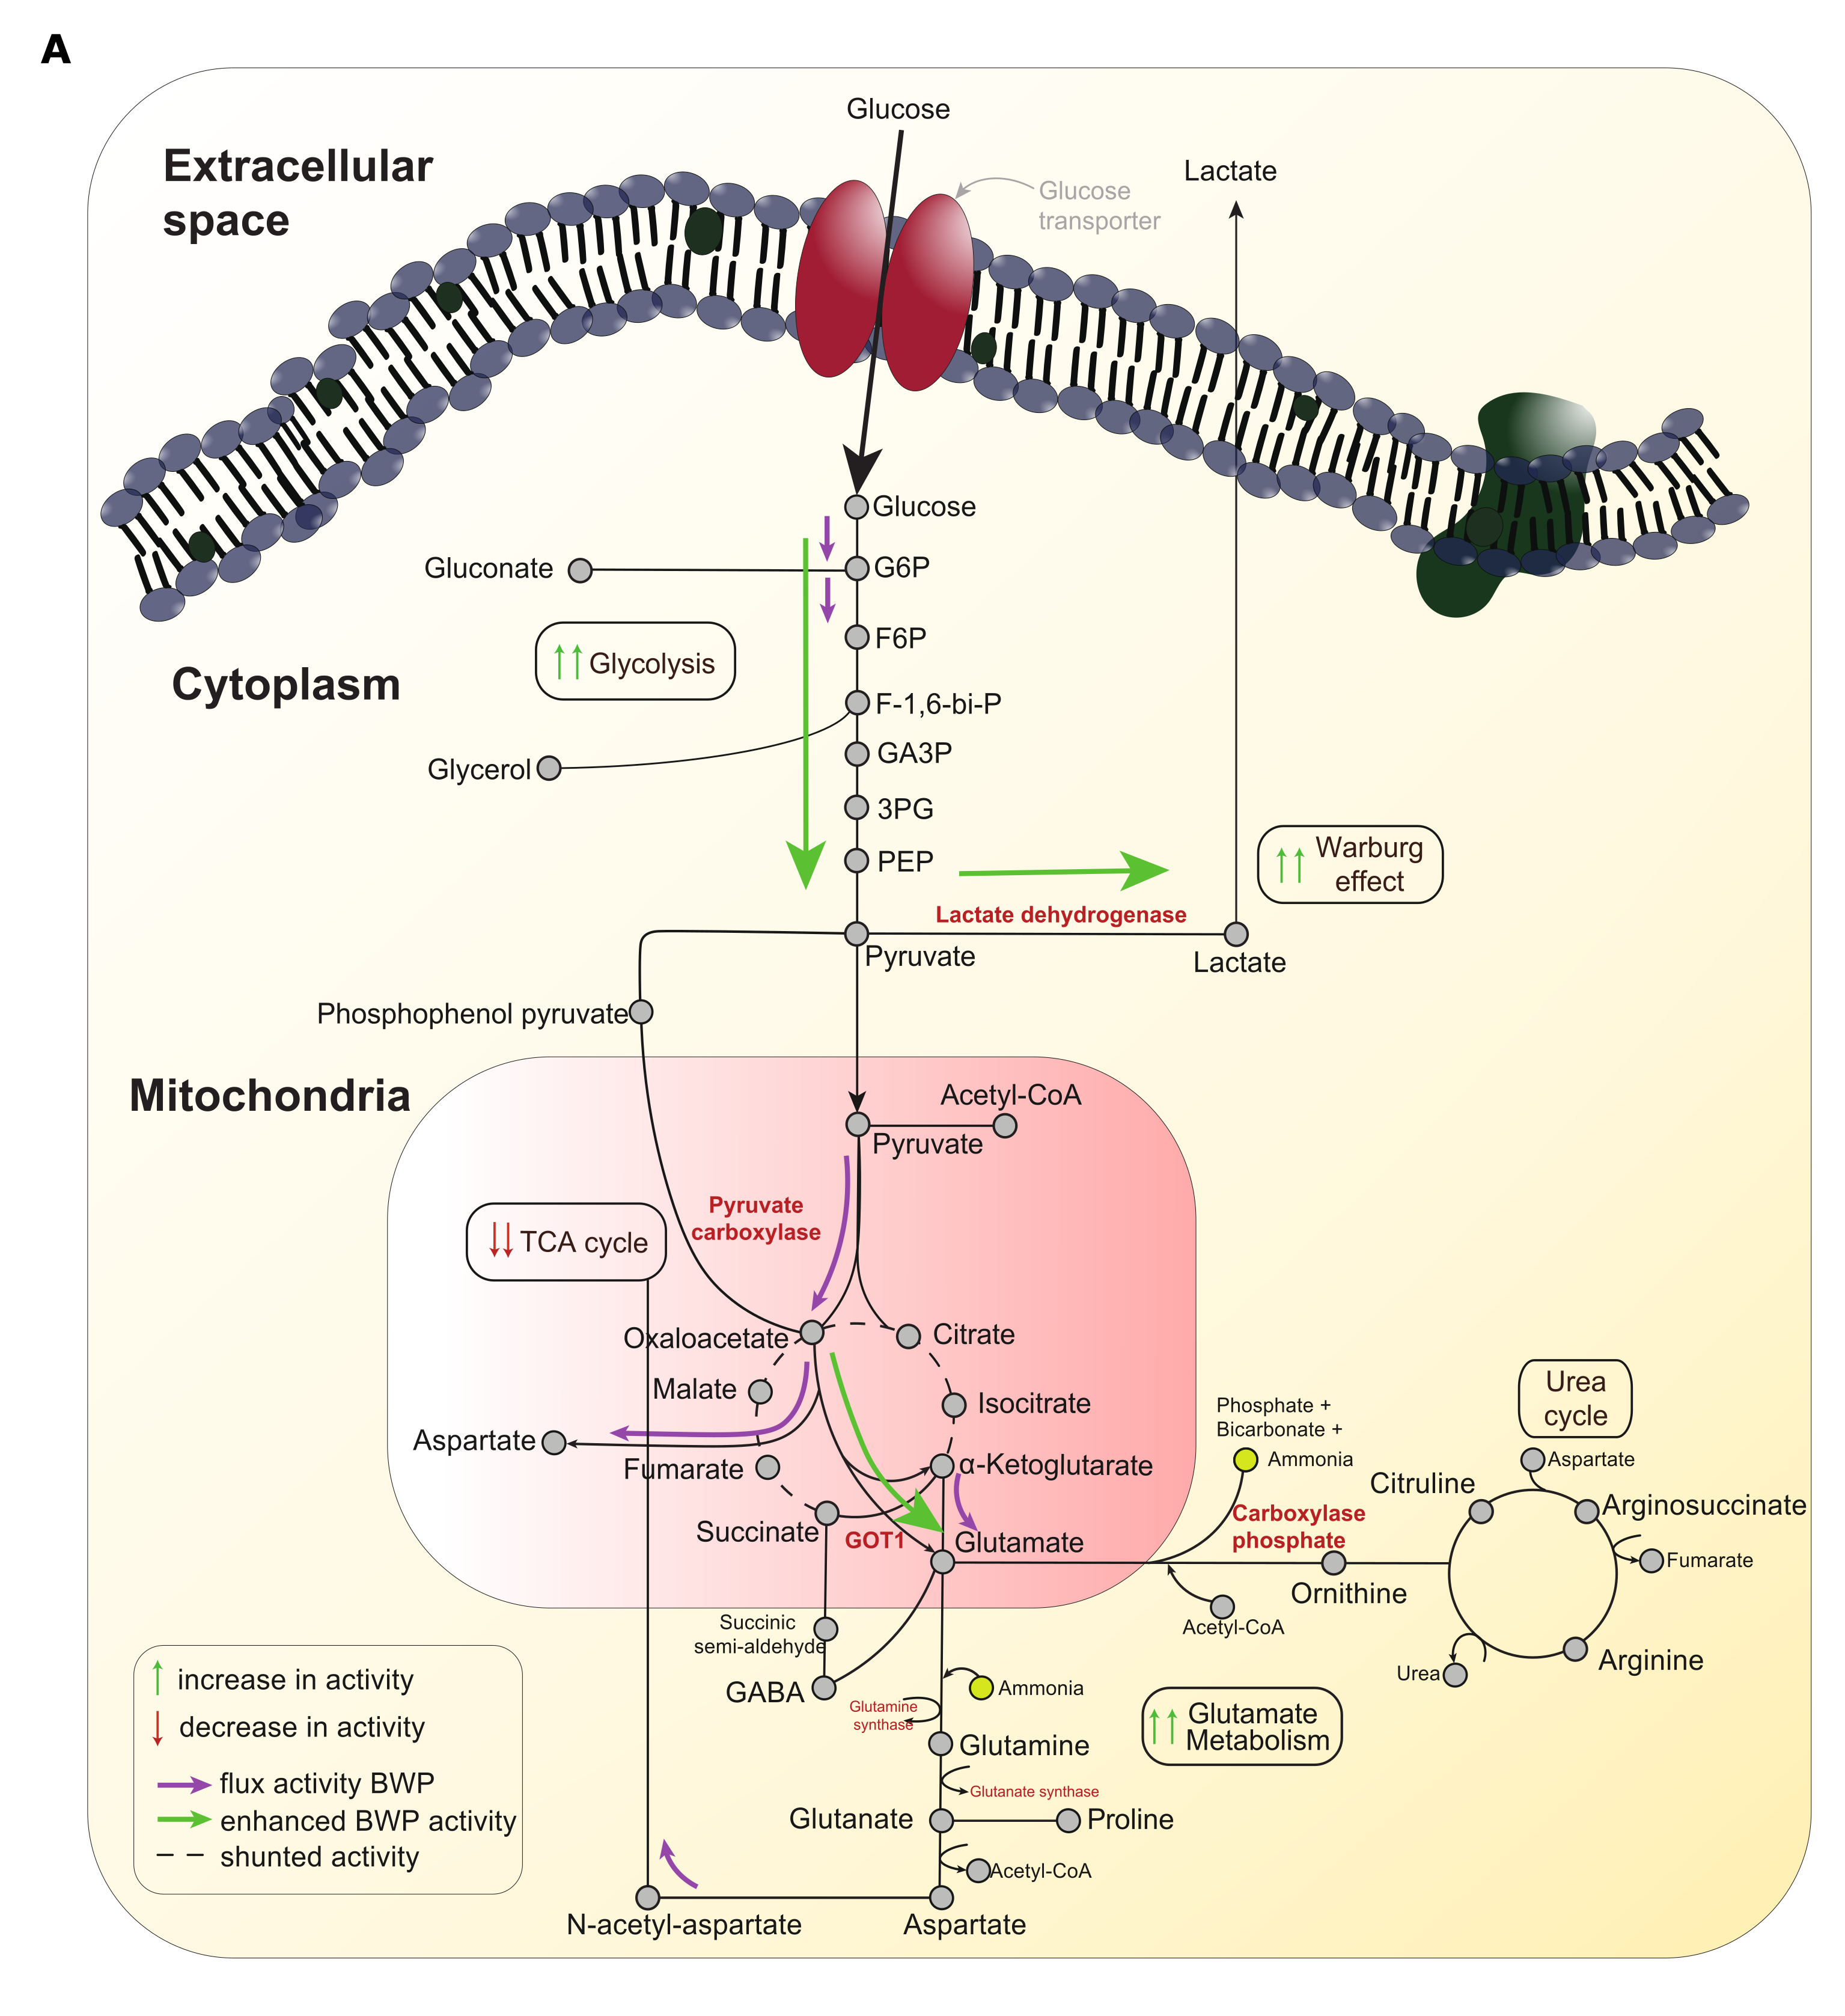
Given the observed alterations of the expression of glucose transporter and glycolytic enzyme genes in epithelial cells due to C. albicans infection, and the impact of metabolic pathway inhibition on the immune responses of epithelial cells, we next employed genome-scale metabolic modelling (GEM) in conjunction with our RNAseq data to explore the impact of C. albicans infection on the metabolic pathways (Figure S4). We generated two context-dependent GEMs for C. albicans infected and non-infected epithelial cells. The simulations identified key characteristics of the Warburg effect in infected OECs, with notable alterations in central carbon metabolism. The C. albicans infected epithelial GEM showed an increased flux of sugar consumption (i.e., glucose, galactose, fructose, among others), leading to increased pyruvate production. In contrast, the flux through the TCA cycle was substantially decreased. Our model also suggested a key event resulting from increased pyruvate production was the elevated production of oxaloacetate (OAA) caused by the actions of pyruvate carboxylase. Notably, downstream analyses indicated a higher level of GOT1/GOT2 transaminase activity, with knock-on effects on glutamate/aspartate accumulation and ammonia metabolism. Interestingly, amino acid metabolism was also predicted to change substantially, leading to higher glutamate synthesis in infected cells. These data suggest that the metabolic reprogramming of OECs induced by C. albicans infection involves not only increased aerobic glycolysis, as supported by our in vitro and in vivo experiments, but also decreased flux into the TCA cycle and alterations in glutamate metabolism.
To test these in silico predictions, we used untargeted NMR metabolomics to probe the epithelial metabolome during C. albicans infection. As predicted, we observed lower levels of glucose and higher levels of lactate in the intracellular compartment over time in C. albicans infected epithelial cells (Fig. 4A), as well as decreasing concentrations of glucose in the spent medium supernatant (Fig. 4B). In addition, NAD+ and NADP+ levels were increased and reduced, respectively (Fig. 4C), suggesting that the metabolic reprogramming induced by C. albicans also alters the energy balance in OECs. In keeping with this observation, the ADP/ATP ratio decreased in infected cells (P = 0.0219) (Fig. 4D), demonstrating higher energy production.
Next, we looked for alterations in the TCA cycle and glutamate metabolism, given that our predictions indicated that the influx towards this cycle was reduced, leading to glutamate accumulation. Interestingly, the abundance of the key metabolites involved in the TCA cycle was decreased in C. albicans infected cells, as shown by untargeted NMR for fumarate (Fig. 4E) and specific assays for citrate, α-ketoglutarate, oxaloacetate, and malate (Fig. 4F). Importantly, the decreased abundance of these metabolites was not uniform (e.g., citrate levels were substantially lower than oxaloacetate or α-ketoglutarate levels). Therefore, we hypothesised that this could be related to the increased flux through pyruvate carboxylase (PC) and glutamic-oxaloacetic transaminase1 (GOT1), involved in a pyruvate processing shunt that bypasses the TCA cycle by producing α-ketoglutarate and aspartate from oxaloacetate and glutamate, as predicted by the GEM simulations (Figure S4). Furthermore, RT-qPCR analyses showed significantly increased expression of both PC (2.2-fold increase, P = 0.03) in TR146 cells and GOT1 in TR146 (1.33-fold increase, P = 0.005) and DOK (1.25-fold increase, P = 0.04) cells when infected with C. albicans, while no significant changes were observed for the classical TCA enzymes PDHX and CS, or mitochondrial GOT2 in either cell type (Fig. 4G). These findings, coupled with a lower abundance of glutamate (Fig. 4I) and higher levels of aspartate (Fig. 4H) and ammonia (Fig. 4J), a by-product of GOT1 processing of oxaloacetate, supported our in silico predictions of a reduced TCA cycle activity and a shift in metabolic flux towards ammonia production. Finally, to assess the relevance of this shunt in pyruvate processing during the infection, we inhibited GOT1 activity using aspulvinone O. Notably, LDH activity decreased (Fig. 4K; 27.5% reduction, P = 0.02) upon infection in aspulvinone O-treated cells. Likewise, we observed a decreasing trend in both G-CSF (75.1% reduction, P = 0.06) and GM-CSF (51.1% reduction, P = 0.06) release (Fig. 4L). This data indicates that this pyruvate processing shunt is an important mechanism in driving cellular damage and immune evasion during C. albicans infection.
Collectively, the data presented here demonstrate the relevance of metabolic reprogramming in epithelial cell responses to C. albicans infection. Furthermore, we demonstrate an alternative ending for aerobic glycolysis via GOT1, as well as the critical role of this GOT1-mediated TCA cycle shunt for oral epithelial cell survival and anti-Candida immune responses.