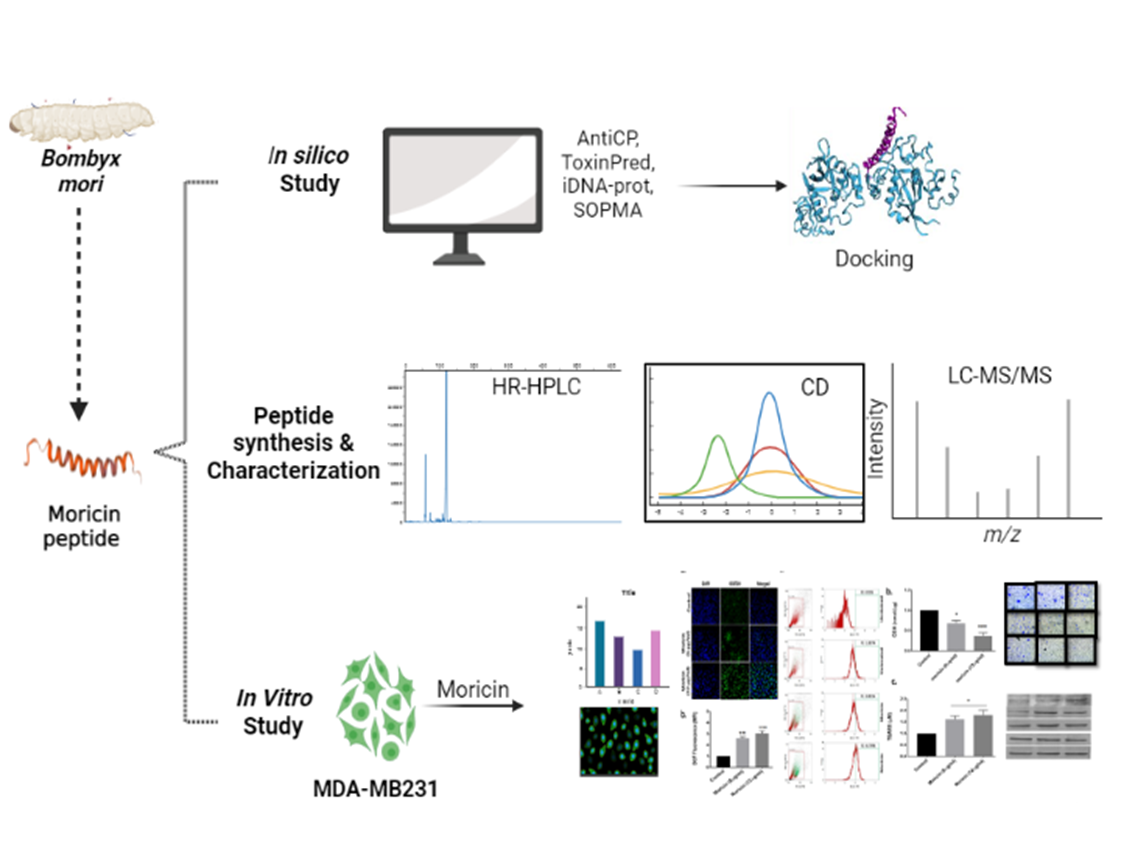
Several studies have identified the antibacterial properties of moricin peptides. However, the anticancer potential and, mechanistic insights into moricin peptide-induced cancer cell death have not yet been explored. Therefore, using in silico, analytical methods (Reverse Phase-high performance liquid chromatography (RP-HPLC), mass spectroscopy (MS), and circular dichroism (CD), and in vitro studies, an investigation has been carried out to delineate the mechanism(s) of moricin-induced cancer cell death. In-silico analysis was performed to predict the anticancer potential of moricin in cancer cells by using AntiCP and ACP servers based on a Support Vector Machine (SVM). Additionally, molecular docking was performed to predict the moricin peptide-related cancer signalling pathway(s). In vitro studies were performed using MDA-MB-231 cells. We observed that moricin exposure at relatively low concentrations (6.25 µg/ml or 1.37µM and 12.5 µg/ml or 2.75µM) to MDA-MB-231 cells caused a higher generation of reactive oxygen species (ROS) (notably superoxide radical (O2•–). Moricin exposure caused down regulation in the expression of Notch-1 and, NFƙB and Bcl2 proteins, while ROS-induced upregulation of P53 caused caspase-dependent cell death in MDA-MB-231 cells. In conclusion, this study reveals the anticancer potential and underlying mechanism of moricin peptide-induced cell death in cancer cells.
Research Article
Antimicrobial peptide moricin induces ROS mediated caspase-dependent apoptosis in human triple negative breast cancer via suppression of notch pathway
https://doi.org/10.21203/rs.3.rs-2194162/v1
This work is licensed under a CC BY 4.0 License
Journal Publication
published 20 Jun, 2023
Version 1
posted
You are reading this latest preprint version
Moricin
Anticancer peptide
Breast cancer
Notch1
Apoptosis
Breast cancer is a multifaceted and widespread disease that imposes a massive strain on the world population due to very high mortality rates 1. With an expected 2.3 million new cases discovered in 2020 and 6,85000 deaths worldwide, it is tragically one of the most common and the primary causes of cancer death in women 2,3. Both inherited and non-hereditary factors that influence the onset and course of breast cancer have been identified through epidemiologic investigations. A small percentage of 5 to 10% of breast cancers are hereditary while 90 to 95% of breast cancer are caused by environmental factors 4.Some of the crucial aspects are aging (at early puberty, menopausal as well as first pregnancy) 5, lifestyle, tobacco and alcohol consumption 6, laziness or lack of physical activities, and taking contraceptive pills 7. Triple-negative breast cancers are notable among breast cancer cases because they lack hormone receptors. These malignancies can be distinguished by their extreme aggressiveness 8. Like other malignancies, it also has the distinctive ability to avoid apoptosis while progressing toward immortality, which contributes to drug responsiveness 9. There are two principal apoptosis pathways: extrinsic and mitochondrial (intrinsic). Numerous gene families control these pathways, which ultimately results in cell phagocytosis by neighbouring cells 10. Although conventional chemotherapies are concerned with the ability to induce apoptosis, many of them are continuously confronted with resistance as well as worrisome adverse effects 11,12. Despite improvements in lowering the risk of developing breast cancer, triple breast cancer still has a dismal prognosis 13. This frenzy fuelled the hunt for reasonably safe natural options to alleviate the clinical implications of hormone-negative breast cancer.
Anticancer Peptides (ACPs) are potent, minute substances that can kill cancer cells by disrupting the mitochondria or by using a membranolytic mechanism 14. The net negative charge of the cancer membrane is a key factor in peptide selectivity and toxicity when compared to non-cancerous eukaryotic membranes 15. These peptides can enter malignant cell membranes, compromising membrane integrity, due to their amphiphilicity levels and hydrophobic arc size. For instance, it has been shown that fish-derived Pleurocidin-like Peptides (NRCs) destroy breast cancer cells by disrupting membranes, but only slightly affecting human fibroblasts and human mammary epithelial cells 16. The delivery of cancer-specific medications may be made possible by these cell-penetrating peptides. Buforin IIb, a non-specific anticancer peptide that penetrates cells, was modified to become more cancer-specific while having little effect on healthy cells17. It was discovered that this cancer-specific peptide derivative functioned well in introducing apoptosis-induced antibodies into cancer cells. Notably, the SA12 peptide triggered the apoptosis in breast cancer cells by mitochondrial signalling 18. Bioinformatics tools for the prediction and design of anticancer peptides (ACPs) were created using the experimentally validated data of physicochemical parameters of peptides. Anticancer peptides predictions servers, AntiCP, and ACP develop support vector machine models (SVM) based prediction from amino acid composition and the presence of an apoptotic domain 19. In this regard, these prediction tools will aid high-throughput screening for anticancer peptides from complex peptidomes of a variety of natural products.
In recent times, insect-derived antimicrobial peptides (AMPs) have been shown to have a very wide range of activity, such as antibacterial, antifungal, antiviral, as well as anticancerous 20–23. Silkworms (Bombyx mori) are the most valuable assets for sericulture. Interestingly, to protect themselves from pathogenic diseases, silkworms have AMPs as the main component of the immune system 24. Upon infection, AMPs are quickly released into the hemolymph system to eliminate the pathogenic organism, via disturbing the cell membrane of invading pathogen. Among AMPs, an antimicrobial peptide, named moricin has been reported to show significant antibacterial activity 25,26. Moricin, 42 amino acid long, cationic peptide, an α-helix with charged amino acids in the N-terminal half at three to four amino acid residues intervals 24. Moricin is encoded by various gene families and there are 12 moricin-coding genes are found in the Bombyx Mori genome, which divided into three subtypes: Bmmor (1 gene), moricin-like A (3 genes), and moricin-like B (8 genes). All these genes produces the mature form of moricin, which has an unaltered amphipathic α--helical N-terminus and a positively charged C-terminus.The absence of this post-translational modification allowed this moricin to be chemically produced 27. In addition to antimicrobial nature of AMPs, studies have also reported anticancerous activities of some natural AMPs 28,29. Recently, Fort et al. have reported the dual role of defensin peptide (TcPaSK) as an antimicrobial and anti-proliferative agent 30. In the light of earlier studies, we were also interested to assess the anticancerous activity of moricin peptide. Therefore we hypothesized that the anticancerous activity of B. mori-derived moricin peptide is yet to be explored. Thus, the present study aimed to predict the putative anti-cancerous properties of moricin peptide by using in silico study and their validation through in vitro model system using MDA-MB23321 cells.
2.1 Materials
The supplier of moricin was GL Biochem (Shanghai) Ltd. (Peptide no.147954). The following chemicals were bought from Sigma Aldrich: dimethyl sulfoxide (DMSO), 3-(4, 5-dimethylthiazol-2-yl)- 2,5-diphenyltetrazolium bromide (MTT), lactate dehydrogenase (LDH) (St. Louis, MO, USA). Trypsin 0.25% EDTA, Lysotacker red, Mitotracker green, foetal bovine serum (FBS), antibiotic-antimycotic solution, and trypsin were acquired from Invitrogen (Waltham, MA, USA). 2,7-dichlorodihydrofuorescein diacetate (DCFH-DA), Hoechst 33342, was bought from Sigma Aldrich. Antibodies against Notch1, NfKB, Bcl-2, Bax, β-actin, Caspase 9, and Caspase 3 are purchased from Abcam. All other substances and reagents were of analytical grade.
2.2 Cell line and culture conditions
The MDA-MB-231 human triple negative breast cancer cell line was procured from the cell repository canter of the National Centre for Cell Sciences, Pune, India. MDA-MB-231 cells were maintained in DMEM media supplemented with 10% heat-inactivated FBS, 1% penicillin and streptomycin solution and maintained at 37°C with 5% CO2 in an incubator (Thermo Scientific, USA).
2.3 In-silico predictions of moricin as anticancer peptide
2.3.1 Peptide Acquisition
The structures of target peptide moricin was acquired from protein data bank (www.rcsb.org/pdb). Further, cleaning of peptides was performed involving the insertion of missing residues, eliminating water molecules, bound unwanted ligands, and atom uniformity in Accelrys Discovery studio 2017 R2 software.
2.3.2 Virtual screening and anticancer prediction of moricin peptide
Virtual screening of the prospective candidate peptide was predicted using the AntiCP server (http://crdd.osdd.net/raghava/anticp/). The anticancer peptide (AntiCP) server is an open web-based platform to predict the anticancer properties of prospective peptides. A supervised machine learning algorithm ‘Support Vector Machine (SVM)’ aids in the development of models based on the composition of amino acids and binary profile features. iACP (http://lin-group.cn/server/iACP) was used for the validation of SVM scores. Additionally, I-TASSER server (https://zhanggroup.org//I-TASSER/) was utilized to commute secondary structure coordinates of the selected peptides. However, AllerTOP v. 2.0.(https://www.ddg-pharmfac.net/AllerTOP/index.html) and PeptideCutter–Expasy (https://web.expasy.org/peptide_cutter/) bioinformatics tools were implemented to predict the allergenicity and gastrointestinal (GI) digestion resistance of the peptide.
2.3.3 Molecular docking
Molecular docking analysis of binding of the peptide with selected notch signaling pathway targets including Human DLL4 C2-EGF3 (PDB ID: 5MVX), Human Notch 1 EGF 4–7 (PBD ID: 5FM9), Crystal Structure of Notch 3 Negative Regulatory Region (NRR) (PBD ID: 4ZLP) and Human Jagged-1, domains DSL and EGFs1-3 (PBD ID: 2VJ2) was performed using HawkDOCK web server (http://cadd.zju.edu.cn/hawkdock/). Further the results were validated using another free online platform ‘pyDockWEB’ (https://life.bsc.es/pid/pydockweb).
2.4 Synthesis and characterization of moricin peptide
2.4.1 Reverse Phase-high performance liquid chromatography (RP-HPLC)
The purification of peptide was performed in RP-HPLC (Instrument No: 0200194, Lot No: P210205-CL147954) using 4.6*250mm C18 column. Acetonitrile (with 0.1%Trifluoroacetic acid) was used as solvent A, whereas water is used as solvent B (with 0.1%Trifluoroacetic acid). The flow rate was fixed as 1.0ml/min, while the change in absorbance was monitored at 220 nm.The volume of sample was injected as 10 µL.
2.4.2 Mass spectroscopy (MS)
The mass spectra was recorded Agilent-6125B instrument. During analysis, the probe bias was fixed at + 4.5 kv, while nebulizer gas flow was kept 1.5L/min. The H2O-acetonitrile (1:1, v/v) was used as solvent with flow rate 0.2ml/min (detector: 1.5 kv).
2.4.3 Circular dichroism (CD)
The CD spectra were recorded on a JASCO instrument, Model J-815-150S. Experiments were performed by purging dry N2 gas continuously. Data were collected in a quartz cuvette of 1 mm path length. The spectra were recorded both in water and 30% (v/v) trifluoroethanol-water mixture medium.
2.5 Cell viability assay
MTT, LDH release, and trypan blue tests were used to evaluate the viability of MDA-MB-231 cells that had been treated with the moricin peptide. Briefly, MDA-MB-321 cells (5×10³ cells/well) were seeded in 96-well cell culture plates and treated with moricin peptide (0, 0.78, 1.5, 3.1, 6.2, 12.5, 25, 50, 100 µg/ml) and placed the plate in a humified 5% CO2 incubator at 37 ◦C.
2.5.1 MTT assay
The MTT solution (10.4 mg/ml in PBS) was added to each well after the completion of the treatment time, and the plate was once more incubated in the incubator for the next 4 hours at 37°C. The formazan crystals were then dissolved in 200 µl of DMSO for 30 min, and absorbance was measured between 595 and 555 nm (BIORAD-PW41, USA).
2.5.2 LHD release assay
The LDH assay kit's instructions (Sigma Aldrich, Co. St Louis, MO, USA) were followed to complete the LDH release assay. Briefly, in 96 well plates, 5×10³ cells/well were plated, and at 70–75% confluence, the cells were treated to various doses of the moricin peptide(0, 0.78, 1.5, 3.1, 6.2, 12.5, 25, 50, 100 µg/ml). After 24 hours, 25 µl media was transferred to a new 96- well plate and 50µl LDH mixture solution added and plate was kept at R.T. in the dark for 30 minutes. After dark incubation of 30 min, 7.5 l of 1 N HCl were added to the mixed solution and absorbance was measured at 490–690 nm (BIORAD-PW41, USA).
2.5.3 Trypan blue assay
5×10³cells were seeded onto 6- well plates and when the cells had reached 70–75% confluence, cells were treated with various doses of the moricin peptide (0, 0.78, 1.5, 3.1, 6.2, 12.5, 25, 50, 100 µg/ml). After 24 hour, cells were removed using trypsinization. Cells were then centrifuged at 1000 rpm for 5 min, supernatant was discarded carefully and the cell pellet was combined with an equivalent volume of trypan blue (0.4%). Hemocytometer was used for cell counting.
2.6 Intracellular reactive oxygen species (ROS) measurement
Fluorescence microscopy imaging and flow cytometry techniques were used to assess intracellular ROS levels using DCFH-DA dye, as reported previously 31. Briefly, afater 24 hour, moricin treated and untreated MDA-MB-321 cells was washed with PBS, and then incubated in PBS with 10 M DCFH-DA dye at 37°C for 20 minutes to measure the level of ROS with fluorescent microscope (Zeiss Microsystems, GmBH, Germany) and flow cytometry.
2.7 Mitochondrial oxygen species (ROS) measurement
Cells (treated or untreated) were incubated with MitoSOX dye (5 µM, Invitrogen) and Hoechst (10µg/ml) in complete medium and incubated for 30 mins at 37° centigrade. The cells were then washed with 1X PBS for three times and phenol red free complete media was added for imaging under live cell condition.. Imaging was done using florescent microscopy (Zeiss Microsystems, GmBH, Germany).
2.8 Immunofluorescence staining of cells with Mitotracker and Lysotrackerdyes
Cells (treated or untreated) were incubated with Mitotracker dye (75 nM, Invitrogen), Lysotracker dye (100 nM, Invitrogen) and Hoechst (10µg/ml) in complete medium and incubated for 30 mins at 37° centigrade in 6 well plate. The cells were then washed with 1X PBS for three times and phenol red free complete media was added for imaging under live cell condition. Imaging was done using florescent microscopy (Zeiss Microsystems, GmBH, Germany).
2.9 Reduced glutathione (GSH) detection
Intracellular GSH levels were estimated using monochlorobimane (100µM) dye by fluorescence microscopy (Zeiss Microsystems, GmBH, Germany) imaging as reported previously 32. Additionally, 10% trichloroacetic acid (TCA) was used to examine the glutathione levels within cells. Protein were isolated from moricin treated and untreated MDA-MB-231 cells and precipitated with TCA. TCA-precipitated proteins were briefly vortexed, incubated for 10 minutes on ice, and then centrifuged at 10,000 rpm for 10 minutes at 4°C. Supernatant was taken and mixed with KPE buffer at a 1:1 ratio. O-phthalaldehyde (1 mg/ml) was then taken in equal amount to the diluted samples to prepared reaction mixture and incubated it at RT in dark for 10 min. After incubation, the reaction mixture was transported to a microplate reader (BIORAD-PW41, USA) for fluorescence measurement at 355 nm (excitation) and 420 nm (emission). The GSH standard curve was used to determine the GSH level. GSH concentrations are displayed as nmol/g protein 33.
2.10 Thiobarbituric Acid Reactive Substances (TBARS) Assay
Moricin-treated and untreated MDA-MB-231 cells were assessed by the TBARS assay described previously 34. After 24 hours of moricin exposure, the MDA-MB-321cells were homogenized in ice-cold PBS, and cells were lysed through freezing and thawing thrice. TCA (28% w/v in HCl 0.25 M), thiobarbituric acid (1% in acetic acid 0.25 N), and butylhydroxytoluene (125 mM in ethanol) were then taken to mix the homogenate and then the mixture was heated at 95°C for 15 min and after that placed in an ice bath. Subsequently, the precipitate was removed by centrifugation at 10,000g for 15 min at 4°C, and the absorbance of the supernatant was determined at 535 nm (BIORAD-PW41, USA). TBARS levels were calculated using 1,1,3,3-tetramethoxypropane as the standard.
2.11 Cell migration assay
Migration assays were performed in 24-well plates with 8-µm pore-sized chamber inserts (Corning Inc., Acton, MA, USA). Approximately 4× 10⁴ cells/well were resuspended in 200 µl of serum-free medium with or without moricin and were then seeded in the upper chambers. In addition, 700 µl of medium supplemented with 10% FBS was added to the lower chambers. The cells were incubated at 37°C and 5% CO2 for 24 and 48 hours, after that cells were fixed with 100% methanol for 20 min and stained with Trypan blue for 30 min. Non-migrating cells on the upper side of the filter were removed with cotton swabs. Migration was quantified by counting the number of cells under an inverted phase contrast microscope.
2.12 Bromodeoxyuridine (BrdU) Assay
The BrdU assay was done with the BrdUkit (Thermo Scientific, USA) as per the manufacturer’s protocol. Imaging was done using fluorescence microscopy (Zeiss Microsystems, GmBH, Germany) imaging as reported previously 35.
2.13 Western blot analysis
Western blotting was performed per a previously established standard procedure 36. Briefly, MDA-MB-231 cells at a density of 1 × 10⁶ in a T-25 cm2 flask were treated with moricin peptide (6.25 and 12.5 µg/mL). Using ice-cold RIPA lysis solution with protease inhibitor cocktail (Thermo Fisher Scientific, USA) the cells were scraped to create the total cell lysates. The total cell lysate was then centrifuged at 13,000×g for 20 min and the protein concentration in the supernatant was determined with a BCA protein assay kit (Thermo Fisher Scientific, USA) as per manual instruction. An equal quantity of protein samples (30 µg each) were used in SDS-PAGE. Resolved proteins in SDS-PAGE were then transferred onto a PVDF membrane. Filters were then blocked with blocking buffer containing 5% BSA in Tris Buffer Saline Tween 20 (TBST) solution, pH 7.4 under constant agitation for 1 hour at 4°C. Membranes were then incubated overnight at 4 ◦C with primary antibodies of Nocth1 (1:1000), NFkB (1:1000), P53 (1:1000), Bcl-2 (1:1000), Bax (1:1000), Caspase 3 (1;1000), Caspase 9 (1:1000) and β-actin (1:1000) as per the dilutions suggested by the manufacturer. The membrane was then washed thrice with TBST and incubated with horseradish peroxidase (HRP)-conjugated secondary antibodies (1:5000) for 1 hour at RT with gentle shaking. After washing, bands were visualized by ECL Western Blotting Substrate Kit (Thermo Fischer Scientific, USA) according to the manufacturer’s instructions. The relative abundance of each band was quantified using Image Studio, lite version 5.2 software (LI-COR), and normalized to β-actin as a loading control.
2.14 Statistical analysis
Three biological replicates (nine technical replicates) were performed for all experiments. Data were analysed using Graph-Pad Prism 7.05 Software (GraphPad Software, Inc., La Jolla, CA, USA). The results are presented as the mean ± SEM, and statistical significance was determined using one-way ANOVA, and two way ANOVA followed by Dunnett’s multiple comparisons test. A statistically significant value was considered at p < 0.05.
3.1 Physicochemical, Allergenicity, Digestion Resistance and Anticancer Assessment of moricin peptide
The antibacterial peptide ‘moricin’ consists of 42 amino acid sequences. The physicochemical properties reveal that moricin is a highly basic entity, and greater the basicity, the more anti-microbial effects it possesses (Table 1). The electrostatic association(s) between positively charged moricin peptide and negatively charged bacterial membrane is mediated with an isoelectric point (pI) calculated to be at 11.3. The instability index value is 8.32. Furthermore, the peptide did not possess any toxic, allergenic and digestion resistance responses as predicted by the in silico study. Anticancer prediction servers AntiCP and iACP server with SVM scores 0.75 and 0.99 reveal their potent anticancer property prediction (Table 2). Additionally, the SVM score of 0.16 has been over served for the cell-penetrating property of the peptide (Table 2). The iDNA-Prot server reveals that the peptide interacts with the nucleic acids and the interacting amino acids predicted were Tyr27, Glu30, Val31, Asp33, Phe34 (Table 3). The C-score value ranges from 0-1 predicting for ligand binding where, a higher score indicates a more reliable prediction. The secondary structures of the peptide were predicted using NPS@: SOPMA secondary structure prediction tool (https://npsa-prabi.ibcp.fr/NPSA/npsa_sopma.html) were the percentage of α-helices, coil and strand were determined (Table 2).
3.2 Docking Analysis
Protein-peptide interactions where moricin was docked with selected target proteins in the notch signaling pathway namely human DLL4, crystal structure notch 1, notch 3, and jagged-1 proteins. By analyzing the individual docked models generated shows that maximum binding of moricin peptide was observed with notch 3 NRR with a BFE of -72.13 kcal/mol and the interacting amino acids are depicted in table (Table 4). As evident from results, the binding affinity of moricin with the target proteins decreased in the order notch 3 (BFE: -72.13 kcal/mol)>DLL4 (BFE: -59.79 kcal/mol)>TACE (BFE: -51.14 kcal/mol)>notch 1 (BFE: -48.92 kcal/mol)>jagged-1 (BFE: -41.49kcal/mol). The DNA binding amino acids of the peptide have been writtenin italicized form in Table 5predicted by iDNA-Prot server, suggesting that Tyr27, Glu30, Val31, Asp33 and Phe34 are the active site residues of the peptide.
3.3 Moricin is a-helix predominant structure with a MW of 4543.5 Da revealed by CD and LC/MS
Peptides were analyzed and purified by reversed-phase high-performance liquid chromatography (RP-HPLC) with a linear gradient of water (0.1% TFA). The RP-HPLC chromatogram of purified peptide showed one major peak at approximate retention time 8.1 min (Fig. 1A). Most of the contaminants and unwanted side products eluted before 4 min. when the amount of organic solvent was very less (< 10%). The specific fraction was collected (peak of interest) and then freeze-dried before used for other applications. The purified peptide was further characterized by mass spectrometry and circular dichroism. The CD spectrum of synthesized moricin peptide showed negative band ~190 nm in water, indicating random coil conformation. However, when analysed in presence of 30% (v/v) trifluoroethanol-water mixture, two distinct minima were observed at 197 and 208 nm region. In addition, a positive band was observed at ~182 nm. This indicates a-helix as the predominant secondary structure. A closer look into the position and relative intensity of the bands indicate presence of 44.4 % a-helix and 13.5 % b-strand structure (Fig. 1B). For further confirmation, the molecular mass of the peptide was measured by ion spray mass spectrometry on a single quadrupole LC/MS spectrometer. The obtained value, 4544.0 ± 0.4 Da, was coincident with the literature-reported value, 4543.5 Da (Fig. 1C) considering that the C terminus of the peptide is unmodified.
3.4 Moricin induced growth inhibition of MDA-MB-231 cells at 6.25µg/ml concentration
To determine the effective dose of moricin peptide on MDA-MB-231 cells, we assessed the moricin peptide-induced cytotoxicity in MDA-MB-231cells by measuring cell viabilities. As shown (Fig. 2), cells were treated with various concentrations of moricin peptide (0-100μg/mlor0-22 μM) for 24 h. Moricin peptide exposure up to 3.125 μg/ml (0.688 μM) of did not cause any significant loss in cell viability. However, the cell viabilities were found to be decreased significantly at 6.25 (1.37μM) and 12.5 μg/ml (2.75μM) concentrations of peptide by24% and 50% respectively, while at above concentrations more that 75% of decrease in cell viabilities were observed compared to untreated cells. Additionally, the cytotoxic effects of moricin peptide were also confirmed by assessing LDH release (Fig. 2C) and by the trypan blue assay (Fig. 2D) Similar to the MTT assay, results of LDH release and trypan blue assays also showed significant decrease in cell viability at 6.25μg/ml and above concentrations of moricin peptide. Hence, based on these results, we selected 6.25(1.37μM) and 12μg/ml (2.75μM) concentrations of moricin peptide for our subsequent studies.
3.5 Moricin induces intracellular Reactive Oxygen Species (ROS) generations in MDA-MB-231 cells
There are several growing evidences that anticancer drugs exposure causes significant alteration in the cellular redox status of cancer cells. Therefore, we were also interested to know the effects of moricin peptide on cellular redox in MDA-MB-231 cells. As shown (Fig. 3A & 3B), moricin exposure causes significant rise of 1.5 and 2 fold in the levels of intracellular ROS levelsin dose 6.25and 12μg/ml respectively after 24 hour. Flow cytometry results revealed the intracellular ROS were 11.85 %, 26.85% and 46.80% in untreated and 6.25 and 12μg/ml moricin treated cells respectively.
3.6 Moricin induces Mitochondrial ROS mediated structural damage to mitochondria and lysosome
Several studies have reported that more than 90 percent of cellular ROS is generated through mitochondria, therefore we were also interested to know the effects of moricin exposure on mitochondrial ROS. It was observed that moricin exposure causes significant increase of mitochondrial superoxide anion by1 and 1.4 fold in 6.25 and 12μg/ml moricin treated cells respectively as compared to control (Fig. 4A & 4B). In this connection, we further checked the effects of superoxide anion at lysosome and mitochondrial morphology by utilizing fluorescence microscopy. There were significant morphological alteration were observed in the mitochondria and lysosomal structure at 12.5 µg/ml of moricin concentration. However at low doses (6.25µg/ml) no significant morphological alterations were observed in the mitochondria and lysosome (Fig. 4C).
3.7 Moricin reduces intracellular GSH level and enhances TBARS in MDA-MB-231 cells
In the previous result, we have shown that cytotoxic concentrations of moricin (6.25 and 12.5 μg/ml) cause a significant rise in the total intracellular and mitochondrial ROS, therefore we were further interested to know the effects of moricin induced oxidative stress on cellular glutathione and lipid peroxidation. Results shown that moricin exposure leads to the significant decrease in the total intracellular glutathione levels (Fig. 5A &5B) whereas, the TBARS assay results shows the significant rise in the level of lipid peroxidation in dose dependant manner. (Fig. 5C).
3.8 Moricin retards proliferation, migration and colony formation rate in MDA-MB-231 cells
As shown in previous results, moricin induces ROS mediated morphological alterations in the mitochondria, therefore, we were keen to investigate the effects of moricin exposure onMDA-MB-231 cells migration and proliferation activity. We observed, moricin causes a significant decline in the rate of migration after 12 and 24 hrs of exposure. However 12.5 μg/ml concentration of morcin shows relatively higher anti-migration effects after 24 hrs (Fig. 6A & 6B). Similarly, BrdU incorporation also shows the significantly decrease in the rate of cell proliferation after moricin exposure and causes 60 and 70% lower cell proliferation at 6.25 and 12.5 μg/ml respectively. (Fig. 6C &D). Soft agar assay (Fig. S1) also shows the significantly decrease in colony formation under moricin exposure.
3.9 Moricin induces caspase dependent cell death via down regulating the Notch-1/NFKB in MDA-MB-231 cells
As in our in silico study the protein peptide docking analysis indicates that moricin have relatively higher binding affinity with Notch-1 receptor, therefore to validate our in silico finding along with our in vitro study we performed immunoblotting in moricin exposed MDA-MB-231 cells to delineate the molecular pathways of morcin induced cell death. It was observed thatNotch-1 and NFƙB protein shows significantly low level of expression in moricin exposed cells (Fig. 7A &B), Next, we check for the expression of tumor suppressor gene P53, interestingly our results shows significantly high expression of P53 (Fig. 7C&D),, subsequently we also checked for the protein expression of apoptotic pathways (viz. Bad, Bcl-2, Caspase3 and Caspase9). We observed the level of Bcl-2 proteins were significantly downregulated (Fig. 7C&D), whereas the protein expression of Bad, Caspase3 and Caspase9 were found to be significantly upregulated (Fig. 7E &F),
In the present study, we have predicted and examined the potential anti-cancerous properties of moricin peptide obtained from Bombyx mori, utilizing in silico and in vitro model systems. Our in silico findings stipulated that moricin is a cationic peptide with remarkable anticancer properties. Since, it can permeate through the cell membrane and, has a peculiar DNA binding sequence of amino acid residues. Additionally, the moricin peptide has high binding energy (-48.92 kcal/mol) to the human Notch-1 receptor. Following that, we used an in vitro model system to confirm our in silico findings. Our findings demonstrate that exposing MDA-MB-231 cells to moricin peptide causes intracellular oxidative stress and superoxide anion formation in the mitochondria, resulting in morphological alterations in the mitochondria, lysosomes, and nucleus. Furthermore, our molecular study unveiled that moricin peptide may trigger the apoptotic pathway(s) via Notch-1 mediated modulation of NFKB, Bcl2, and P53 proteins.
Research over the last three decades has shown that naturally occurring peptides have antibacterial properties. However, various studies have revealed that these natural peptides may have some additional properties such as immunomodulatory activity, antiviral, antifungal, and anticancer effects 18,21,37. Owing to the multifactorial effects of these natural peptides, we have screened and selected the moricin peptide from Bombyx mori (silkworm). This peptide is produced as a component of their innate immune system to defend against the bacterial infection 24. Thus, the antimicrobial activity of moricin is well documented. The antibacterial peptide moricin consists of a sequence with a highly basic entity, and the greater the basicity, the more anti-microbial effects it possesses 25. To the best of our knowledge, no study has investigated the anticancer properties of this peptide. Therefore, to explore the anticancer potential, initially, we performed an in silico study of the moricin peptide. Interestingly, our data strongly indicate that moricin may have some anti-cancer properties. As evident from predictions, AntiCP and iACP servers with SVM scores of 0.75 and 0.99 reveal their potent anticancer property predictions. Additionally, the SVM score of 0.16 has been overserved for the cell-penetrating property of the peptide. The iDNA-Prot server reveals that the peptide interacts with the nucleic acids and the interacting amino acids predicted were Tyr27, Glu30, Val31, Asp33, and Phe34. The secondary structures of the peptide were anticipated to have a higher percentage of α-helices than coil and β-strand. In recent years, an increasing number of α-helical peptides have been discovered as ACPs 38. Wang et.al., have shown that α-helical peptide L-K6 can enter MCF7 cells through micropinocytosis and inhibit cancer cell death by causing substantial damage to the nucleus 39. Similarly, Liu has reported that anti-microbial α-helical peptide induces death in cancer cells 40. Interestingly, our study has also shown the similar anticancer effects of moricin peptide on cancer cells. It might be possible as moricin peptide have the electrostatic association(s) between positively and negatively charged ions with an isoelectric point (pI) calculated to be at 11.3. Since the membranes of bacteria and cancer cells have a similar net negative charge, therefore cationic peptides can kill both bacteria and cancer cells 41. As evident from the data, the instability index value of 8.32 confirms the stability of the peptide which might be due to the presence of a larger number of α-helices in the structure. Moreover, various other parameters such as cationic hydrophobic and ampiphilicity may also contribute significantly to enhancing the anticancerous effects by imparting cytotoxicity to cancer cells 42. Furthermore, the peptide did not possess any allergenic and digestion resistance responses. Protein-peptide docking was used to investigate the binding affinity of moricin peptide to the cancer cell signalling-associated marker. Among several marker proteins Notch protein family shows strong binding with the peptide. Thus, considering it we further investigated the Protein-peptide based interaction with the other members' proteins of notch signalling viz. human DLL4, crystal structure notch 1, notch 3, and jagged-1 proteins. To validate in silico predictions, we have procured the moricin peptide with its physiochemical characterization to ensure its properties. The purified peptide chromatogram revealed a single main peak (indicating peptide purity) at about a retention time of 8.1 min 43. Additionally, CD and LC/MS spectrum study reveals that moricin peptide is predominately have α-helical structure with a molecular weight of 4544.0 0.4 Da, Our data was also consistent with the literature-reported value of moricin peptide 44,45. Next, our in vitro findings reinforced the anticancer properties of the peptides by showing a significant decline in the number of cancer cell viability at relatively low concentrations (1.37 and 2.75 µM), which indicates that moricin can efficiently disrupt the growth and proliferation of cancer cells. Kuroda et. al., have assess the cytotoxicity of membrane permeable peptide in breast cancer cells at 0.5-1 mM concentrations 46, likewise, Li et.al., have shown that nanoparticle assembled peptides (12–54 µM) have significantly increases cytotoxicity in ovarian and lung cancer cells 47. It is well known that ROS has been implicated in various cellular processes and metabolic pathways of cancer cells, thus perturbation in cellular thiol levels would directly affect the growth of cancer cells 31,48. Interestingly, our results also showed that moricin even at relatively low concentrations (6.25 µg/ml and 12.5 g/ml) causes significantly higher levels of ROS in the cytosol and mitochondria. Furthermore, it should be noted that the generation of free reactive superoxide (O2•–) species in mitochondria is well established to disrupt the oxidative phosphorylation at the inner mitochondrial membrane, which eventually culminates in ATP deprivation 31. Therefore it might be possible that moricin-induced formation of free reactive superoxide (O2•–) in mitochondria may play a significant role to limit cancer cell growth and proliferation. Nevertheless, these speculations are further confirmed by significant alteration in the morphology of mitochondria. In continuation, the considerable decrease in the intracellular glutathione levels in moricin-exposed cells demonstrates the mortician's deleterious effects on the cellular redox state in cancer cells. Moreover, this unusual redox imbalance causes a considerable increase in lipid peroxidation 49, which is supposed to alter the wide variety of lipids present in the membrane of various cell organelles such as mitochondria and lysosomes. As lipids play an essential role in maintaining the structure and integrity of the cell membranes. Various studies have shown that free radicals can directly interfere with chromosomal integrity, thus may disturb the central dogma 50. Interestingly, our BrdU assay results also show that moricin causes a dramatic reduction in the rate of BrdU incorporation, which signifies that moricin exposure to cancer cells may disrupt the process of cell replication, and as a consequence, cell proliferation may be diminished 51. Moreover, various researchers have reported that the interplay between Notch1, NFkB, and p53 plays a crucial role in determining the proliferative and apoptotic fate of cancer cells 52–54. Therefore, we were also interested in investigating the effects of moricin binding to the Notch1 receptor. Interestingly, our molecular study has shown that moricin binding to the Notch1 receptor causes a significant decrease in the expression of Notch1 protein, along with NFkB. Whereas the expression of P53 protein was found to be markedly upregulated in moricin-exposed cells, these results indicate that a decrease in Notch1 protein expression is inversely related to the upregulation of P53 protein. Moreover, it is a well-established fact that higher expression of ROS in cancer cells triggers the higher expression of the P53 protein 55. All these events may directly suppress the expression of NFkB and Bcl2 proteins. Since it is widely known that P53 acts as a tumor suppressor gene its higher expression of P53 protein causes induction of caspase-dependent cell death pathway in cancer cells 48. Likewise, our findings have also shown similar effects on the expression of Bax, Caspase 3, and Caspase 9 expression. In conclusion, our findings were consistent with earlier reports. Hence, these findings suggest that treatment with moricin in MDA-MB231 results in ROS-induced, caspase-dependent cell death.
Funding Declaration
This work is supported by Department of Health Research (DHR) grant under Young Scientist Scheme (R.12014/61/2020-HR), Indian Council of Medical Research, New Delhi.
Declaration of competing interest
The authors declare that they have no known competing financial interests or personal relationships that could have appeared to influence the work reported in this paper.
Author contribution
IA designed the study theme and funding acquisition. IA, SP, KA, AS performed experiments and data extraction. IA, SP, KA, ND analyzed the data. IA, SP wrote the manuscript and SS, RS finalized the manuscript. All authors reviewed the manuscript before the submission.
Consent for publication
Not applicable
Data Availability
The datasets used in the current study are available from the corresponding authors on reasonable request. All data generated/analysed during this study are included in this article.
- Haussmann J, Corradini S, Nestle-Kraemling C, Bölke E, Njanang FJD, Tamaskovics B, et al. Recent advances in radiotherapy of breast cancer. Radiation oncology 2020;15:1-10.
- Sung H, Ferlay J, Siegel RL, Laversanne M, Soerjomataram I, Jemal A, et al. Global cancer statistics 2020: GLOBOCAN estimates of incidence and mortality worldwide for 36 cancers in 185 countries. CA: a cancer journal for clinicians 2021;71:209-49.
- Ginsburg O, Yip CH, Brooks A, Cabanes A, Caleffi M, Dunstan Yataco JA, et al. Breast cancer early detection: A phased approach to implementation. Cancer 2020;126:2379-93.
- Feng Y, Spezia M, Huang S, Yuan C, Zeng Z, Zhang L, et al. Breast cancer development and progression: Risk factors, cancer stem cells, signaling pathways, genomics, and molecular pathogenesis. Genes diseases 2018;5:77-106.
- Kresovich JK, Xu Z, O’Brien KM, Weinberg CR, Sandler DP, Taylor JA. Methylation-based biological age and breast cancer risk. JNCI: Journal of the National Cancer Institute 2019;111:1051-8.
- Cifu G, Arem H. Adherence to lifestyle-related cancer prevention guidelines and breast cancer incidence and mortality. Annals of Epidemiology 2018;28:767-73. e1.
- Busund M, Bugge NS, Braaten T, Waaseth M, Rylander C, Lund E. Progestin‐only and combined oral contraceptives and receptor‐defined premenopausal breast cancer risk: The Norwegian Women and Cancer Study. International journal of cancer 2018;142:2293-302.
- Suba Z. Triple-negative breast cancer risk in women is defined by the defect of estrogen signaling: preventive and therapeutic implications. OncoTargets therapy 2014;7:147.
- Xie X, Lee J, Liu H, Pearson T, Lu AY, Tripathy D, et al. Birinapant Enhances Gemcitabine's Antitumor Efficacy in Triple-Negative Breast Cancer by Inducing Intrinsic Pathway–Dependent ApoptosisSynergistic Effect of Birinapant and Gemcitabine in TNBC. Molecular cancer therapeutics 2021;20:296-306.
- Hengartner M. The biochemistry of apoptosis. Nature 2000;407:770-6.
- Qin S, Jiang J, Lu Y, Nice EC, Huang C, Zhang J, et al. Emerging role of tumor cell plasticity in modifying therapeutic response. Signal transduction targeted therapy 2020;5:1-36.
- Ji X, Lu Y, Tian H, Meng X, Wei M, Cho WC. Chemoresistance mechanisms of breast cancer and their countermeasures. Biomedicine Pharmacotherapy 2019;114:108800.
- Gupta GK, Collier AL, Lee D, Hoefer RA, Zheleva V, Siewertsz van Reesema LL, et al. Perspectives on triple-negative breast cancer: current treatment strategies, unmet needs, and potential targets for future therapies. Cancers 2020;12:2392.
- Xie M, Liu D, Yang Y. Anti-cancer peptides: Classification, mechanism of action, reconstruction and modification. Open Biology 2020;10:200004.
- Teerasak E, Thongararm P, Roytrakul S, Meesuk L, Chumnanpuen P. Prediction of anticancer peptides against MCF-7 breast cancer cells from the peptidomes of Achatina fulica mucus fractions. Computational structural biotechnology journal 2016;14:49-57.
- Hilchie AL, Doucette CD, Pinto DM, Patrzykat A, Douglas S, Hoskin DW. Pleurocidin-family cationic antimicrobial peptides are cytolytic for breast carcinoma cells and prevent growth of tumor xenografts. Breast cancer research 2011;13:1-16.
- Li D, Xu Y. Buforin IIb induced cell cycle arrest in liver cancer. Animal Cells Systems 2019;23:176-83.
- Yang L, Cui Y, Shen J, Lin F, Wang X, Long M, et al. Antitumor activity of SA12, a novel peptide, on SKBr-3 breast cancer cells via the mitochondrial apoptosis pathway. Drug design, development therapy 2015;9:1319.
- Wu X, Zeng W, Lin F, Xu P, Li X. Anticancer Peptide Prediction via Multi-Kernel CNN and Attention Model. Frontiers in Genetics 2022;13.
- Mylonakis E, Podsiadlowski L, Muhammed M, Vilcinskas A. Diversity, evolution and medical applications of insect antimicrobial peptides. Philosophical Transactions of the Royal Society B: Biological Sciences 2016;371:20150290.
- Feng M, Fei S, Xia J, Labropoulou V, Swevers L, Sun J. Antimicrobial peptides as potential antiviral factors in insect antiviral immune response. Frontiers in immunology 2020;11:2030.
- Lee RH, Oh J-D, Hwang JS, Lee H-K, Shin D. Antitumorigenic effect of insect-derived peptide poecilocorisin-1 in human skin cancer cells through regulation of Sp1 transcription factor. Scientific reports 2021;11:1-10.
- Moghaddam M-RB, Vilcinskas A, Rahnamaeian M. The insect-derived antimicrobial peptide metchnikowin targets Fusarium graminearum β (1, 3) glucanosyltransferase Gel1, which is required for the maintenance of cell wall integrity. Biological Chemistry 2017;398:491-8.
- Nesa J, Sadat A, Buccini DF, Kati A, Mandal AK, Franco OL. Antimicrobial peptides from Bombyx mori: a splendid immune defense response in silkworms. RSC advances 2020;10:512-23.
- Xu X, Zhong A, Wang Y, Lin B, Li P, Ju W, et al. Molecular identification of a moricin family antimicrobial peptide (px-mor) from plutella xylostella with activities against the opportunistic human pathogen Aureobasidium pullulans. Frontiers in microbiology 2019;10:2211.
- Dai H, Rayaprolu S, Gong Y, Huang R, Prakash O, Jiang H. Solution structure, antibacterial activity, and expression profile of Manduca sexta moricin. Journal of peptide science: an official publication of the European Peptide Society 2008;14:855-63.
- Yang W, Cheng T, Ye M, Deng X, Yi H, Huang Y, et al. Functional divergence among silkworm antimicrobial peptide paralogs by the activities of recombinant proteins and the induced expression profiles. PloS one 2011;6:e18109.
- Baindara P, Gautam A, Raghava G, Korpole S. Anticancer properties of a defensin like class IId bacteriocin Laterosporulin10. Scientific reports 2017;7:1-9.
- Pan W-R, Chen Y-LS, Hsu H-C, Chen W-J. Antimicrobial peptide GW-H1-induced apoptosis of human gastric cancer AGS cell line is enhanced by suppression of autophagy. Molecular cellular biochemistry 2015;400:77-86.
- Robles-Fort A, García-Robles I, Fernando W, Hoskin DW, Rausell C, Real MD. Dual antimicrobial and antiproliferative activity of TcPaSK peptide derived from a Tribolium castaneum insect defensin. Microorganisms 2021;9:222.
- Pal S, Singh N, Dev I, Sharma V, Jagdale PR, Ayanur A, et al. TGF-β/Smad signaling pathway plays a crucial role in patulin-induced pro-fibrotic changes in rat kidney via modulation of slug and snail expression. Toxicology Applied Pharmacology 2022;434:115819.
- Rastogi A, Timme‐Laragy AR. Using Monochlorobimane to Visualize Glutathione Utilization in the Developing Zebrafish (Danio rerio) Embryo. Current Protocols 2021;1:e124.
- Ahmad I, Narayan S, Shukla J, Shirke PA, Kumar M. Endofungal Rhizobium species enhance arsenic tolerance in colonized host plant under arsenic stress. Archives of Microbiology 2022;204:1-15.
- De Leon JAD, Borges CR. Evaluation of oxidative stress in biological samples using the thiobarbituric acid reactive substances assay. JoVE 2020:e61122.
- Salic A, Mitchison TJ. A chemical method for fast and sensitive detection of DNA synthesis in vivo. Proceedings of the National Academy of Sciences 2008;105:2415-20.
- Khan MA, Siddiqui S, Ahmad I, Singh R, Mishra DP, Srivastava AN, et al. Phytochemicals from Ajwa dates pulp extract induce apoptosis in human triple-negative breast cancer by inhibiting AKT/mTOR pathway and modulating Bcl-2 family proteins. Scientific reports 2021;11:1-14.
- Ghodsi Z, Kalbassi MR, Farzaneh P, Mobarez AM, Beemelmanns C, Moghaddam JAJF. Immunomodulatory function of antimicrobial peptide EC-Hepcidin1 modulates the induction of inflammatory gene expression in primary cells of Caspian Trout (Salmo trutta caspius Kessler, 1877). Fish shellfish immunology 2020;104:55-61.
- Hadianamrei R, Tomeh MA, Brown S, Wang J, Zhao X. Rationally designed short cationic α-helical peptides with selective anticancer activity. Journal of Colloid Interface Science 2022;607:488-501.
- Wang C, Dong S, Zhang L, Zhao Y, Huang L, Gong X, et al. Cell surface binding, uptaking and anticancer activity of L-K6, a lysine/leucine-rich peptide, on human breast cancer MCF-7 cells. Scientific reports 2017;7:1-13.
- Liu S, Yang H, Wan L, Cai H-w, Li S-f, Li Y-p, et al. Enhancement of cytotoxicity of antimicrobial peptide magainin II in tumor cells by bombesin-targeted delivery. Acta Pharmacologica Sinica 2011;32:79-88.
- Lei J, Sun L, Huang S, Zhu C, Li P, He J, et al. The antimicrobial peptides and their potential clinical applications. American journal of translational research 2019;11:3919.
- Chiangjong W, Chutipongtanate S, Hongeng S. Anticancer peptide: Physicochemical property, functional aspect and trend in clinical application. International Journal of Oncology 2020;57:678-96.
- Coin I, Beyermann M, Bienert M. Solid-phase peptide synthesis: from standard procedures to the synthesis of difficult sequences. Nature protocols 2007;2:3247-56.
- Hara S, Yamakawa M. Moricin, a Novel Type of Antibacterial Peptide Isolated from the Silkworm, Bombyx mori (∗). Journal of Biological Chemistry 1995;270:29923-7.
- Hemmi H, Ishibashi J, Hara S, Yamakawa M. Solution structure of moricin, an antibacterial peptide, isolated from the silkworm Bombyx mori. FEBS letters 2002;518:33-8.
- Kuroda Y, Kato-Kogoe N, Tasaki E, Yuasa-Sunagawa M, Yamanegi K, Nakasyo K, et al. Suppressive effect of membrane-permeable peptides derived from autophosphorylation sites of the IGF-1 receptor on breast cancer cells. European Journal of Pharmacology 2015;765:24-33.
- Li S, Zou R, Tu Y, Wu J, Landry MP. Cholesterol-directed nanoparticle assemblies based on single amino acid peptide mutations activate cellular uptake and decrease tumor volume. Chemical science 2017;8:7552-9.
- Siddiqui S, Upadhyay S, Ahmad I, Hussain A, Ahamed M. Cytotoxicity of Moringa oleifera fruits on human liver cancer and molecular docking analysis of bioactive constituents against caspase‐3 enzyme. Journal of Food Biochemistry 2021;45:e13720.
- Dai X, Wang D, Zhang J. Programmed cell death, redox imbalance, and cancer therapeutics. Apoptosis 2021;26:385-414.
- Chiang S-C, Meagher M, Kassouf N, Hafezparast M, McKinnon PJ, Haywood R, et al. Mitochondrial protein-linked DNA breaks perturb mitochondrial gene transcription and trigger free radical–induced DNA damage. Science advances 2017;3:e1602506.
- Kim S-J, Masaki T, Leypoldt JK, Kamerath CD, Mohammad SF, Cheung AK. Arterial and venous smooth-muscle cells differ in their responses to antiproliferative drugs. Journal of Laboratory Clinical Medicine 2004;144:156-62.
- Liu Q, Loo WT, Sze S, Tong Y. Curcumin inhibits cell proliferation of MDA-MB-231 and BT-483 breast cancer cells mediated by down-regulation of NFκB, cyclinD and MMP-1 transcription. Phytomedicine 2009;16:916-22.
- Zhou B, Lin W, Long Y, Yang Y, Zhang H, Wu K, et al. Notch signaling pathway: Architecture, disease, and therapeutics. Signal transduction targeted therapy 2022;7:1-33.
- Nair P, Somasundaram K, Krishna S. Activated Notch1 inhibits p53-induced apoptosis and sustains transformation by human papillomavirus type 16 E6 and E7 oncogenes through a PI3K-PKB/Akt-dependent pathway. Journal of virology 2003;77:7106-12.
- Khan MA, Singh R, Siddiqui S, Ahmad I, Ahmad R, Upadhyay S, et al. Anticancer potential of Phoenix dactylifera L. seed extract in human cancer cells and pro-apoptotic effects mediated through caspase-3 dependent pathway in human breast cancer MDA-MB-231 cells: an in vitro and in silico investigation. BMC complementary medicine therapies 2022;22:1-19.
Table 1: Prediction of Physicochemical, Allergic, and Digestive Properties of Peptide
|
S.No. |
Properties |
Observation |
|
1. |
Allergenicity |
Probable Non-Allergen |
|
2. |
GI Digestion Resistance |
No |
|
3. |
Hydrophobicity |
-0.18 (47.62%) |
|
4. |
Steric Hindrance |
0.62 |
|
5. |
Sidebulk |
0.62 |
|
6. |
Hydropathicity |
-0.21 |
|
7. |
Amphipathicity |
0.94 |
|
8. |
Hydrophilicity |
0.25 |
|
9. |
Net Hydrogen |
0.88 |
|
10. |
Charge |
10.50 |
|
11. |
Isoelectric Point (pI) |
11.37 |
|
12. |
Molecular Weight (MW) |
4544.16 |
|
13. |
GRAVY |
-0.21 |
|
14. |
Instability Index |
8.32 (Stable) |
Table 2: Properties of moricin peptide for the study of anticancer property
|
SVM scorea |
AntiCP predictionb |
iACP predictionc |
iDNAprotd |
CPPe |
Predicted secondary Structuref |
||||
|
AntiCP |
iACP |
CPP |
Anticancer |
Anticancer |
DNA binding protein |
Penetrate cell membrane |
Helix |
Coil |
Strand |
|
0.75 |
0.993363 |
0.16 |
57.14% |
26.19% |
11.90% |
||||
aSVM score of the peptide given by the AntiCP server, iACP server and ToxinPred server respectively.
b,cAnticancer property of peptide predicted by AntiCP and iACP server respectively
dPredicting DNA-binding proteins by iDNA-Prot server
ePrediction of Cell Penetrating Peptides by CPPpred server
fSecondary structure predicted by SOPMA
Table 3: Peptide Nucleic Acid Binding Sites Predicted by I-TASSER server. In left panel, represents peptide moricin binds the nucleic acid, displaying the interacting amino acid residues. Right panel represents the C-score which ranges [0-1], where a higher score indicates a more reliable prediction. Predicted Result: Protein MOR may be DNA binding protein

Table 4: Summary of Moricin Peptide Docked with Selected Target Proteins using HawkDock Server

No competing interests reported.