RNA-sequencing and data processing
Genes associated with rainbow trout immune response to Y. ruckeri infection were identified by assessing spleen samples from YR-infected and control uninfected fish via RNA-sEq. In total, six cDNA libraries were prepared (from 3 per group), and raw data were generated (Table S1) and deposited in the NCBI Sequence Read Archive (SRA) under accession number PRJNA675742.
Following the completion of filtering, 44.07 G bp of clean data were extracted, with over 93.15–93.55% of the bases reads having a phred quality value ≥ 30 in the non-infected group compared to 92.87–93.43% in the YR-infected group. These quality scores were consistent with excellent quality data. Reads from these two groups exhibited GC contents of 49.14–49.64% and 49.00-49.18%, respectively (Table 1).
Table 1
Characteristics of RNA-seq data
|
Samples
|
Clean reads (M)
|
Clean bases (Gb)
|
GC Content (%)
|
Q30 (%)
|
|
non-infected rainbow trout 1
|
26.9191
|
8.0181
|
49.14
|
93.18
|
|
non-infected rainbow trout 2
|
23.4555
|
6.9991
|
49.64
|
93.55
|
|
non-infected rainbow trout 3
|
25.5238
|
7.6123
|
49.33
|
93.15
|
|
YR-infected rainbow trout 1
|
22.5961
|
6.7523
|
49.18
|
92.87
|
|
YR-infected rainbow trout 2
|
23.5341
|
7.0248
|
49.00
|
93.43
|
|
YR-infected rainbow trout 3
|
25.7487
|
7.6694
|
49.18
|
93.32
|
|
Non-infected group
|
75.8984
|
22.6295
|
49.32
|
93.29
|
|
YR-infected group
|
72.0286
|
21.4465
|
49.12
|
93.21
|
|
Total
|
147.927
|
44.076
|
49.25
|
93.25
|
The total number of expressed genes detected in samples from uninfected rainbow trout was slightly higher than that detected in YR-infected rainbow trout (Fig. 1).
Read Mapping To The Reference Genome
Cleaned reads were mapped to the O. mykiss reference genome, with 84.81–85.99% of these reads ultimately matching perfectly. Over 70% of reads aligned to exonic regions in each library, of which 78.05–78.24% in the uninfected group and 78.53–79.11% in the YR-infected groups mapping to unique reads whereas 6.76–7.38% in the uninfected group and 6.81–7.17% in the YR-infected groups mapping to multiple reads. A total of 123.7985 (41.90%) and 125.0329 (42.32%) M reads in the uninfected and YR-infected groups mapped to reference genome sense and antisense strands, respectively (Table 2). Besides, some new genes were detected and classified with the NR, Swiss-Prot, GO, COG, KOG, Pfam, and KEGG databases (Table S2).
Table 2
RNA-seq alignment details and mapping ratios
|
Samples
|
Total reads (M)
|
Mapped reads (M)
|
Uniq mapped reads (M)
|
Multiple map reads (M)
|
Reads map to ‘+’
|
Reads map to ‘-’
|
|
Non-infected rainbow trout 1
|
53.8382
|
45.6616 (84.81%)
|
42.0247 (78.06%)
|
3.6369
(6.76%)
|
22.4170 (41.64%)
|
22.6348 (42.04%)
|
|
Non-infected rainbow trout 2
|
46.9109
|
40.1607 (85.61%)
|
36.7008 (78.24%)
|
3.4599
(7.38%)
|
19.7468 (42.09%)
|
19.9220 (42.47%)
|
|
Non-infected rainbow trout 3
|
51.0477
|
43.3188 (84.86%)
|
39.8427 (78.05%)
|
3.4761
(6.81%)
|
21.3261 (41.78%)
|
21.4872 (42.09%)
|
|
YR-infected rainbow trout 1
|
45.1922
|
38.7941 (85.84%)
|
35.5522 (78.67%)
|
3.2418
(7.17%)
|
19.0209 (42.09%)
|
19.2198 (42.53%)
|
|
YR-infected rainbow trout 2
|
47.0682
|
40.4739 (85.99%)
|
37.2354 (79.11%)
|
3.2386
(6.88%)
|
19.7989 (42.06%)
|
20.0358 (42.57%)
|
|
YR-infected rainbow trout 3
|
51.4973
|
43.9318 (85.31%)
|
40.4383 (78.53%)
|
3.4934
(6.78%)
|
21.4897 (41.73%)
|
21.7333 (42.20%)
|
|
Non-infected group
|
50.5989
|
129.1411
(85.09%)
|
118.5682
(78.12%)
|
10.5729
(6.98%)
|
63.4899
(41.84%)
|
64.0440
(42.20%)
|
|
YR-infected group
|
47.9192
|
123.1998
(85.71%)
|
113.2259
(78.77%)
|
9.9738
(6.94%)
|
60.3095
(41.96%)
|
60.9889
(42.43%)
|
|
Total
|
295.5624
|
252.3409
(85.40%)
|
231.7941
(78.44%)
|
20.5467
(6.96%)
|
123.7985
(41.90%)
|
125.0329
(42.32%)
|
DEG Identification And Analysis
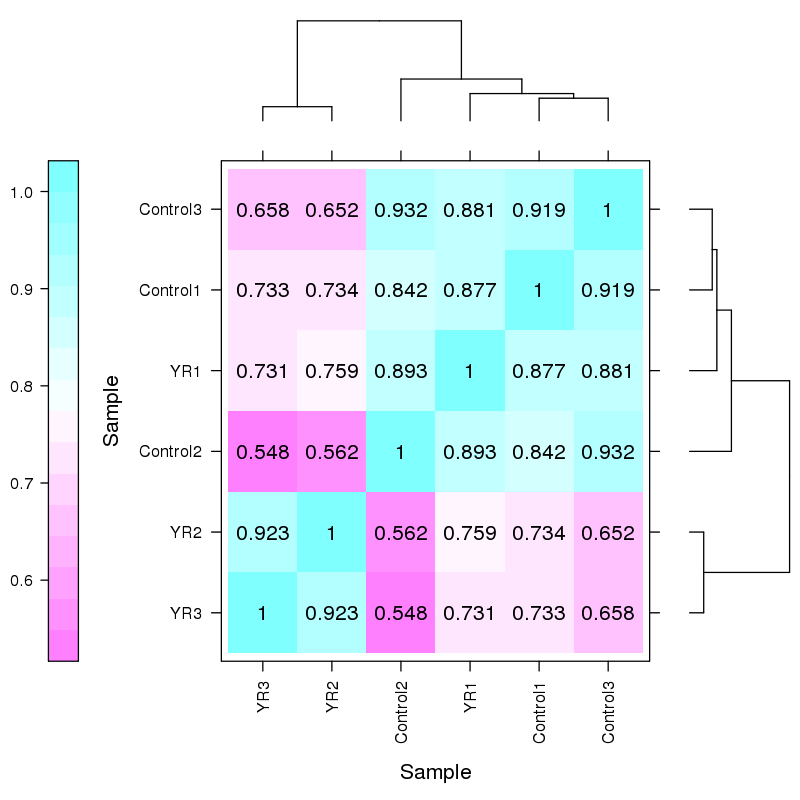
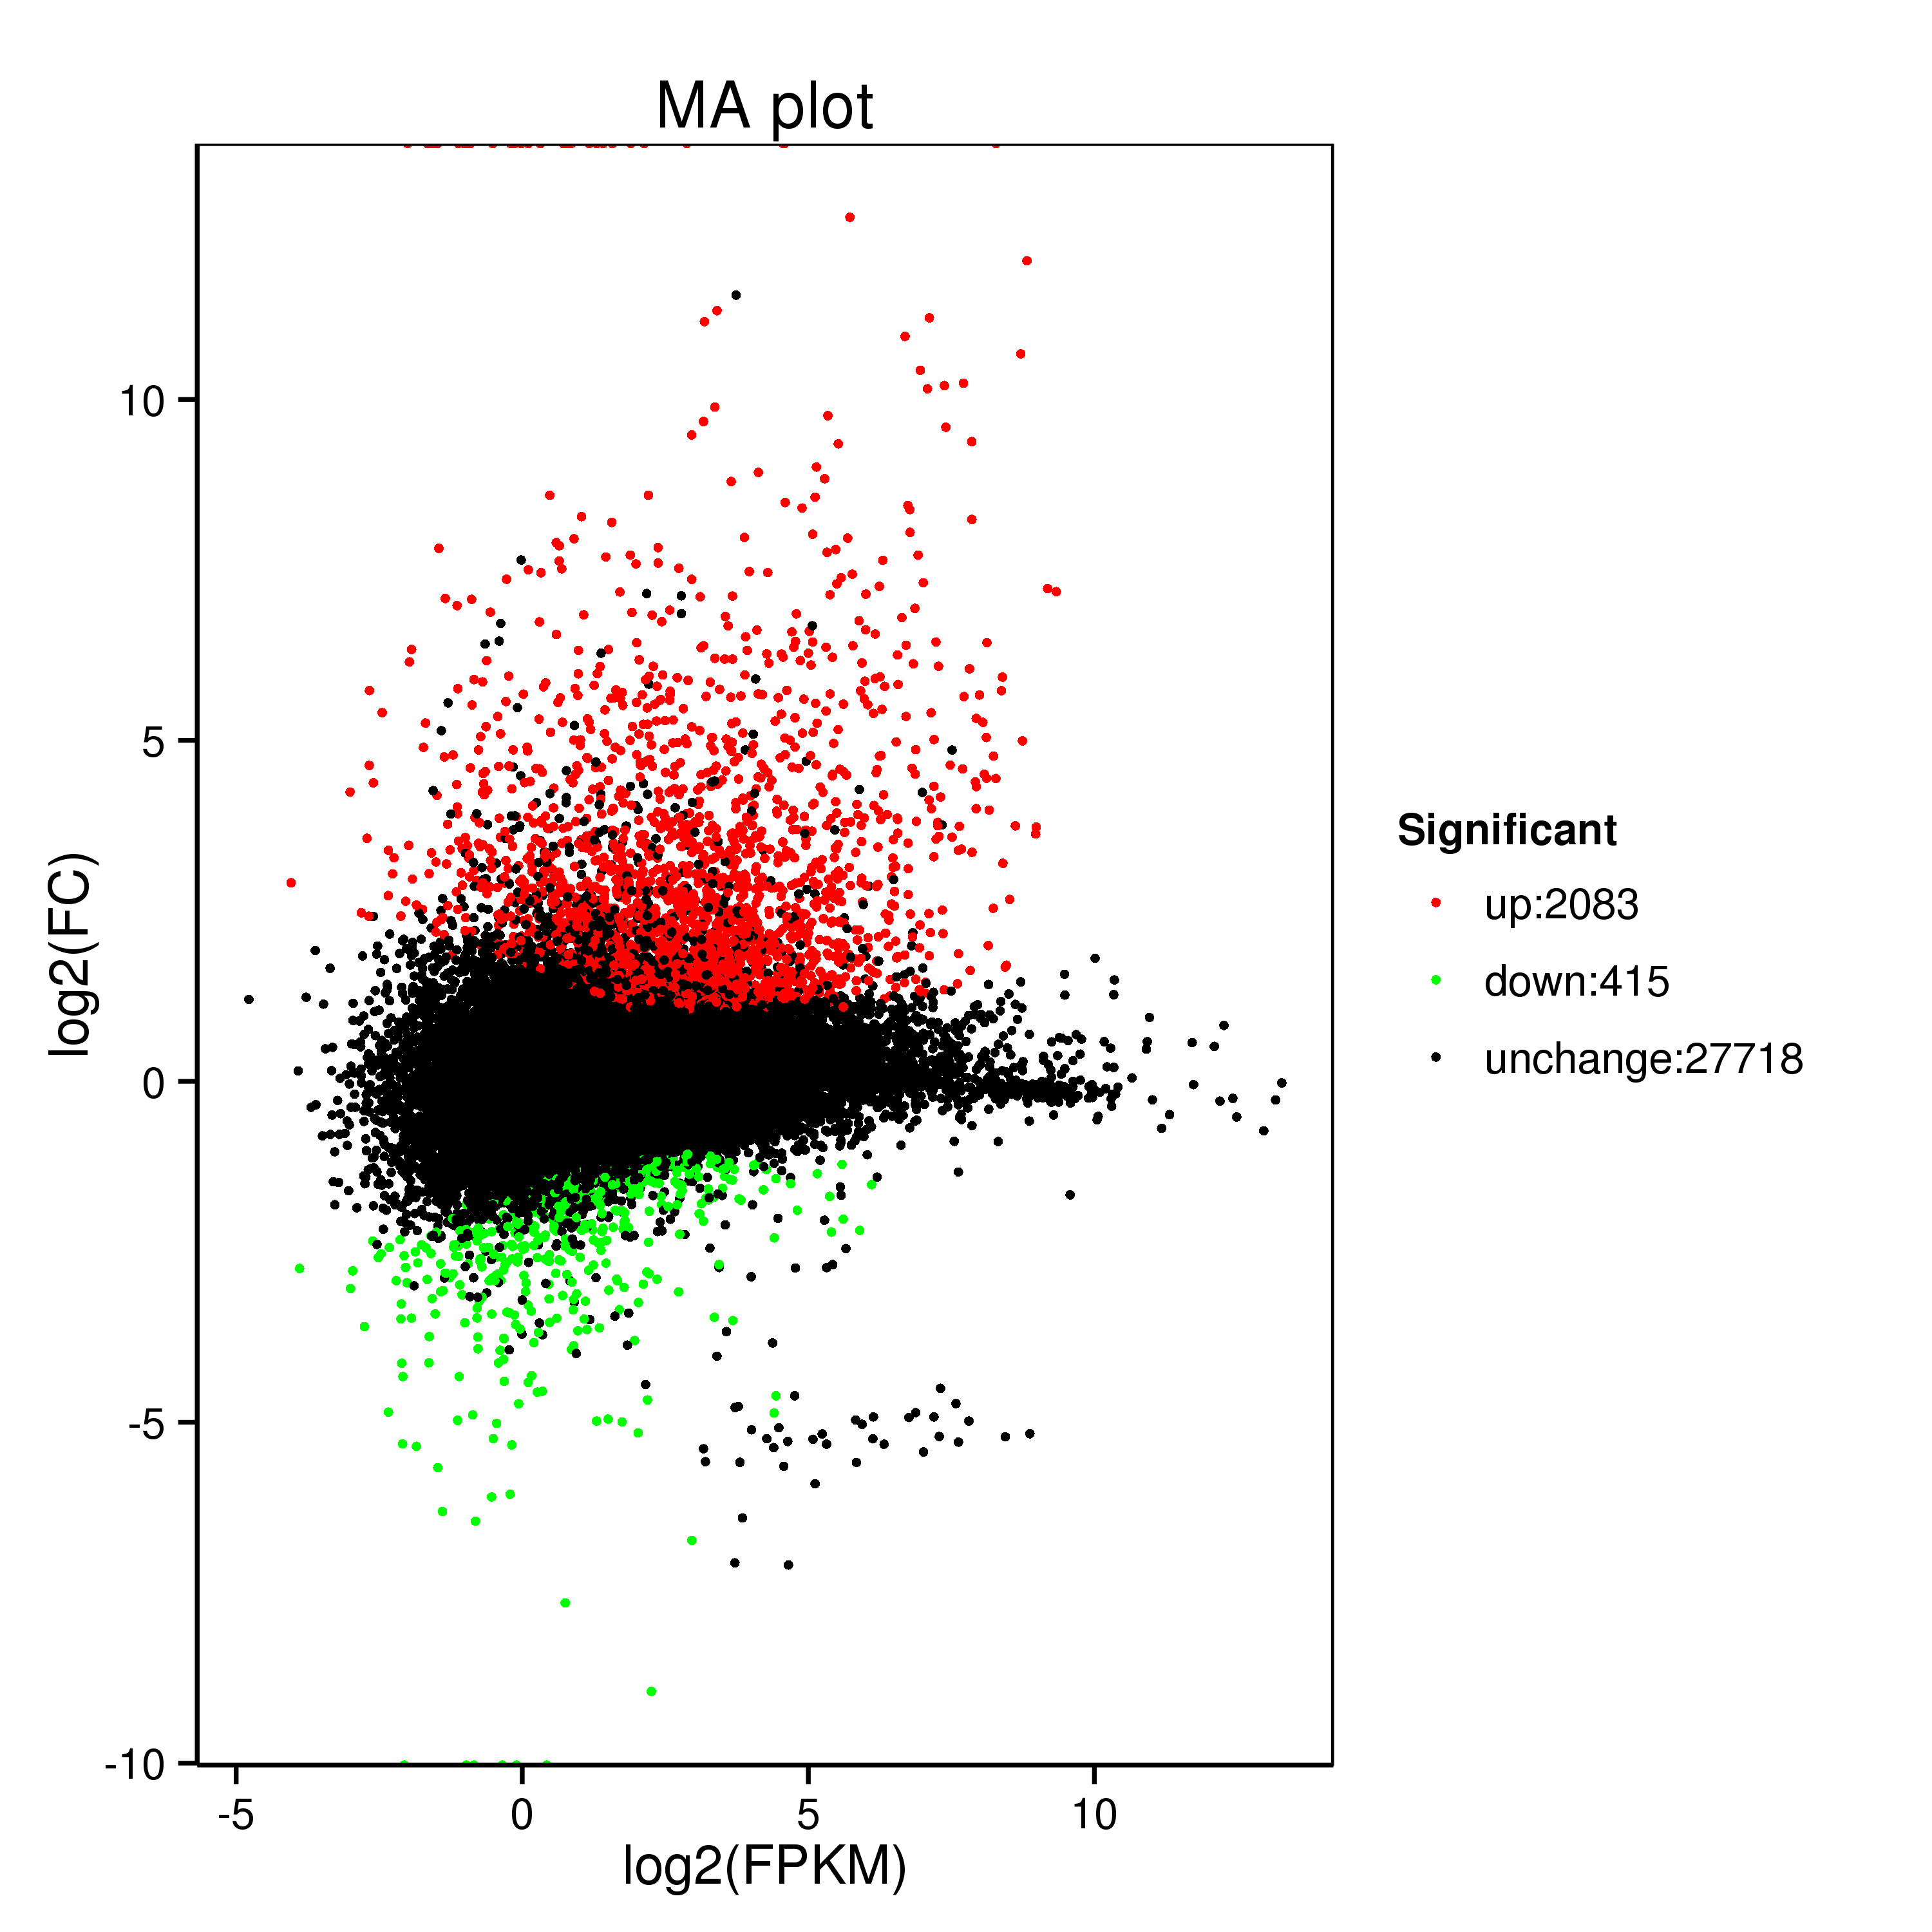
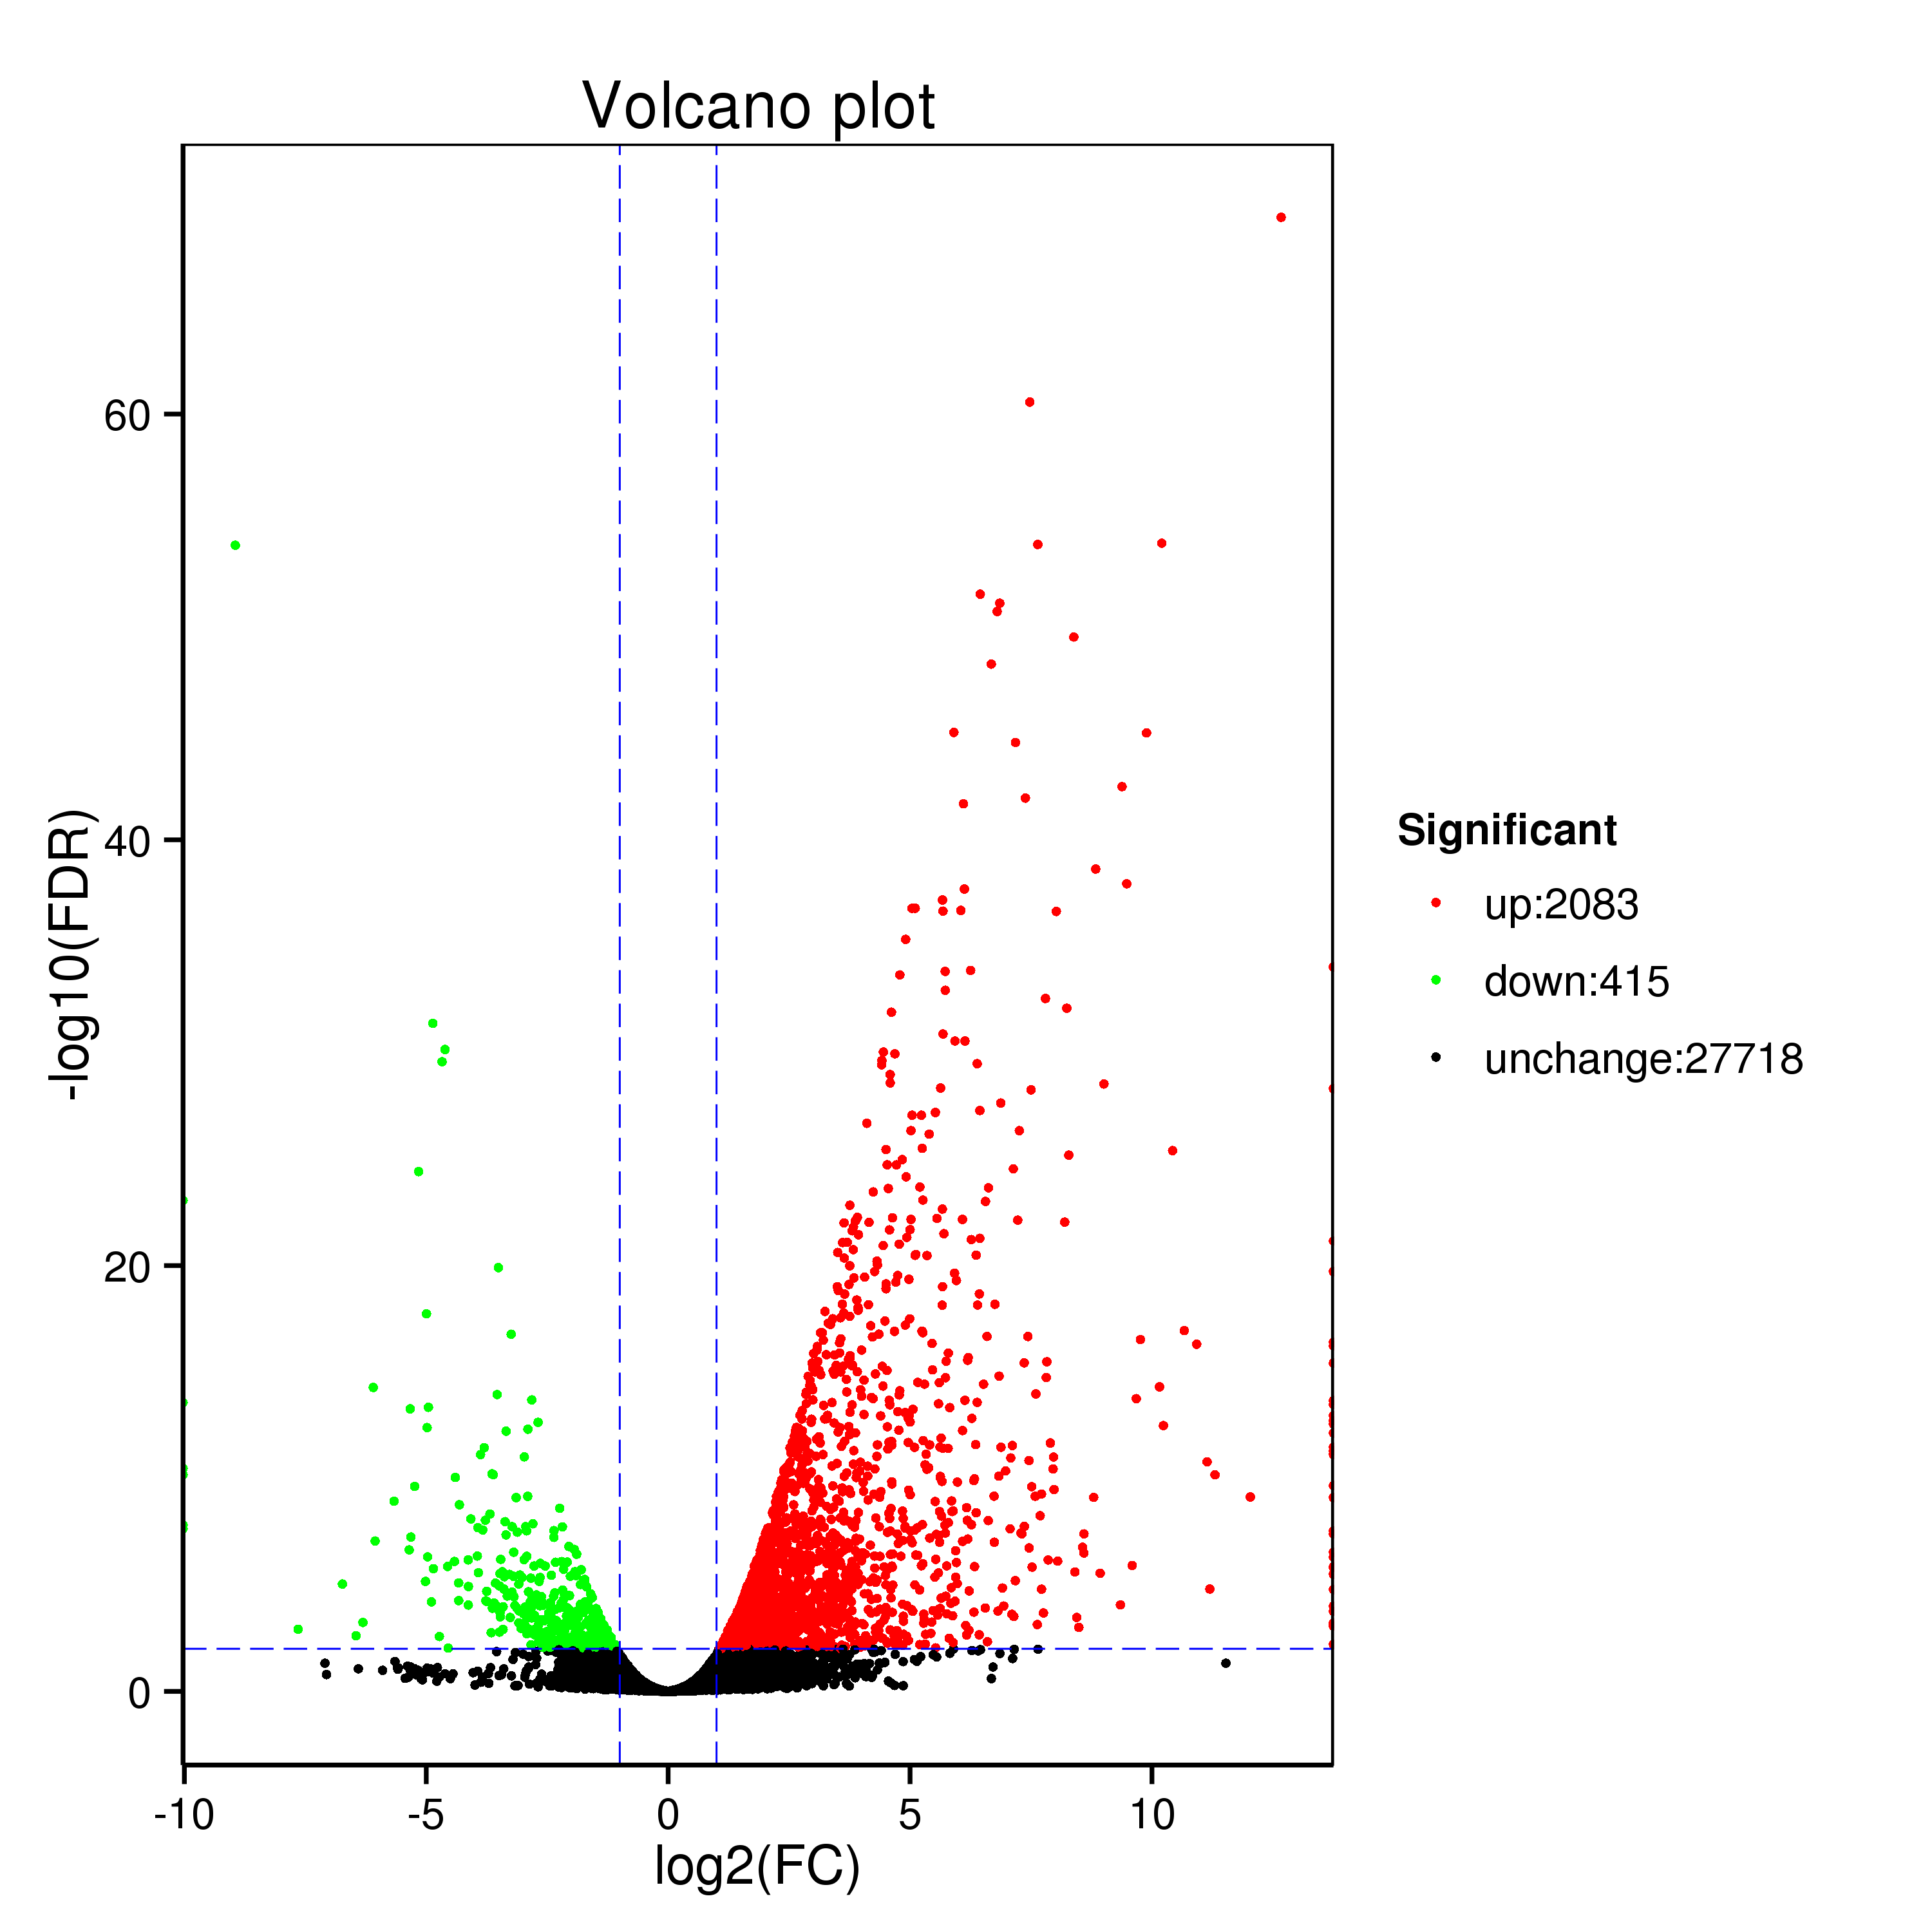
The Pearson’s correlation coefficient values were used to assess relative gene expression in the uninfected and YR-infected groups (Fig. S1). A total of 2498 DEGs were identified by comparing these groups, of which 2083 (83.39%) were up-regulated and 415 (16.61%) were down-regulated, in YR-infected fish compared to uninfected fish (Table S3). Volcano and MA plots were also used to represent these gene expression trends (Fig. S2).
Of these DEGs, 2431 were classified successfully using the NR, Swiss-Prot, GO, COG, KOG, Pfam, and KEGG databases (Table 3). With respect to new genes, many DEGs were annotated using the NR and eggNOG databases, but few were annotated in the COG database.
Table 3
Summary statistics regarding DEG functional annotation
|
Annotated databases
|
NR
|
Swiss-Prot
|
GO
|
COG
|
KOG
|
Pfam
|
KEGG
|
eggNOG
|
All
|
|
DEGs number
|
2421
|
1679
|
1766
|
584
|
1539
|
2116
|
1533
|
2295
|
2431
|
|
Ratio (%)
|
99.59
|
69.07
|
72.65
|
24.02
|
63.31
|
87.04
|
63.06
|
94.41
|
|
| To better understand the functional roles of detected DEGs, GO annotation was next performed by categorizing these DEGs into 23 biological processes (BPs), 19 cellular components (CCs), and 16 molecular functions (MFs). Cellular (42.07%), single-organism (36.51%), metabolic (30.75%), and biological (29.64%) processes were the most dominant categories of BPs, while membrane (27.94%), cell (26.34%), cell part (25.66%), and membrane part (24.70%) were the most enriched CCs and binding (40.07%) and catalytic activity (19.26%) were the most dominant MFs (Fig. 2). |
In addition, KEGG pathway enrichment analyses were performed to assess the functional roles of these DEGs during Y. ruckeri infection in rainbow trout. Assembled DEGs were analyzed with the KEGG database, leading to their classification into 6 categories (Fig. S3). KEGG enrichment results, including the top 9 pathways enriched for > 50 genes (p < 0.05), are shown in Fig. 3. Four highly enriched pathways were detected through this KEGG analysis, including the NOD-like receptor signaling, cytokine-cytokine receptor interaction, Toll-like receptor signaling, and RIG-I-like receptor signaling pathways. The preferential enrichment of these pathways suggests that many of the genes differentially expressed between uninfected and YR-infected rainbow trout were related to the immune system.
Identification Of Immune-related DEGs
To better understand the intracellular signaling pathways during Y. ruckeri infection in rainbow trout, we therefore focused on 78 immune response-related DEGs identified in this study, including two new genes (Table S4). A heatmap was constructed based upon the fold-change expression values for these DEGs (Fig. 4), clearly demonstrating that almost all of these genes (74) were upregulated in spleen samples from YR-infected fish compared to spleen samples from uninfected fish, whereas only 4 genes were down-regulated after infection.
Further analysis of these immune-related DEGs revealed them to be primarily associated with 20 immunological KEGG pathways, including the MAPK signaling, Cytokine-cytokine receptor interaction, Toll-like receptor signaling, RIG-I-like receptor signaling, NOD-like receptor signaling, FoxO signaling, mTOR signaling, apoptosis, TGF-beta signaling, regulation of autophagy, ErbB signaling, cell adhesion molecule (CAM), intestinal immune network for IgA production, cytosolic DNA-sensing, phosphatidylinositol signaling system, and p53 signaling pathways (Table 4). The top 3 pathways enriched in these genes included the NOD-like receptor signaling (31 genes), RIG-I-like signaling (35 genes), and Toll-like receptor signaling (51 genes) pathways (Fig. 5).
Table 4
|
Gene ID
|
Type
|
Log2Fold
|
Putative homolog protein
|
KEGG pathway
|
|
Gene 10807
|
up
|
12.0338
|
Interleukin-1 beta
|
ko04620: Toll-like receptor signaling pathway
|
|
Gene 24642
|
up
|
10.6682
|
Interleukin-8
|
ko04060: Cytokine-cytokine receptor interaction
|
|
Gene 22618
|
up
|
9.3812
|
interleukin-8 like
|
ko04621: NOD-like receptor signaling pathway
|
|
Gene 4948
|
up
|
8.4892
|
Tumour Necrosis Factor
|
ko04150: mTOR signaling pathway
|
|
Gene 28337
|
down
|
-2.5818
|
Mitogen-activated protein kinase 11
|
ko04010: MAPK signaling pathway
|
|
Gene 25622
|
up
|
10.1562
|
Interleukin-6
|
ko04060: Cytokine-cytokine receptor interaction
|
|
Gene 34157
|
up
|
9.0084
|
Interleukin-6
|
ko04060: Cytokine-cytokine receptor interaction
|
|
Gene 34403
|
up
|
6.5996
|
Tumor necrosis factor
|
ko04060: Cytokine-cytokine receptor interaction
|
|
Gene 25550
|
up
|
6.1699
|
Tumor necrosis factor
|
ko04060: Cytokine-cytokine receptor interaction
|
|
Gene 2178
|
down
|
-1.1786
|
NOD1
|
ko04621: NOD-like receptor signaling pathway
|
|
Gene 20638
|
up
|
4.6720
|
Small cytokines (intecrine/chemokine)
|
ko04060: Cytokine-cytokine receptor interaction
|
|
Gene 26188
|
up
|
3.7094
|
Mab-21 protein
|
ko04623: Cytosolic DNA-sensing pathway
|
|
Gene 44284
|
up
|
3.1644
|
Immunoglobulin V-set domain
|
ko04514: Cell adhesion molecules (CAMs)
|
|
Gene 23752
|
up
|
2.9294
|
Phosphoinositide 3-kinase regulatory subunit
|
ko04012: ErbB signaling pathway
|
|
Gene 5944
|
up
|
2.4306
|
Interferon alpha/beta receptor
|
ko04060: Cytokine-cytokine receptor interaction
|
Validation Of Selected Degs By Qrt-pcr
As expected, all the eight immune-related DEGs exhibited similar expression trends when measured via both qPCR and RNA-Seq analysis, confirming the reliability of our analytical techniques (Fig. 6).