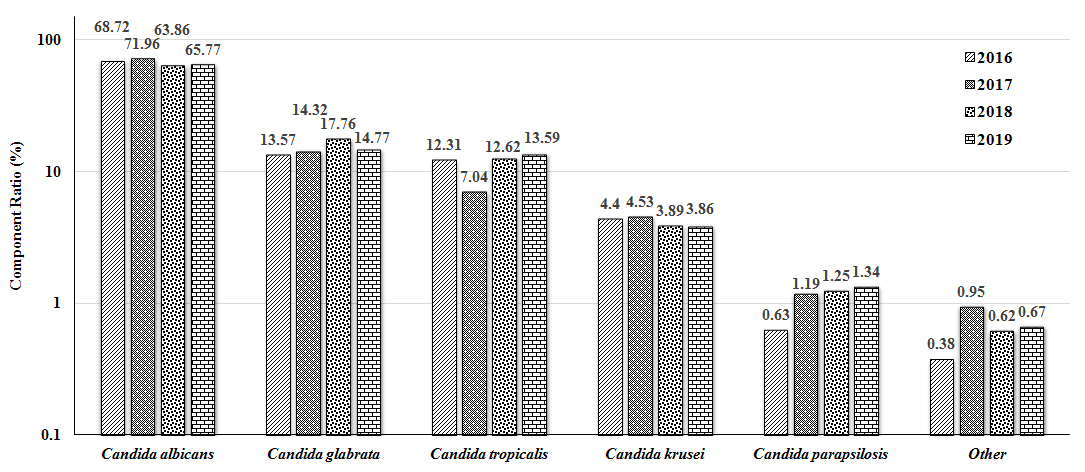
Isolation of Candida
The distribution of various types of Candida strains detected in the hospital from 2016 to 2019 was analyzed. As shown in Fig. 1, a total of 2872 strains of Candida were detected. After the Cochran Q test, the composition ratio (i.e., the percentage of all detected C. tropicalis species) of various Candida species in each year showed statistical significance (Q = 1101.094 - 1904.945; all P < 0.001). For each year, C. albicans was the major strain, accounting for more than 60% of the total (up to 71.96% in 2017), which was followed by Candida glabrata (C. glabrata), accounting for approximately 15%. C. tropicalis ranked third, no significant change in the proportion between 2016, 2018 and 2019 (in which C. tropicalis represented approximately 13%, which fell to 7.04% in 2017). In addition, the comparison of the composition ratio of Candida over these four years also showed significant differences (χ2 = 33.344; P = 0.004). Additionally, the composition ratio of each kind of Candida was compared between these four years. Our results showed statistical significance only for C. albicans (χ2 = 12.620; P = 0.006) and C. tropicalis (χ2 = 20.410; P < 0.001), and the proportion of C. albicans exhibited a gradual decrease (χ2 = 4.558; P = 0.033) over these years. However, there were no differences in the detection over these years for C. glabrata, C. tropicalis, and Candida krusei (Additional file 1:Fig. S1).
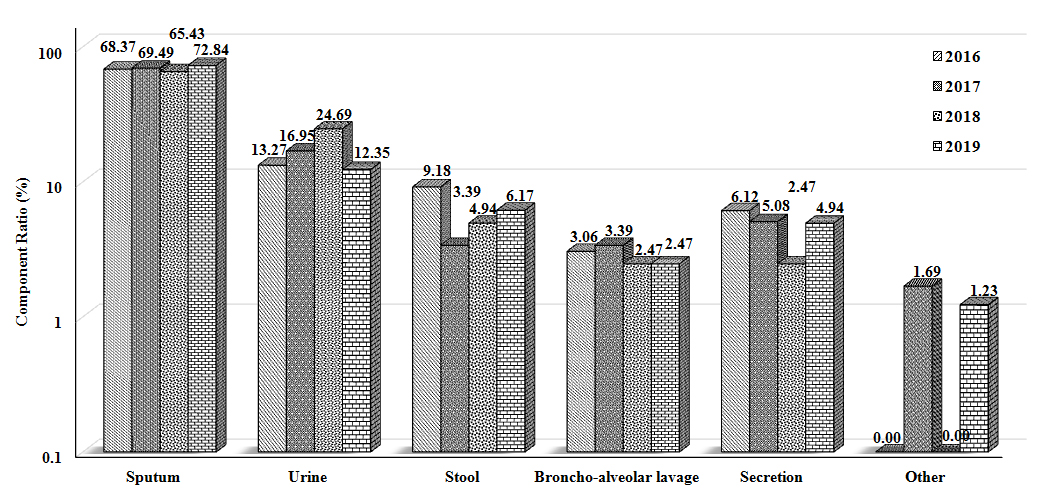
Sources of C. tropicalis samples
The C. tropicalis samples collected from 2016-2019 were classified according to the sample sources, and the composition ratios were also analyzed. Our results showed that significant differences were observed in the proportion of samples from which C. tropicalis was detected in each year (Q = 123.949 - 194.898; P < 0.001) (Fig. 2). Moreover, for each year, the most common source of samples was airway secretion (more than 65%), which was followed by mid-stream urine (12%-25%). Although there was no significant difference in the composition ratio of the source for C. tropicalis samples for these four years (χ2 = 14.858; P = 0.399), the proportion of urine samples detected with C. tropicalis was significantly different between these years (χ2 = 9.387; P = 0.025). Furthermore, our results from the trend test showed that, except for the proportion in the stool samples (χ2 = 3.550; P = 0.060), the proportions in the airway secretions and urine samples increased over the years, but the proportions decreased for the other sample types year by year (all P < 0.050) (Additional file 2:Fig. S2).
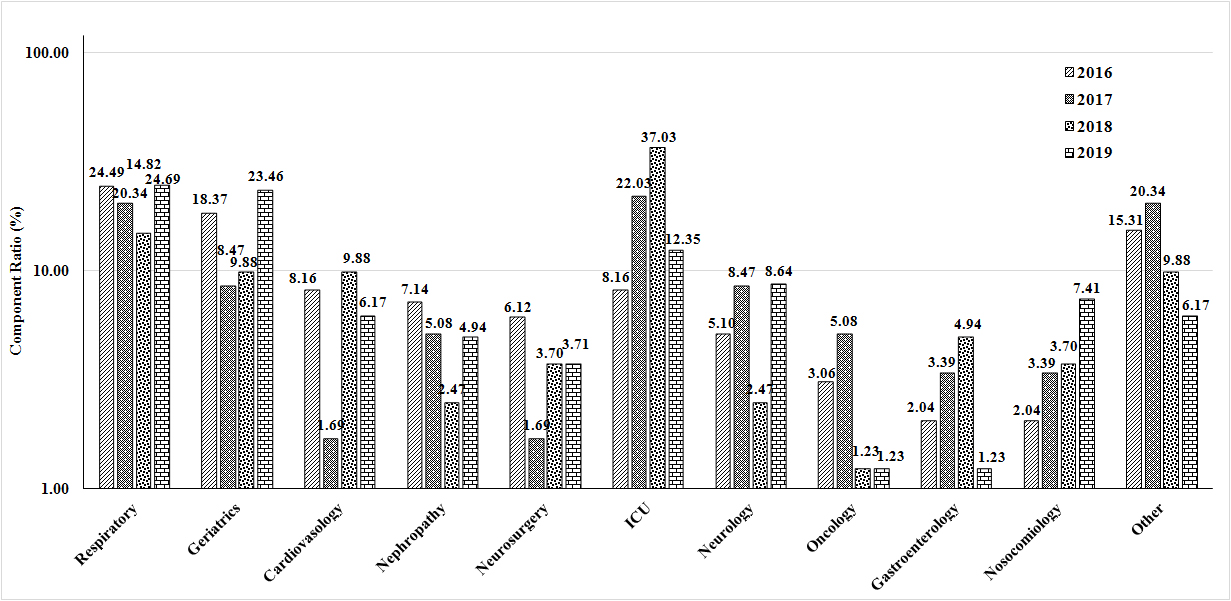
Department distribution of C. tropicalis
The department sources of C. tropicalis from 2016-2019 were analyzed. Our results showed that , there were significant differences in the distribution of C. tropicalis in these departments from 2016 to 2019 (Q = 40.746 - 92.691; all P < 0.001). The departments with relatively high detection rates included the Departments of Respiratory Medicine, ICU, and Geriatrics (Fig. 3). Moreover, among the proportions of C. tropicalis detected in different departments, the detection rates of C. tropicalis in the Department of Respiratory Medicine were greater than 20% in 2016, 2017 and 2019, and they fell to 14.82% in 2018. Furthermore, the amount of C. tropicalis detected in the ICU increased year by year, from 8.16% in 2016 to 37.03% in 2018, but it decreased to 12.35% in 2019. The proportions of C. tropicalis detected in the Department of Geriatrics were higher in 2016 (18.37%) and 2019 (23.46%) and lower in 2017 and 2018 (approximately 9%). The composition ratios of C. tropicalis detected in different departments between the four years suggested statistically significant differences (χ2 = 58.045; P = 0.002). However, in comparing the C. tropicalis amount detected in each department in each of the four years, statistically significant differences were observed in the amount of C. tropicalis in the Department of Geriatrics (χ2 = 8.623; P = 0.035) and the ICU (χ2 = 27.148; P < 0.001) (Additional file 3:Fig. S3).
Resistance of C. tropicalis to antifungal drugs
The resistance to azole antifungal agents such as fluconazole, itraconazole and voriconazole was analyzed in the samples of C. tropicalis collected from 2016 to 2019. Our results showed that C. tropicalis had high resistance rates to fluconazole, itraconazole, and voriconazole and even exhibited cross-resistance. In 2018, the resistance rate of C. tropicalis to fluconazole reached 39.2%, so there were most resistance fungus isolated in this year. There were no statistically significant differences in the resistance rates of C. tropicalis to azole antifungal drugs over these four years (χ2 = 1.156; P = 0.979).
Relative mRNA expression levels of ERG11 and UPC2 in C. tropicalis
To further study the resistance-related genes of C. tropicalis, the mRNA expression levels of ERG11 and UPC2 were detected with quantitative real-time PCR. Our results showed that the relative mRNA expression levels of ERG11 and UPC2 genes in C. tropicalis from the fluconazole-resistant group (27/30 strains fully resistant to fluconazole, itraconazole, and voriconazole) and fluconazole-sensitive group were normally distributed. Based on the independent samples t-tests, the relative mRNA expression level of ERG11 in the drug-resistant group was 1.579 ± 0.896, while the relative mRNA expression of ERG11 in the sensitive group was 0.483 ± 0.259, and the difference was statistically significant (t = 4.511; P <0.001) (Fig. 4A). On the other hand, the relative mRNA expression level of UPC2 in the resistant group was 1.400±0.919, while the relative mRNA expression level of UPC2 in the sensitive group was 0.448 ± 0.272, with a statistically significant difference (t = 3.970; P <0.001) (Fig. 4B). These results suggest that the resistance of C. tropicalis to fluconazole is related to the expression levels of ERG11 and UPC2.
Correlation analysis of UPC2 and ERG11 mRNA expression in C. tropicalis
The mRNA expression levels of resistance-related genes (i.e., ERG11 and UPC2) in C. tropicalis were detected, and the correlation between the gene expression levels was further analyzed. Our results from Spearman correlation analysis showed that there was no linear correlation between the expression levels of UPC2 and ERG11 in the sensitive group (r = - 0.074; P = 0.757) (Fig. 5A). However, the UPC2 and ERG11 expression levels were positively correlated in the drug-resistance group (r = 0.571; P = 0.001) (Fig. 5B). These results suggest that the overexpression of fluconazole-resistant ERG11 in C. tropicalis may be related to the regulation of UPC2.