One hundred microsecond time-resolved observations of internal molecular motions were successfully obtained using DXT for three variants of the SARS-CoV-2 spike protein: B.1.1.7 (green plot, alpha variant), B.1.617 (blue plot, delta variant), and B.1.1.529 (orange plot, omicron variant). Figure 2(a) shows the mean square displacement (MSD) curves in the θ and χ directions for the three spike variants. The MSD curve in the θ direction showed the largest slope for the omicron variant, followed by the delta variant, and the smallest slope for the alpha variant. However, the MSD curves in the χ direction showed that the motion widths of the alpha and delta variants were almost the same. The omicron variant showed the largest width of motion in the χ direction, similar to the MSD curves in the θ direction.
Figure 2(b) shows the molecular arrangement of the gold nanocrystals labelled with the SARS-CoV-2 spike trimer when the DXT data in Fig. 2(a) were obtained; since the θ and χ directions are part of the polar coordinate representation, a three-dimensional motion summation can be derived. In Fig. 2(c), the three-dimensional total internal motions of the three variants showed that the omicron variant had the highest motion, followed by the delta variant, and the alpha variant had slightly less motion than the delta variant. These results suggest the magnitude of this 3-D molecular internal motion as a new factor in discussing the relationship between the magnitude of the molecular motion and infectivity and the interaction between the virus and the cell.
As shown in Fig. 3(a), the internal motions of the three variants of ACE2 binding to the SARS-CoV-2 spike protein were measured by DXT under the same conditions as the ACE2-free spike variants (Fig. 2(a)). In the MSD curves in the θ direction, B.1.1.7 (green plots, alpha variant) and B.1.617 (blue plots, delta variant) were found to have almost the same mobility. On the other hand, B.1.1.529 (orange plot, omicron variant) had slightly higher motion in the θ direction than the others. The MSD curves in the χ direction also showed that the omicron variant had the widest range of motion among the three variants, followed by the delta and alpha variants.
Figure 3(b) shows the molecular arrangement of the SARS-CoV-2 spike trimer binding to ACE2 labelled with gold nanocrystals when the DXT data in Fig. 3(a) were obtained. As shown in Fig. 3(c), the three-dimensional total internal motions of the three variants showed that the omicron variant had the highest binding to ACE2, followed by the delta variant and the alpha variant. The results suggest that the magnitude of the 3-D internal motion spike variants when binding to ACE2 is more useful as a new factor, since the data on the proteins bound to ACE2 shows higher sensitivity than the data on proteins not bound to ACE2.
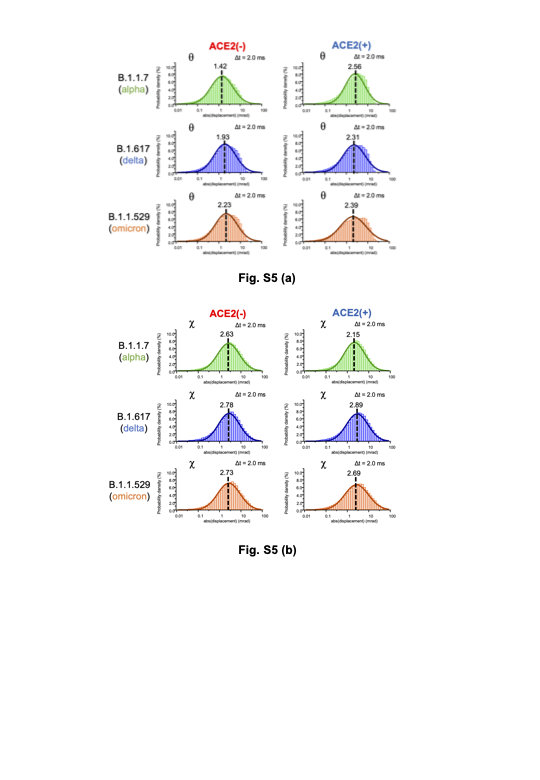
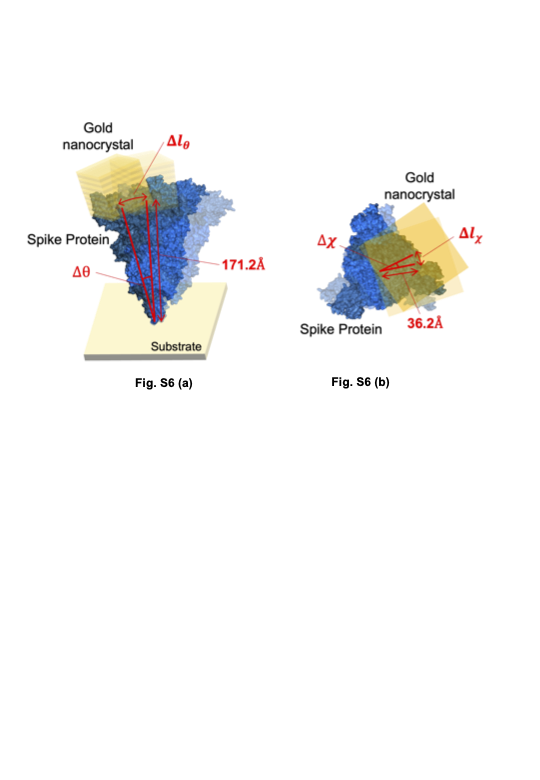
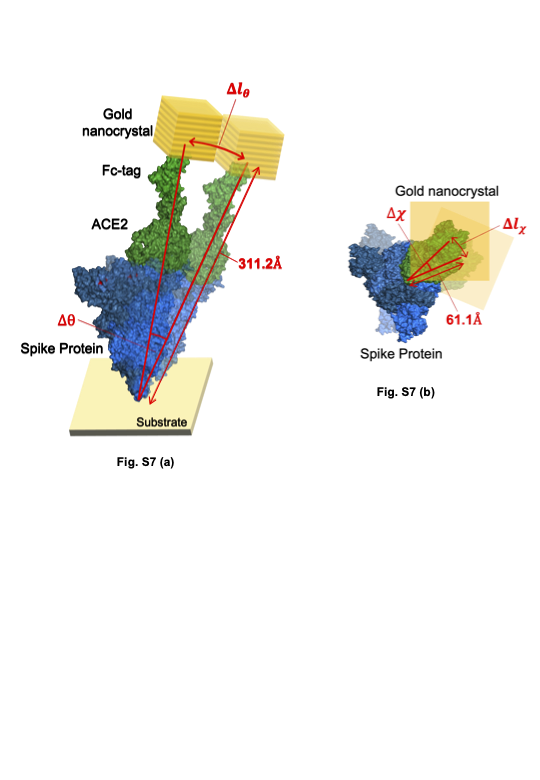
Figure 4 shows the 2D histogram maps of internal molecular motions on three variants and those binding to ACE224. In each 2D map, the vertical axis is the common logarithm of the angular distance in the θ direction, the common logarithm of the horizontal axis is the one in the χ directions33, and the 2D maps indicate the internal molecular motions in terms of probability density. One-dimensional histograms for each direction of the 2D maps and a schematic view of the moving range of the spike protein without ACE2 and with ACE2 are shown in Fig. S5, Fig. S6 and Fig. S7. The three 2D maps in the top row indicate internal molecular motions of B.1.1.7 (alpha variant). The left and centre 2D maps show the internal motion of the alpha variant with and without binding to ACE2, respectively. The right 2D map indicates the difference between the probability density of the left 2D map and the centre 2D map24. The right map shows that the distributions are separated in the red and blue areas, and polynomial fitting was performed on the distributions. The red part of the distribution of the alpha variant is near the centre, and the blue part of the distribution of the alpha variant bound to ACE2 is in the upper left. The internal molecular motion of the alpha variant is higher than that of the alpha variant bound to ACE2 in the χ direction. On the other hand, the internal motion is lower than that of the same molecule bound to ACE2 in the θ direction.
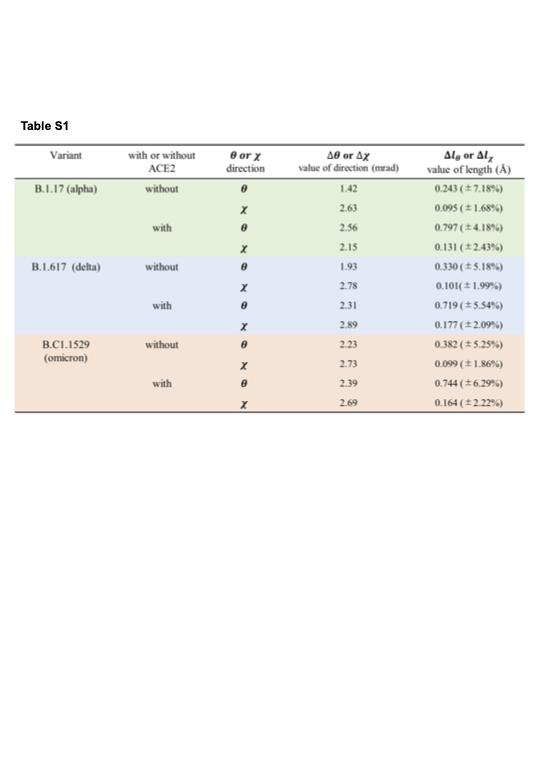
Next, the three 2D maps in the middle and bottom rows indicate the internal molecular motions of B.1.617 (delta variant) and B.1.1.529 (omicron variant), respectively. As with the alpha variant, the left and centre 2D maps show the internal motion of the delta and omicron variants when unbound and when bound to ACE2, respectively. The right 2D map of the delta variant indicates the difference between the left and middle 2D maps, showing that the red part of the distribution of the delta variant is near the centre, and the blue part of the distribution of the delta variant bound to ACE2 is in the upper right. In contrast, the right 2D map of the omicron variant shows that the red part of the distribution of the omicron variant near the centre divides the blue part of the distribution of the omicron variant. Table S1 shows how the spike variants without ACE2 and with ACE2 move. The results suggest that there is no significant difference in the internal molecular motions of the three variants before ACE2 binds with the spike protein, and when ACE2 binds to the spike, each variant has different motions.
The main advantage of DXT is that the twisting (χ) direction of motion can be determined with high precision. In this study, anticlockwise and clockwise rotation are defined as positive and negative χ rotational motions34, respectively, when the spike protein immobilized on the polyimide substrate is viewed from above. Another DXT measurement axis θ cannot be implied in the direction of motion, such as the χ axis, as also explained in Fig. 1(e), and only the magnitude of motion can be discussed.
Figure 5(a) shows the 2D histogram maps of internal molecular motions in the positive and negative directions for three variants immobilized on a polyimide substrate and labelled with gold nanocrystals. The sets of three 2D maps in the top, middle, and bottom rows indicate the probability density of internal molecular motions for B.1.1.7 (alpha variant), B.1.617 (delta variant) and B.1.1.529 (omicron variant). In addition, the left column of the 2D maps indicates the internal motions in the positive χ direction, and the centre column indicates the internal motions in the negative χ. The right column of the 2D maps (Fig. 5(b)) indicates the difference between the probability density of the left 2D map and the middle 2D map. The right 2D maps of the alpha variant show that the blue part of the distribution of the negative direction is slightly to the right of the red part of the distribution of the positive direction. The right 2D maps of delta variants show that the blue part of the distribution of the negative direction and the red part of the distribution of the positive direction are vertically divided in the centre. The blue part of the distribution is to the right of the red part of the distribution. For the omicron variants, while the red and blue parts of the distributions are vertically divided in the centre, as in the case of the delta variants, the blue distribution is to the left of the red distribution.
Figure 5(c) represents only the information in the χ direction in Fig. 5(a). The histograms show internal molecular motions of three variants in the positive and negative χ directions with Gaussian fitting. In each variant, the upper half histogram is in the positive χ direction, and the lower half histogram is in the negative χ direction. Figure 5(c) shows that the omicron variants have the largest location of the Gaussian peak top between the positive and negative directions, followed by delta and alpha.
Figure 6(a) shows the 2D histogram maps, as in Fig. 5(a). These 2D maps indicate the probability density of the molecular internal motions of spike variants with ACE2. The right column of the 2D map (Fig. 6(b)) is the difference histogram of the two left columns. It appears to be divided because the motion distributions in the positive and negative χ rotation directions are clearly different. The 2D difference histograms in alpha and delta variants shown in the right column appear to be divided vertically by a certain magnitude of motion in the θ direction. In the alpha variant, the distribution in the positive direction is located on the upper side, and the distribution in the negative direction is located on the lower side. On the other hand, in the delta variant, one of the positive directions is located on the lower side, and one of the negative directions is located on the upper side. This difference histogram between alpha and delta variants indicates that in the χ direction, the magnitude of the motion in the θ direction differs depending on the direction of χ rotation.
In the omicron variant, focusing on the χ motion direction, we find a completely different motion distribution from those of the alpha and delta variants. The internal molecular motion distributions in the positive and negative χ motion directions are divided by the magnitude of a certain χ rotational motion, with the distribution in the positive rotational direction being to the right of the distribution in the negative rotational direction. In other words, only the omicron variant showed that the size of rotational motion in the negative χ direction was clearly smaller than that in the positive direction.
Figure 6(c) shows histograms of the molecular internal motions of spike variants binding to ACE2 in the positive and negative χ directions with Gaussian fitting, as shown in Fig. 5(c). The locations of the Gaussian peak top in the positive direction are larger than those in the negative directions.
As described above, we were able to clarify the presence of variant-dependent intramolecular motion by using DXT to measure the intramolecular motion of spike proteins and spike proteins binding to ACE2 at high speed and with high precision. We were also able to show the possibility that even simple MSD curves can be used to discuss the relationship between the infectivity of the variant species.