Primary bone marrow MSCs cultures
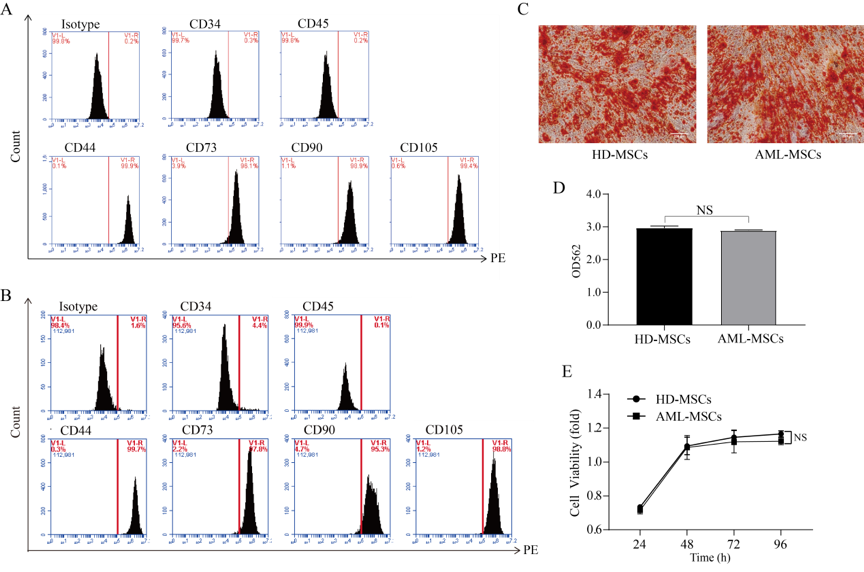
In the current study, bone marrow specimens of AML-MSCs were obtained from the hematology department of Fujian Medical University Union Hospital. The collection of the bone marrow specimens was approved by the hospital’s ethics review board, and obtained using an informed written consent process. Mononuclear cells (MNC) were isolated using a Ficoll-Hypaque Density Centrifugation Method. Then, the MNC were seeded in low-glucose Dulbecco's Modified Eagle Medium (LG-DMEM, Hyclone), supplemented with 20% Fetal Bovine Serum (FBS, Gibco) and 1% Penicillin-Streptomycin (Hyclone). The cells were plated in 100 mm2 culture dishes at a density of 106 cells/ml and incubated at 37°C with 5% CO2. Then, following a culturing period of one week, the non-adherent cells were removed, adherent MSCs were passaged with a confluence of 80 to 90%, and the cells were expanded to passage (P) four. The bone marrow specimens of HD-MSCs were purchased from the Cyagen Biosciences Company. The cultured MSCs were identified as CD34-/CD44+/CD45-/CD73+/CD90+/CD105+, whose positive rates were all greater than 95%. In addition, the MSCs differentiations into osteocytes and adipocytes were conducted and had demonstrated multidirectional differentiation potential.
MSC differentiations
The MSCs were cultured in advance with 2 x 10⁵ cells/well in six-well plates with 0.1% gelatin. Then, when the cultured cell fusion degree reached between 60% and 70%, the cells were carefully sucked out in order the complete the culture medium, and 2 ml of osteogenic differentiation culture medium were added. The induced differentiation was stained on the 21st day [19, 20].
During the process of the MSCs culturing with 2 x 10⁵ cells/well in six-well plates, the solution was changed every three days until the cell fusion reaches 100% or over fusion occurred. Then, the cell complete culture medium was carefully sucked out, and 2 ml of adipogenic differentiation medium A were added to the six-well plates. After a period of three days, Solution A was sucked out and 2 ml of differentiation medium solution B were added. Then, after 24 hours, Solution B was replaced with Solution A. The aforementioned steps were alternately repeated 3 to 5 times (12 to 20 days). The cultures with Solution B were maintained for three days until the lipid drops became large and round enough for the subsequent experiments. During the maintenance of Solution B, fresh Solution B was used every three days. Then, the specimens were stained using oil red O [20, 21].
Alizarin red staining and oil red O staining methods
For the alizarin red staining (ARS) conducted in this study, the cells were fixed after a 21-day period of induction of osteogenic differentiation using 4% paraformaldehyde for fifteen minutes. The cells were then stained with 1% ARS (pH 4.2, Sigma-Aldrich) for five minutes. Then, the staining solution was dissolved with a 10% cetylpyridinium chloride solution and quantified using an enzyme-labeled instrument (Thermo Fisher Scientific) at 562 nm.
In regard to this study’s oil red O staining process, after a 14-day period of induction of adipogenic differentiation, the cells were subjected to oil red O staining (Sigma). During the process, the cells were first fixed with 4% paraformaldehyde for thirty minutes, and then stained with an oil red O staining working solution (saturated oil red O and distilled water at a ratio of 3:2) for ten minutes. The lipid drops were shown as bright red under microscopy. Following the observational process, the staining solutions were dissolved with isopropanol and quantified using an enzyme-labeled instrument (Thermo Fisher Scientific) at 450 nm.
Quantifications of the global m6A levels
The global m6A levels of the total RNA were measured using an EpiQuik m6A RNA Methylation Quantification Kit (Colorimetric) (Epigentek) [22], following the manufacturer’s protocol. In this study, 200 ng of poly-A-purified RNA were used for each sample analysis process. The m6A levels were quantified using a colorimetric method, and the absorbance of each well at a wavelength of 450 nm was measured. The calculations were completed in accordance with the standard curve reflected by the m6A levels [23]. In addition, in order to ensure the accuracy of the results, each sample was run in triplicate.
Analysis results of the RNA isolations and quantitative reverse transcription polymerase chain reactions (RT-qPCR)
In the current study, the total RNAs were extracted from the HD-MSCs and AML-MSCs using a Trizol reagent (Invitrogen, Carlsbad, CA), during which the operational instructions were strictly followed. The purity levels and concentrations were measured using a NanoDrop 2000 spectrometer (Thermo Fisher Scientific, Waltham, MA). The analyses of the reverse transcription reactions were carried out using a cDNA synthesis kit (Roche, Mannheim, Germany). Furthermore, quantitative real-time PCR was performed according to the manufacturer’s instructions, utilizing ABI 7500 Real-Time System (Life Technologies) and SYBR Green Fluorescence (Roche, Mannheim, Germany) instruments. The qPCR reaction components comprised 1 μl of cDNA (with a 2.5-fold dilution); 5 μl of thunderbird SYBR Green qPCR mix; 0.3 μl of PCR primers; and 3.4 μl of RNase-free water. Next, the following protocol was undertaken: 95℃ for 1 minute, and 35 cycles of 95℃ for 15 seconds, 60℃ for 30 seconds, and 72℃ for 30 seconds, respectively. For the in-vitro experiments, the relative expressions were analyzed using a 2–ΔΔCt method. Also, in regard to the clinical data, the relative expressions were analyzed using a 2–ΔCt method and the GAPDH were used as references [24]. The primers used are listed in Table 1, and each sample was run in triplicate.
Western Blotting Results
The MSCs were collected to extract the proteins and the protein concentrations were determined using a BSA method. The denatured proteins were loaded and separated by 10% SDS-PAGE and transferred to polyvinylidene fluoride membranes. The membranes were blocked with 5% no-fat milk (Bio-rad) and then incubated with primary and secondary antibodies. The Western Blotting substrates were detected using an immuno-blotting process with Pierce ECL (Thermo Fisher Scientific). The antibodies used for the Western Blotting were as follows: METTL3 (86132, Cell Signaling Technology); AKT (12319, Cell Signaling Technology); p-AKT (13987, Cell Signaling Technology); and GAPDH (2118, Cell Signaling Technology), among which the GAPDH were used as references.
Plasmid construction processes
The wild-type METTL3-CDS were PCR-amplified from the HD-MSCs cDNA using the primers described in Table 1. The PCR products were purified and then cloned into modified pLJM1-EGFP (#19319, Addgene) lentiviral vectors. The sequences of the shRNAs targeting human METTL3 were shRNA #9 and shRNA #12, and the control scramble shRNA (Addgene #1864) were purchased from Addgene [16].
Virus preparation and infection processes
The recombinant lentivirus plasmids were extracted using an Endotoxin-free Plasmid Extraction Kit (QIAGEN) and co-transfected into 293 T cells with lentivirus packaging plasmids (psPAX2 and pMD2.G) for virus particles. Then, the virus particles were tested at 48 and 72 hours after transfection and concentrated with titer≥1×10⁸ TU/ml. Subsequently, the virus was added to the MSCs and purinomycin for three days. Finally, the genomic DNA was extracted for verification purposes.
RNA sequencing and data analyses of the MSCs
RNA samples were extracted, and the concentrations were measured using NanoDrop 2000. Then, 1 to 2 ug of the total RNA from each sample were selected for the purpose of constructing an RNA sequencing library. The specific process was as follows: 1. Total RNA samples which were enriched in oligo dT (without rRNA) were selected; 2. The samples were constructed using a KAPA Stranded RNA Sequencing Library Prep Kit (Illumina); 3. During the library construction processes, double-strand cDNA was synthesized and combined with the subsequent high-fidelity PCR polymerase using a dUTP method, resulting in the RNA sequencing library having chain specificity; 4. The constructed library was identified using an Alient 2100 Bioanalyzer and quantified by qPCR; 5. The mixed sample libraries were sequenced using Illumina X-ten/NovaSeq.
The image processing and base recognition were carried out in this study by adopting the software of Solexa Pipeline Version 1.8. In addition, FastQ software was utilized to evaluate the sequencing quality of the reads (using Cutsapt to remove 3' and 5' splices). Then, R software Balltown [25, 26] was used to calculate the FPKM (fragments per kilobase of gene/transcription model per million mapped fragments) at the transcriptional level, as well as calculate and screen the differentially expressed genes. The threshold was set to a 1.5-fold change, p-value ≤ 0.05, and mean value of the FPKM in the group ≥ 0.5, in order to screen the differentially expressed genes. Finally, the results of the GO (gene ontology) functional significance enrichment analysis processes, as well as the results of the KEGG (Kyoto Encyclopedia of genes and genomes) pathway significance enrichment analysis processes, were further analyzed in this study.
Microarray hybridization and data analysis results
The immuno-precipitated RNA samples from the HD-MSCs and AML-MSCs were labeled with Cy5 fluorescent dye using a Super RNA Labeling Kit (Arraystar), and then purified using an RNeasy Mini Kit. The Cy5 labeled cRNAs were fragmented and hybridized to human mRNA and lncRNA m6A epitranscriptomic microarray (8 × 60 K, Arraystar), which contained 44,122 mRNAs and 12,496 lncRNAs degenerate probes. The hybridized arrays were scanned using an Agilent Scanner G2505C [27].
This study utilized Agilent feature extraction software (Version 11.0.1.1), and each spot on a microarray was evaluated and flagged as present, absent, or marginal, based on its uniformity above the background and saturation levels. The raw intensities of the immuno-precipitated RNAs were normalized with an average of log2-scaled spike-in RNA intensities, and the fold changes and P values were calculated for each transcript between the HD-MSCs and the AML-MSCs. A cutoff of 5-fold (P < 0.05) was used to identify the differentially m6A methylated RNAs. At that point in the experiment, both GO analysis and KEGG Pathway analysis were performed for the differentially m6A methylated mRNA transcripts using the DAVID (Database for Annotation, Visualization, and Integrated Discovery) bioinformatics database [28].
SRAMP database
SRAMP (which is based on RNA adenosine methylation site predictions) is a sequence-based m6A modification site predictor [29]. It has been found that SRAMP can be a useful tool for predicting m6A modification sites on RNA sequences of interest. It was required to input the full-length RNA sequence of the AKT into the prediction website in order to predict the m6A modification site on the sequence according to the specific m6A modification sequence.
Statistical analysis results
In this study, the experiments were repeated three times for all of the examined specimens. Statistical analysis was performed using GraphPad Prism8.0 software, and the obtained statistical differences between the groups were determined using a Student’s t test. In the current study, P-values < 0.05 were considered to be statistically significant.
