Mutation landscape and survival-related CRGs in urothelial carcinoma
19 genes that functioned closely with cuproptosis were included in our study (Table S1). Firstly, we explored the expression difference of 19 CRGs between tumor and normal samples from the TCGA cohort, which is illustrated in the boxplot (Fig. 1A). Compared to the normal tissues, we demonstrated significantly higher expression of SLC31A1, LIPT2, CDKN2A, and GCSH in tumors. Adversely, the expression of NFE2L2, NLRP3, ATP7A, DLD, MTF1, and DLT was significantly decreased in tumors. Overall mutation landscape displayed a relatively high mutation frequency of cuproptosis genes in urothelial carcinoma. Among 414 TCGA-BLCA samples, 97 (23.43%) had a cuproptosis-gene mutation (Fig. 1B). We detected 12 mutated genes with different frequencies and mutation types. Specifically, NFE2L2 showed the highest mutation frequency (7%), followed by CDKN2A (6%), NLRP3 (3%), ATP7B, MTF1, DLD (2%), and ATP7A, DLAT, LIAS, PDHA1, DBT, GLS (1%). Afterward, we calculated the CNV (copy number variations) of all cuproptosis genes and found that copy number alterations commonly occurred among them (Fig. 1C). There were significant CNV gain in LIPT2 and loss in CDKN2A, ATP7B, and PDHB. In addition, we displayed the location of 19 CRGs on chromosomes along with their CNV status (Fig. 1D).
Cuproptosis subtype identification in UC
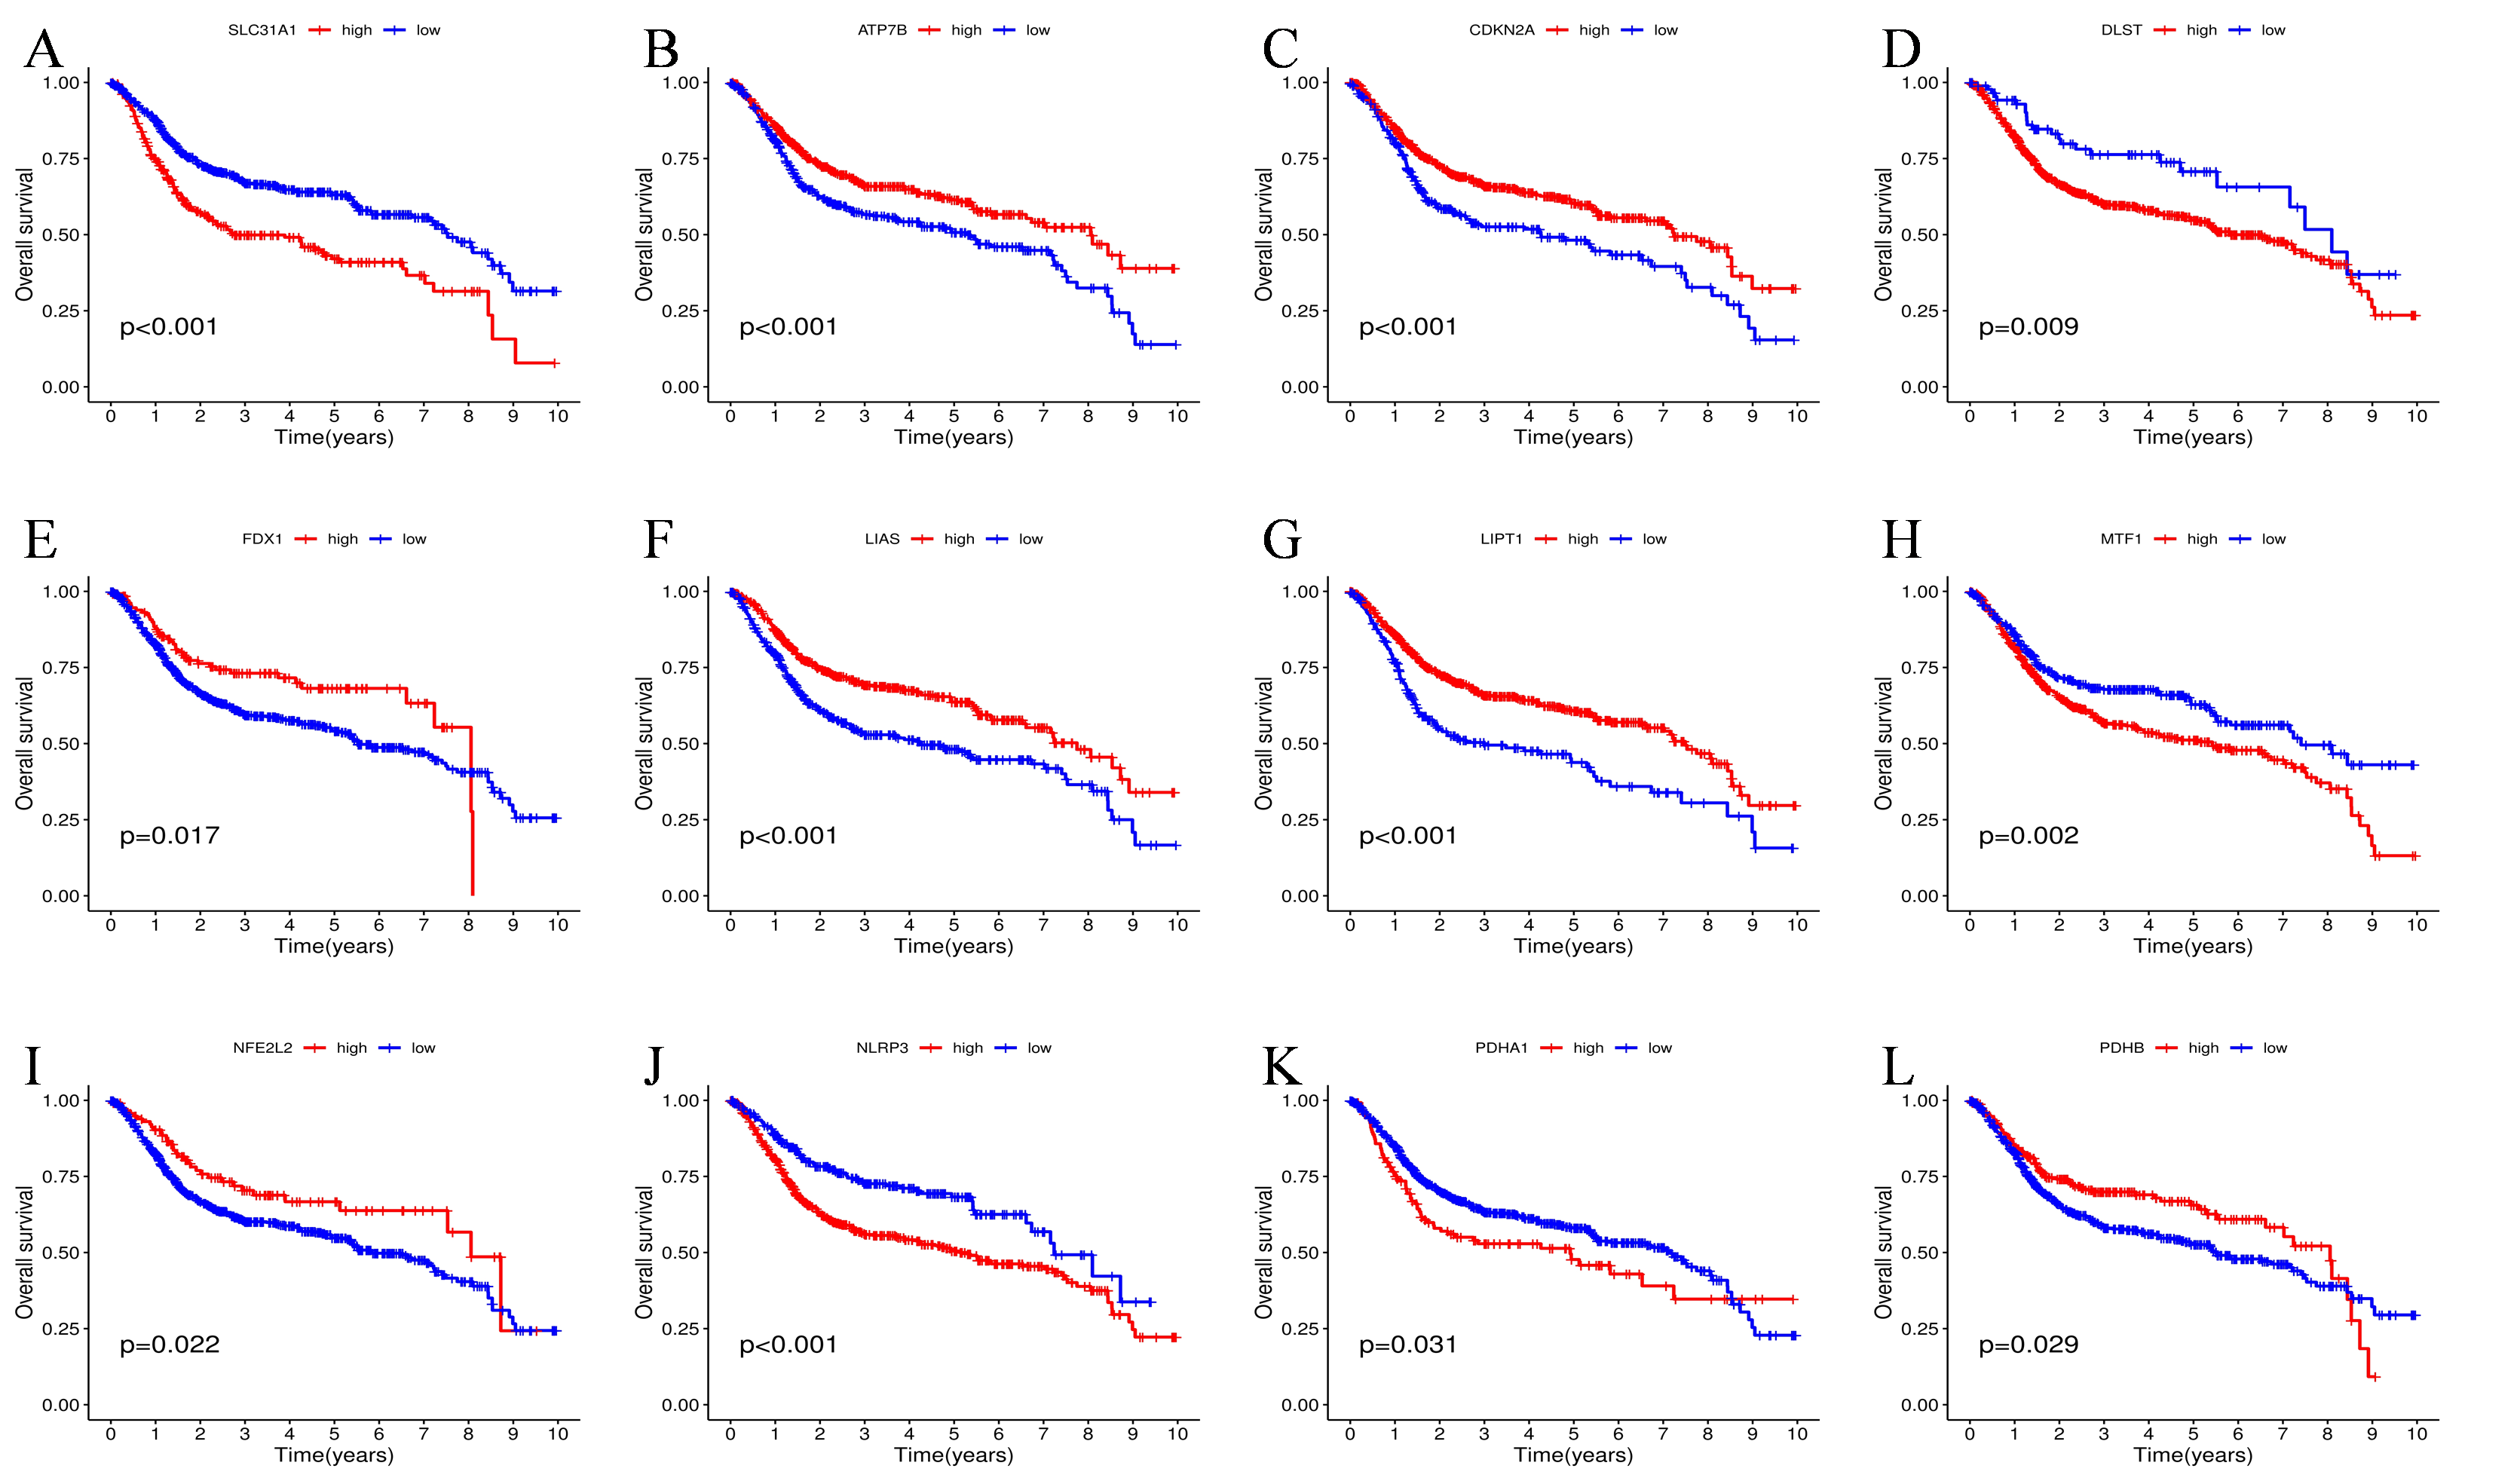
17 CRGs were found to have potential prognostic significance with UC patients after univariate cox regression analysis. To better understand the association mechanism behind these 17 prognostic CRGs, we drown a regulatory network to display their interactive relationship and predicted properties in UC patients (Fig. 2A). Interestingly, NLRP3, as a risk factor, was negatively related to several favorable factors, such as ATP7A, LIAS, LIPT1, and NFE2L2. Next, according to the optimal cutoff values of prognostic cuproptosis genes calculated by Kaplan-Meier (KM) survival analysis, patients from all three datasets were classified into high-risk and low-risk expression level groups, respectively. As a result, for PDHA1, SLC31A1, NLRP3, MTF1, and DLST, high expression was linked to worse overall survival (OS). While for LIPT1, ATP7B, CDKN2A, PDHB, NFE2L2, FDX1, and LIAS, high expression was found to be related to longer OS (Figure S1).
To further elucidate the underlying functional pattern and clinical effect of these prognostic-related cuproptosis genes, we conducted an unsupervised cluster analysis per the expression levels of the abovementioned 17 CRGs. We found that when the k value = 3, the subgroups were well separated during the calculation process, showing distinct disparity and clustering stability (Fig. 2B). As a result, a sum of 972 UC patients from TCGA and three GEO cohorts were categorized into cluster A (n = 418), cluster B (n = 233), and cluster C (n = 321). Besides, PCA analysis demonstrated clear discrimination between three clusters per the expression level of CRGs (Fig. 2F). TME analysis of 23 immune cells also revealed a dramatically different landscape of immune infiltration between three clusters (Fig. 2E). Specifically, cluster C exhibited a remarkably higher degree of immune infiltration, especially effector cells, comprising Activated CD8 cells, Natural killer T cells, Activated CD4 T cells, and Macrophage. Surprisingly, Regulatory T cells also exhibited a high infiltration level in cluster C, which has been shown to play an immune-suppressor role. As shown in the heatmap, we also compared differences in CRGs expression level and clinical features among three clusters, such as the T and N stages (Fig. 2D). GSVA analysis revealed the differences in biological behaviors between distinct clusters. As is illustrated in Fig. 2G-2I, cluster B is subjected to enrichment in drug and lipid metabolism processes, like the arachidonic acid metabolism pathway and the linoleic acid metabolism pathway. While CRG cluster C shows significant enrichment in immune-related KEGG terms, including natural killer cell, mediated cytotoxicity, T cell receptor signaling pathway, chemokine signaling pathway, TOLL-like receptor signaling pathways, NOD-like receptor signaling pathway, and pancreatic cancer pathway, together with cell cycle pathways such as oocyte meiosis, progesterone mediated oocyte maturation, and cell cycle pathway. Further survival analysis showed that cluster B cohorts showed the best overall survival among the three groups while cluster C showed the worst (Fig. 2C, P ༜ 0.001).
Generation of cuproptosis gene clusters in UC
Based on the R package “limma”, we conducted differential expressed gene analysis among these three clusters and identified 185 DEGs (Fig. 3A and Table S2). Next, these DEGs were utilized to perform functional analysis. On the one hand, GO analysis illustrated that DEGs were subjected to remarkable enrichment in biological processes of leukocyte chemotaxis, leukocyte migration, extracellular matrix organization, external encapsulating structure organization, and extracellular structure organization, as well as the molecular function of chemokine receptor binding, chemokine activity, and MHC class II receptor activity, which are related with recruiting immune cells and shaping tumor immune microenvironment (Fig. 3B). On the other hand, KEGG analysis showed that DEGs were subjected to enrichment in pathways of inflammatory responses and autoimmune diseases, such as ECM − receptor interaction, IL − 17 signaling pathway, systemic lupus erythematosus, rheumatoid arthritis, and asthma, indicating a strong relationship with immune microenvironment (Fig. 3C).
Next, we performed univariate cox regression again to ascertain the DEGs that significantly correlated with patients’ survival, and 164 prognosis-related genes were determined for further analysis with a P value < 0.05. Then, to discover the potential regulatory mechanisms of these prognostic DEGs, we clustered all patients from three cohorts into gene cluster A (460), gene cluster B (291), and gene cluster C (221) in an unsupervised manner as in the previous work (k = 3, Fig. 3D). Patients in cluster C cohorts fared the worst outcome, as seen by the Kaplan-Meier survival curve (Fig. 3E, p < 0.001), whereas those in cluster B cohorts fared the best. As per the DEGs’ expression levels, the heatmap displayed a distinct distribution of DEGs between three clusters, together with other variables including CRG clusters, gender, age, N stage, and T stage (Fig. 3G). Also, we found that patients with tumor stage N0 mainly concentrated in gene clusters A and B, indicating better survival. The boxplot illustrated that the expression levels of most cuproptosis genes were substantially different among the three groups, except DLD and DLAT (Fig. 3F).
Construction and validation of a predictive scoring model in UC
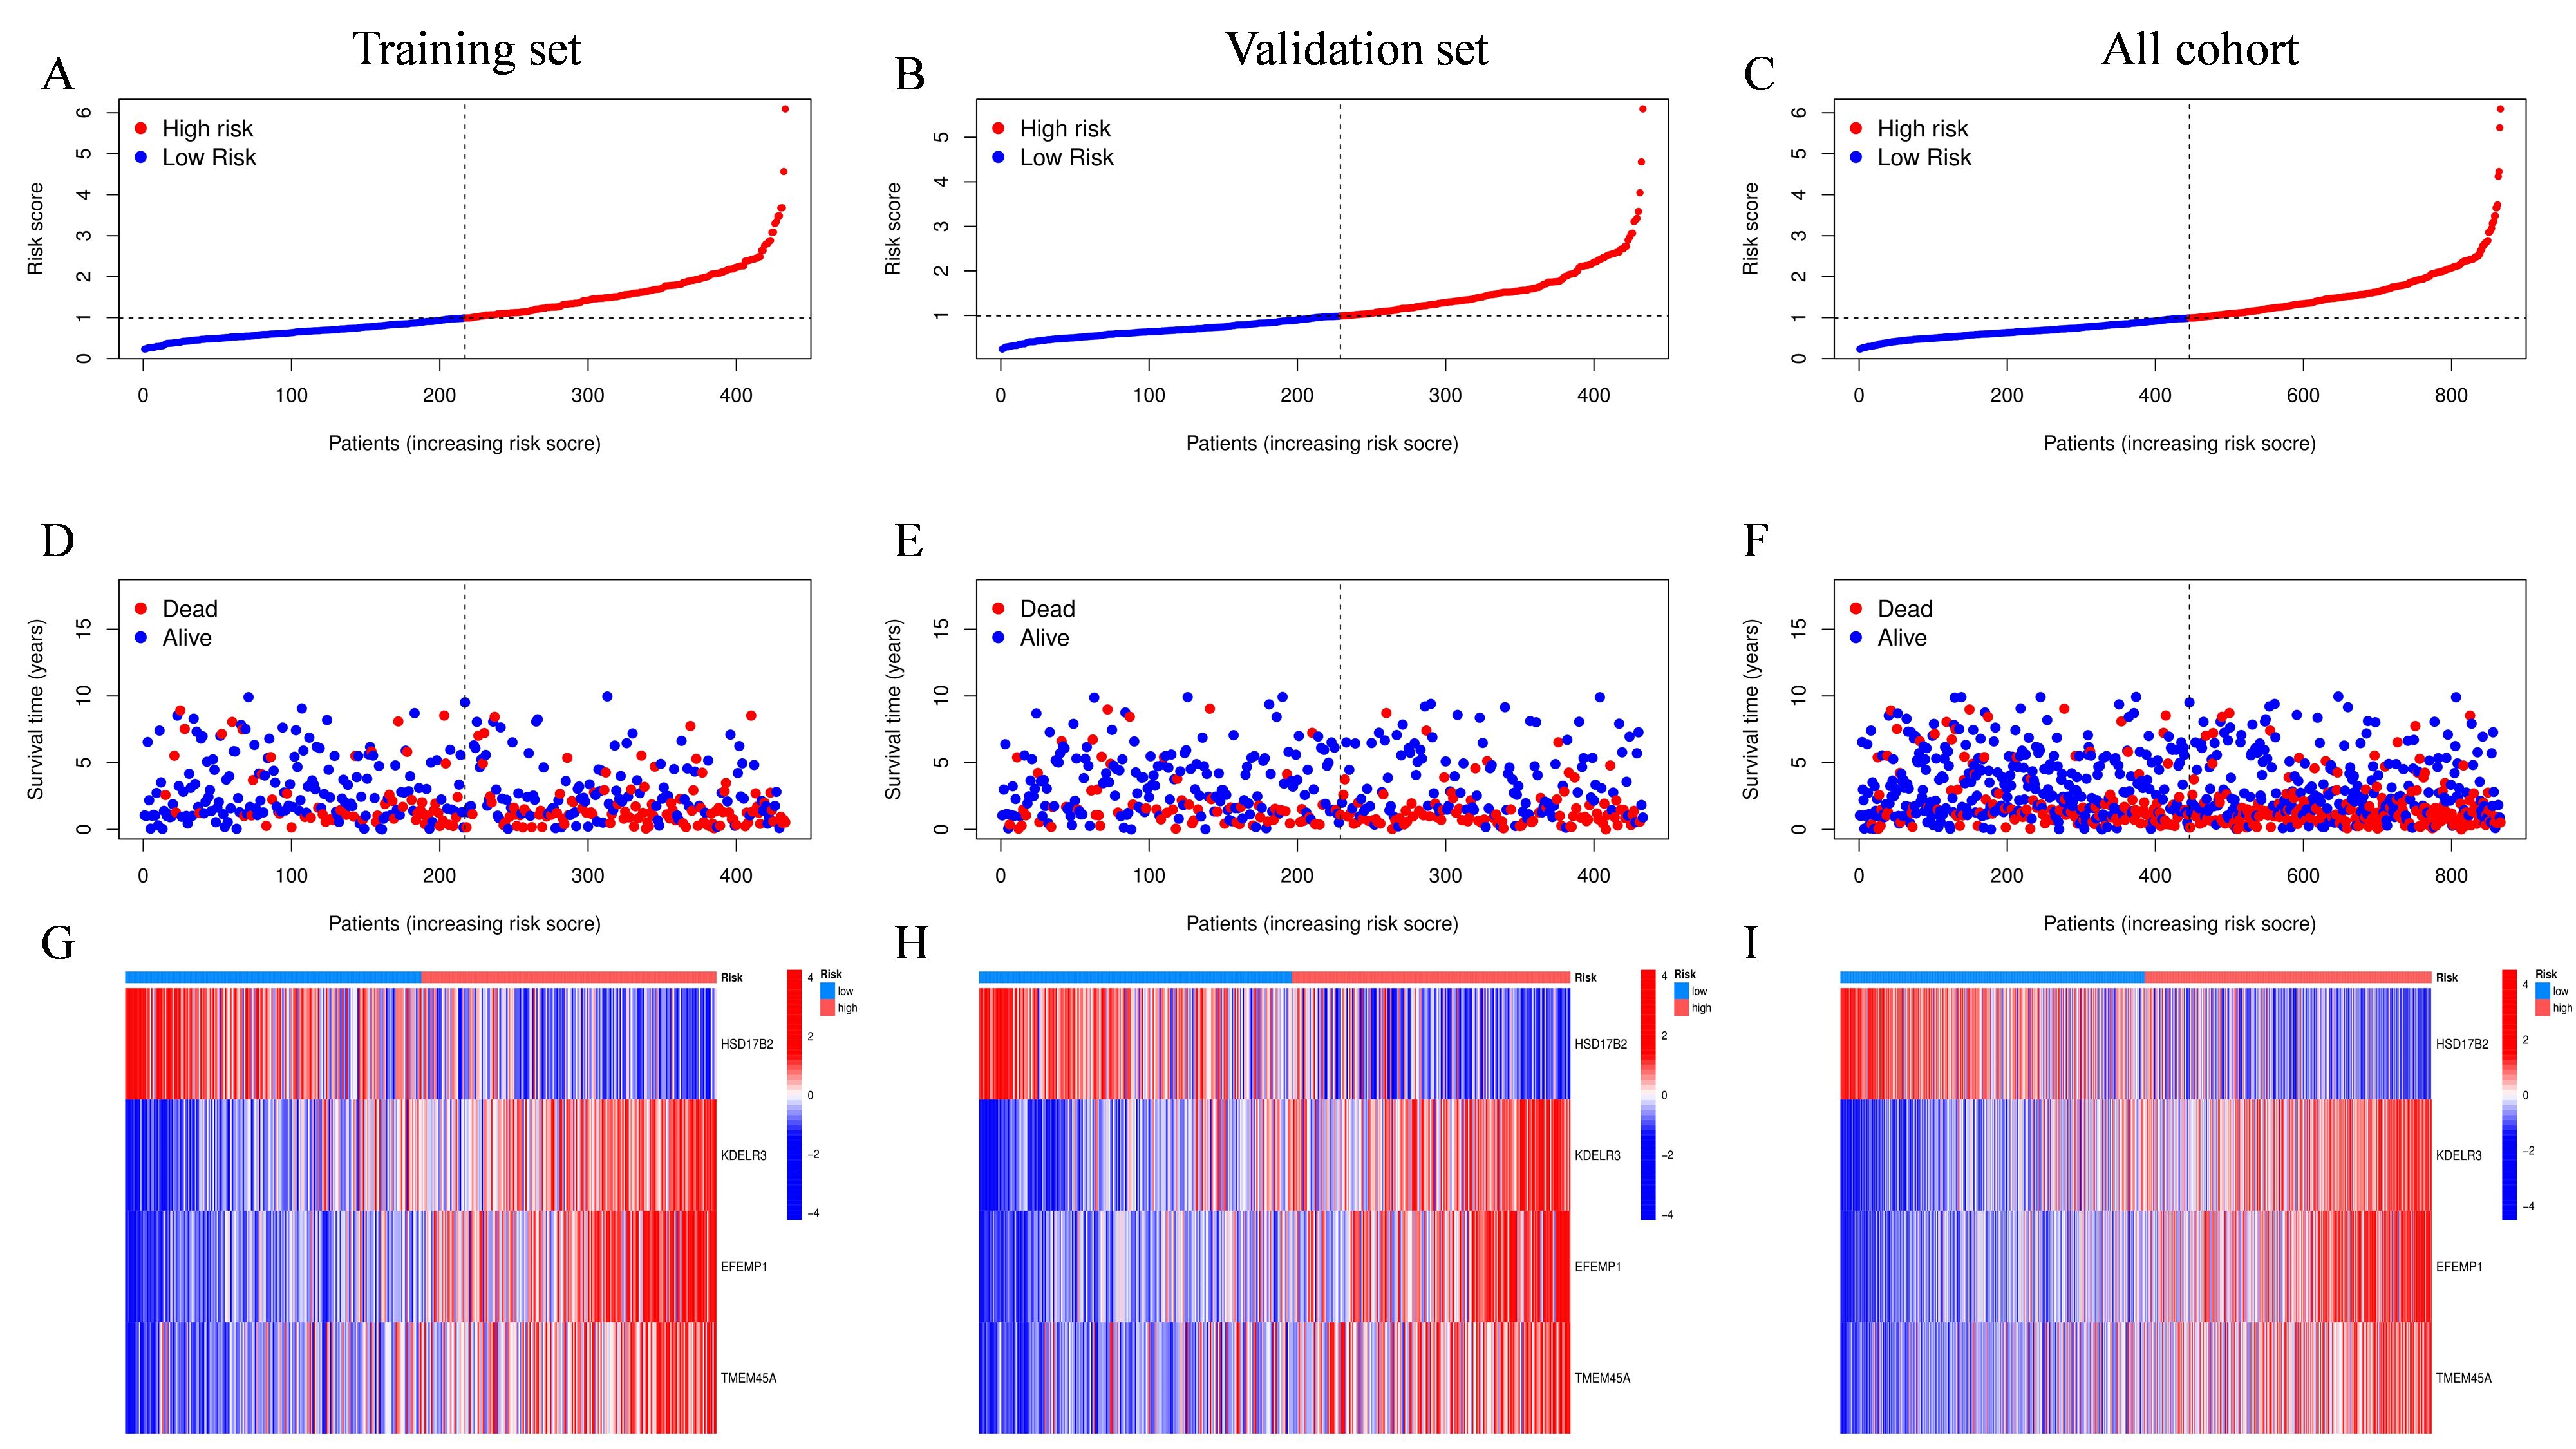
Considering the above analysis was based on population and the heterogeneity of the individual sample, we developed a scoring system to anticipate the prognosis of each UC patient using the LASSO method based on prognosis-related DEGs (Fig. 4A-B). To determine the model's accuracy, samples were divided randomly into validation and training sets. Finally, we obtained a scoring model that quantifies each individual’s CRG risk effects, holding all other independent factors constant. The model containing four CRGs and the risk score formula was obtained as follows: CRG risk score = (-0.0887 * expression of HSD17B2) + (0.2014 * expression of KDELR3) + (0.1125* expression of EFEMP1) + (0.1118 * expression of TMEM45A). In conformity with the median value of the CRG risk score, all UC patients were then divided into low-risk and high-risk categories. Additionally, it was revealed that there was a statistically significant difference in the CRG risk score across three CRG-cluster and gene-cluster groups (Fig. 4D-E, p < 2.22 * e16). Besides, consistent with what we had illustrated in the former survival analysis, CRG-cluster B and gene-cluster B showed the lowest risk scores, and CRG-cluster C and gene-cluster C possessed the highest risk score, respectively. Besides, the expression levels of many cuproptosis genes were significantly different between the aforementioned two risk groups (Fig. 4F). Kaplan-Meier survival analysis demonstrated that patients with higher risk scores displayed poorer prognosis in training and all cohorts, as well as the test cohorts (Fig. 4G-I, p < 0.001). Subsequently, the AUC values for one-year, three-year, and five-year OS were 0.687, 0.709, and 0.722 in the training cohort, respectively (Fig. 4J). Also, the results were similar in all-patient and training sets, indicating the potential predictive value of the score model for both long-term and short-term follow-up (Fig. 4K-L). Overall, the distribution plot suggested that the OS of UC declined with elevated CRG risk score and the high-risk group showed higher expression of KDELR3, EFEMP1, and TMEM45A in training, validation, and whole-patient sets, respectively (Figure S2). Finally, the alluvial diagram depicted the overall correlations of cluster assignments between risk groups and survival status and we found most individuals in the low-risk group were surviving and a large proportion of dead patients came from the high-risk group (Fig. 4C).
Development and assessment of the nomogram based on CRG risk score
An individualized score nomogram was developed to make a prediction of the 1-, 3-, and 5-year OS of UC patients based on five parameters, including CRG risk score, N stage, T stage, age, and gender (Fig. 5A). Obviously, the lower the score is, the better the prognosis. It is evident from the calibration plot that nomogram-predicted OS and ideal outcomes are in good agreement (Fig. 5C). In addition, the model's C-index was 0.723, indicating a considerable degree of predictive significance. Furthermore, the 1-year, 3-year, and 5-year AUC values were 0.78, 0.79, and 0.81, correspondingly (Fig. 5B). The results suggested that the newly developed nomogram-prediction model was a reliable tool for clinical decision-making for UC patients.
Correlations of CRG risk score with tumor microenvironment and mutation landscape of UC
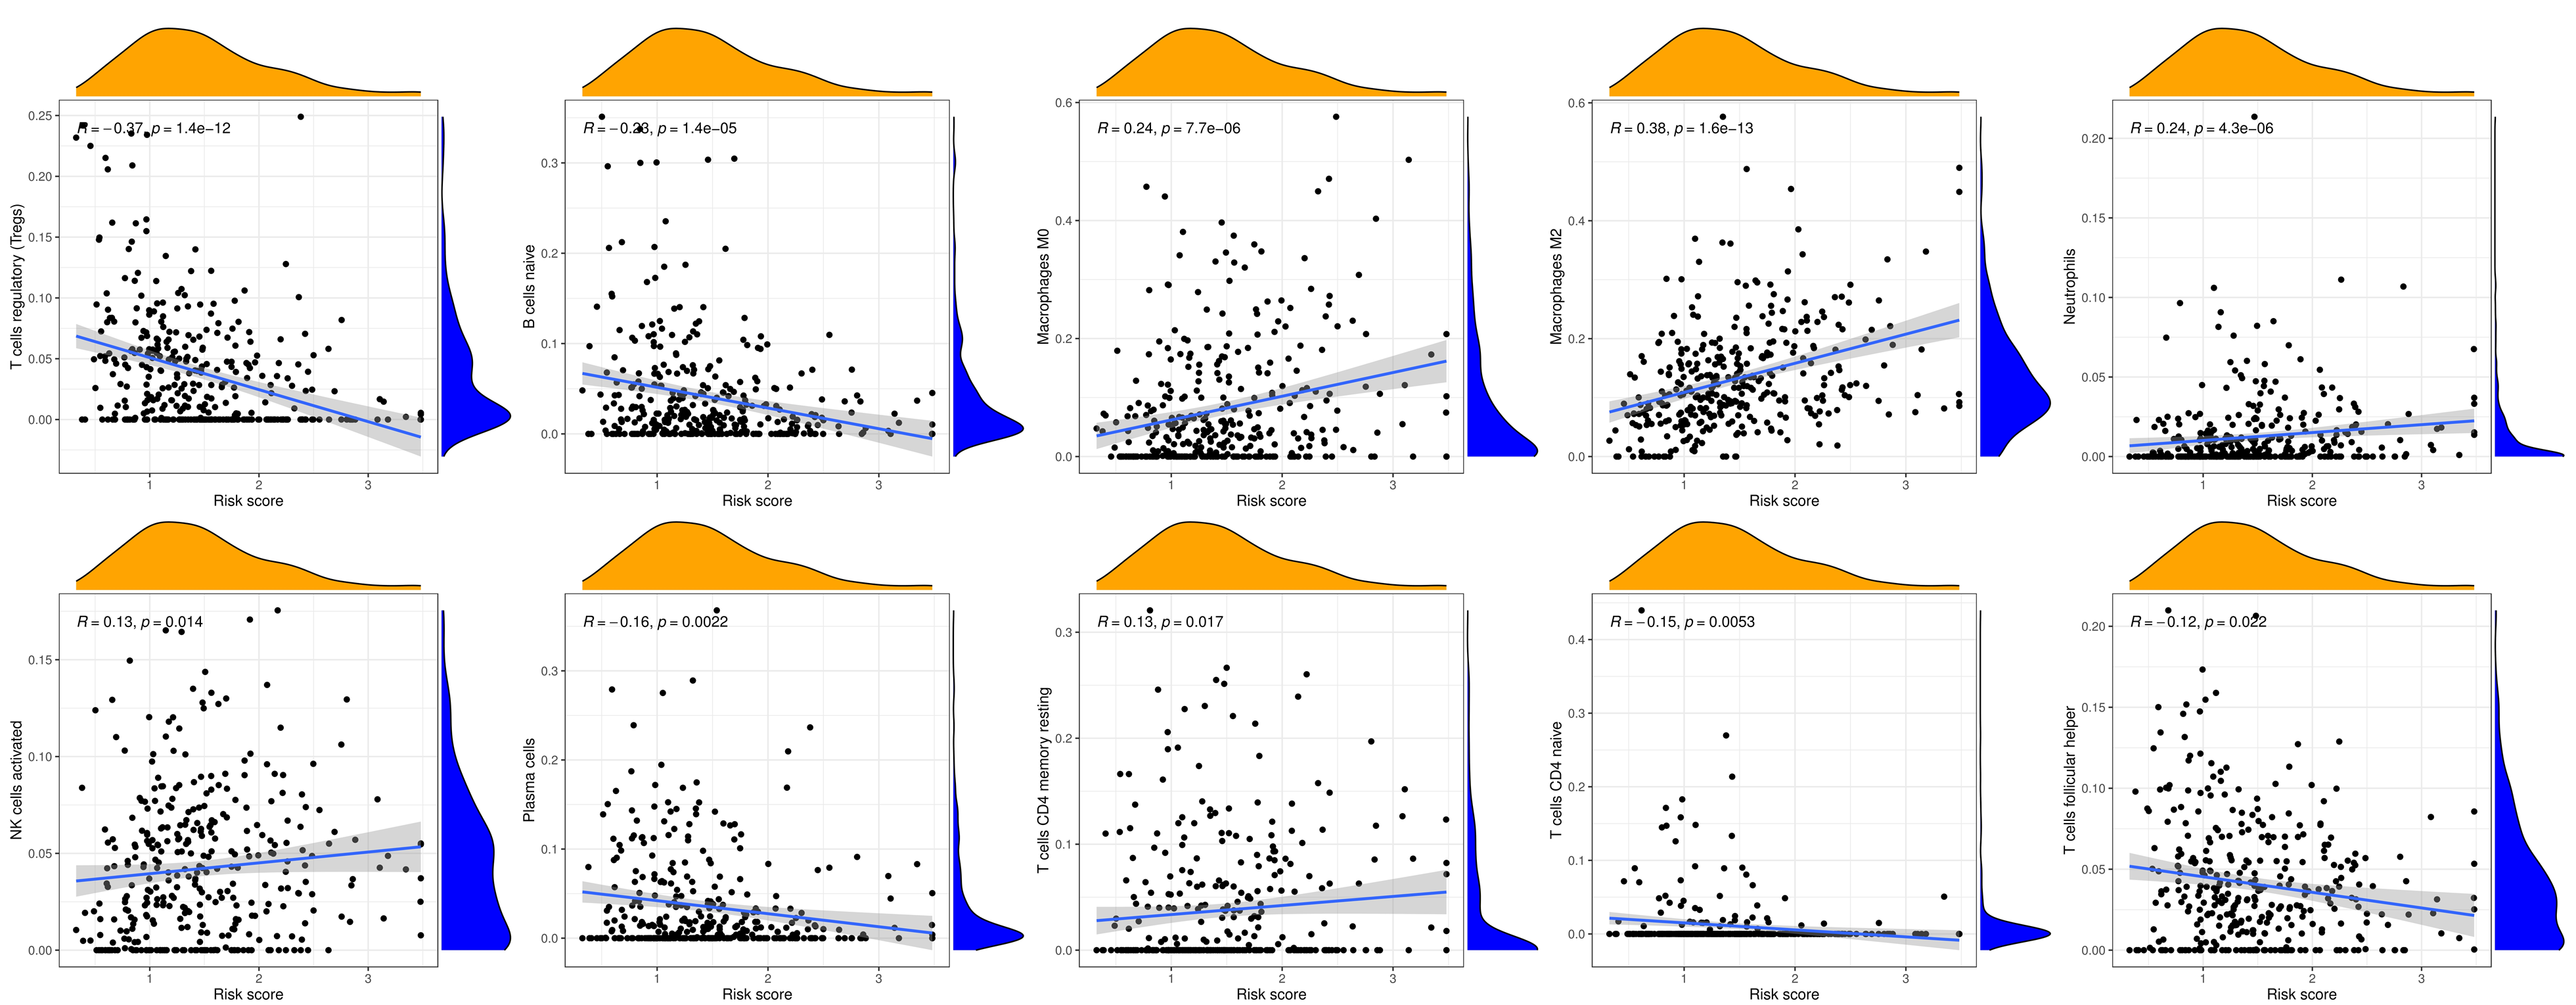
The CIBERSORT algorithm showed that the prognostic CRG risk score was positively correlated with activated NK cells, resting CD4 T memory cells, M0 macrophages, Neutrophils, and M2 macrophages, and negatively correlated with regulatory T cells (Tregs), follicular helper T cells, CD4 naive T cells, Plasma cells, and naive B cells (Fig. 6A and S3).
The ESTIMATE algorithm was employed in calculating the stromal and immune scores. As shown in the violin plot, CRG risk score was significantly positively related to StromalScore, ImmuneScore, and ESTIMATEScore, indicating lower tumor purity (Fig. 6B).
We also visualized the mutation landscapes of low-risk and high-risk groups in the TCGA cohort and made a comparison. As a result, we found that the low-risk group displayed a much higher overall rate of mutation than the high-risk group (94.38% vs 93.49%). Both two groups possessed the same top 5 mutated genes, namely TP53, TTN, KMT2D, MUC16, and ARID1A (Fig. 6D-E). In addition, we discovered that the risk score had a remarkably adverse correlation with tumor stemness, as determined by RNAss (Fig. 6C, p = 2.4 * e10).
Anti-cancer drug susceptibility analysis between two risk groups
Next, we performed an anti-cancer drug susceptibility analysis to find potential chemotherapy or targeted agents that could be beneficial to patients with different risk groups. As displayed in Fig. 7, patients in the low-risk group had higher IC50 values for bexarotene, bleomycin, bortezomib, cisplatin, cyclopamine, dasatinib, docetaxel, and doxorubicin. Adversely, the IC50 values of bicalutamide, erlotinib, axitinib, bosutinib, and afatinib were significantly elevated in the low-risk group.