Materials and reagents
Iron chloride hexahydrate (FeCl3⋅6H2O, 99.96%) and CCM were purchased from Shanghai Macklin Biochemical Co., Ltd (China). 2-Amino terephthalic acid (BDC-NH2, 99%), N,N-dimethylformamide (DMF) and Hyaluronic acid (HA, MW: 4.0 × 10⁵ Da) were obtained from Shanghai Aladdin Biochemical Co., Ltd (China). All siRNA duplexes were synthesized by Sangon Biotech Co., Ltd (China). The sequence of mice siHIF-2α: sense: 5’-CGU-GAG-AAC-CUG-AGU-CUC-A-3’, antisense: 5’-UGA-GAC-UCA-GGU-UCU-CAC-G-3’; siHIF-2α labeled with Cy5 was abbreviated as siCy5. DEPC-treated water, reactive oxygen species (ROS) Assay Kit and LysoTracker Green and MitoTracker Green were obtained from Beyotime Institute of Biotechnology (China). Recombinant Murine IL-1beta (IL-1β) was purchased from PeproTech Inc (China). The methyl-thiazolyl bromide (MTT) and 4’,6-diamidino-2-phenylindole (DAPI) and 2’,7’-dichlorofluorescin diacetate (DCFH-DA) were obtained from Zhengzhou Acme Chemical Co., Ltd. The antibody of matrix metalloproteinase13 (MMP13) was purchased from Abcam (China). ChamQ SYBR qPCR Master Mix, HiScript® III-RT SuperMix for qRT-PCR (qRT-PCR = quantitative real-time polymerase chain reaction) (+gDNA wiper) were purchased from Nanjing Vazyme Biotech Co., Ltd (China). Primes for Acan, Col2a1, SOX9, Interleukin-6 (IL-6), MMP13, HIF-2α, MMP3, thrombospondin motifs-5 (Adamts-5), cyclooxygenase-2 (COX-2), and housekeeping gene of GAPDH were purchased from Tsingke Biological Technology Co., Ltd (China). Collagenase Ⅱ, Hematoxylin&Eosin stain Kit, Toluidine bule Stain Kit, modified Safranin O/ fast Green Stain Kit were purchased from Solarbio Science & Technology Co., Ltd (China). All reagents and solvents were commercially available and used as received.
2.2. Apparatus
The morphological analysis of nanoparticles was performed on Hitachi HT7700 transmission electron microscope (TEM) and Hitachi S-4700 field-emission scanning electron microscope (SEM). Dynamic light scattering (DLS) and surface charge (zeta potential) of the different nanoparticles were analyzed using a Malvern Zetasizer Nano ZS (Malvern, England). qRT-PCR was conducted using LightCycler 96 system (Roche, Switzerland). Wide-angle powder X-ray diffraction (PXRD) patterns were conducted with the crystal phase of nanoparticles via D8-advance X-ray diffraction (Rigaku, Japan) using Cu Kα radiation over the 2θ range 5−30°. The Ultraviolet-visible (UV-vis) absorption spectroscopy was measured using a UV spectrophotometer (Lambda 25, Perkin Elmer, USA). Microscopy images of cells were obtained on Axio Observer A1 fluorescence inverted microscope and confocal laser scanning microscopy FV3000 (CLSM, Olympus Corporation, Japan). The reconstruction of micro-CT three-dimensional images were obtained on NanoScan1172.
2.3. Preparation of CCM-loaded MIL-101-NH2
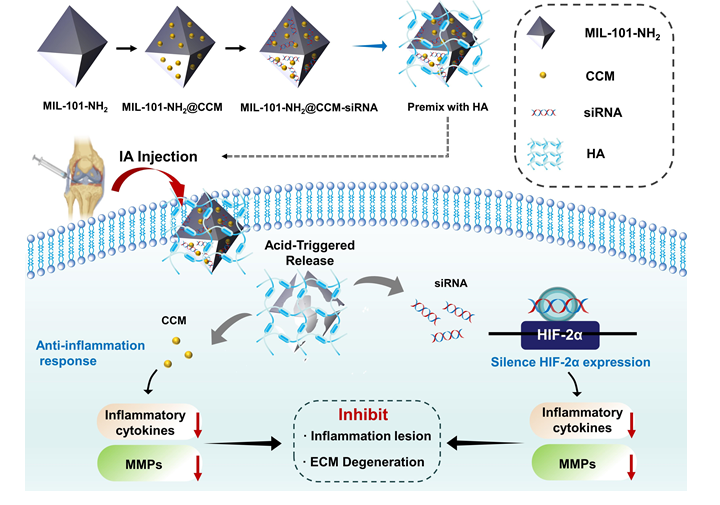
The MIL-101-NH2 was synthesized according to previously reported methods.[51, 52] Typically, the powder of FeCl3·6H2O (67.6 mg, 0.25 mmol) and BDC-NH2 (45.3 mg, 0.25 mmol) were independently dissolved in 10.0 mL DMF to form clear solutions. Then, the two solutions were mixed under ultrasonic wave for 10 min, and the mixture solution was left undisturbed for 12 h at 120 °C. The precipitated brownish-red product was obtained by centrifugation at 8,000 rpm for 5 min, washed with DMF and ethanol three times, and then dried at room temperature overnight under vacuum to completely remove the residual solvent.
CCM-loaded MIL-101-NH2 nanoparticles (denoted as MC NPs) were prepared using the impregnation approach.[51] First, the MIL-101-NH2 solution was prepared by ultrasonic dispersion in ethanol. Next, CCM was dissolved in ethanol and homogeneously added into MIL-101-NH2 solution (1 mg/mL; 5 mL) with different weight ratios (Table S1) of MIL-101-NH2/CCM, and finally stirred at a speed of 200 rpm for 24 h. After that, the solution was centrifuged at 8000 rpm for 5 min and washed with ethanol several times to remove the redundant and surface-absorbed CCM and obtain the final product, namely, MC NPs. Finally, the MC NPs were dried under vacuum overnight at room temperature prior to further application. Based on the standard curve, the CCM content of MC NPs was determined using a UV spectrophotometer, and the drug loading capacity (DLC) and drug loading efficiency (DLE) were calculated using Equation S1andS2.
2.4. Preparation of siHIF-2α-loaded MIL-101-NH2@CCM complex
The MC NPs were filtered through a millipore filter (pore size 0.22 µm) and were then dissolved in DEPC-treated water. Different volumes of MC NPs solutions were added dropwise into the siHIF-2α solution, and the weight ratios of MC NPs to siHIF-2α were varied from 5:1 to 35:1. Afterward, the mixtures were adjusted to the same final volume in DEPC-treated water, and the final concentration of siHIF-2α was 100 nM. Subsequently, the mixed solutions were incubated for 30 min with a shaking speed of 100 rpm at room temperature. The siHIF-2α-loaded MC nanoparticles-MIL-101-NH2@CCM-siRNA (denoted as MCS NPs) were centrifuged at 13,000 rpm for 15 min, washed thrice with DEPC-treated water. Then, the supernatant was discarded to remove the free siHIF-2α, and the precipitate of MCS NPs was finally collected and re-suspended in an aqueous solution at 4 ℃ for subsequent evaluations. As shown in Table S2, siHIF-2α and Cy5-labeled siHIF-2 (siCy5) were used in different experiments. And Table S3 presents the weight ratio of MC to siHIF-2α in MCS NPs.
2.5. siHIF-2α loading affinity of MC NPs assay
The siHIF-2α binding affinity of MC NPs was confirmed by fluorescence spectrum and gel electrophoresis. First, the binding affinity of siHIF-2α was preliminarily evaluated via fluorescence spectrum with the excitation and emission wavelengths of siCy5 being 650 nm and 670 nm, respectively. Then, the concentration of the siCy5 solution was fixed to 100 nM. With the addition and agitation of MIL-101-NH2, MC NPs at a certain concentration, the emission fluorescence peak of the measured mixed solution gradually decreased in different degrees, which was confirmed by the fluorescence spectrum.
The ability to absorb siHIF-2α of MC NPs was also confirmed by gel retardation assay. The binding affinity of MC NPs with different DLCs was evaluated, compared with the naked siHIF-2α and MIL-101-NH2-siRNA NPs (denoted as MS NPs). First, 20 μg of samples (MC NPs with different DLC) were incubated with 100 nM siHIF-2α aqueous solution. The obtained solutions were centrifuged, the precipitations of MCS NPs were resuspended in 10 μL DEPC-treated water, and the supernatants were collected for comparison. The samples were loaded onto the preheated 4% agarose gel by using a previous reported method. [53] Then, the electrophoresis experiment was performed at 180 V for 20 min, and the gel was stained with ethidium bromide solution for 30 min. Ultimately, the UV imaging system was used to investigate the loading capacity of these samples.
2.6. In vitro CCM and siHIF-2α release studies
To determine the drug release profile, we suspended 4 mg of MC NPs in 40 mL of phosphate-buffered saline (PBS) + 1% v/v Tween 80 and shook the same at 120 rpm for 40 min.[51] Tween 80 was added to enhance the stability and solubility of CCM in PBS. At a predetermined time, 1 mL of the solution was removed for evaluation, and replenished with 1 mL of fresh PBS + 1% v/v Tween 80 to maintain the constant condition. The withdrawn solution was analyzed with a UV-Vis spectrophotometer to obtain the concentration of the released drug based on the standard curve of CCM in PBS+ 1% v/v Tween 80. Afterward, a time-dependent drug release percentage was calculated with three repeated experiments. The standard curve of CCM in PBS (1% v/v Tween 80; pH = 5.0, pH = 6.5 and pH = 7.4) and the equations for the calculation of the percent of release drugs are presented in the supporting information.
To evaluate the release rate of siHIF-2α, the MCS NPs (1.0 mg/mL) were dispersed in PBS with various pH values (5.0,6.5 and 7.4). At a predetermined time, 100 μL of the above solutions was collected and centrifuged at 13,000 rpm three times. T supernatant was then collected for measuring absorbance at 260 nm. All release experiments were conducted in triplicate. The cumulative release of siHIF-2α was calculated by dividing the released amount by the total encapsulated amount.
2.7. Stability.
The stability of MCS NPs was analyzed by observing the nanoparticle-diameters. First, 0.5 mg of MCS NPs was dispersed in 5 mL PBS (pH = 7.4) at room temperature. At indicated time points, the DLS of the MCS NPs solution was observed by Malvern Zetasizer Nano ZS.
2.8. Isolation and culture of primary chondrocytes from mice
Primary articular chondrocytes were harvested from one-week-old C57BL/6 mice, which were sacrificed and immersed in 75% alcohol to for 10 min to disfection. Under aseptic conditions, the total knee cartilage of exposed mice was harvested with sterile equipment and digested with 0.25% trypsin for 30 min. The residual cartilage tissue was further separated under a microscope, and the further subdivided cartilage tissue was digested with type Ⅱ collagenase for 6 h. Following this, the harvested chondrocytes were filtered with a 70 μm cell strainer and then rinsed using sterile PBS. The resultant mice primary chondrocytes were cultured in DMEM/F12 with 10% fetal bovine serum (FBS) and 1% penicillin and streptomycin. All the chondrocytes were cultured at 37 ℃ and 5% CO2 and passaged at nearly 80% confluency until the second or third for further use to avoid changes in phenotype.
2.9. MTT assay
By using the MTT assay, we investigated the influences of CCM, MIL-101-NH2, MC NPs, and MCS NPs on the proliferation of chondrocytes. The chondrocytes were seeded in 96-well plates (8,000 cells per well) and incubated overnight. The medium was removed and replaced by 100 μL of fresh culture medium (10% FBS in DMEM/F12 medium). Various concentrations of CCM, MIL-101-NH2, MC NPs and MCS NPs were added into the culture medium separately. In the following 24 h incubation, 100 μL/well MTT solution (0.5 mg/mL) was added and further incubated for 4 h at room temperature. Finally, the supernatants were discarded, and the formazan crystals were dissolved in DMSO (150 μL/well) with the absorbance measured by a multiple microplate reader at 490 nm.
2.10. Live/dead cell staining
To measure the cell biocompatibility of MCS NPs, live and dead cell staining using calcium fluorescein AM (green fluorescence) and propidium iodide (PI, red fluorescence) were performed, respectively. Chondrocytes at 80% confluency in 24-well plates were incubated with concentrations of 100 μg/mL MCS NPs for 24, 48 and 72 h. Then, the chondrocytes were washed with PBS before using the inverted fluorescence microscopy. As per the manufacturer’s instructions, green fluorescence indicates viable cells with esterase activity, whereas red fluorescence shows dead cells.
2.11. Intracellular reactive oxygen species (ROS) measurement
To detect the intracellular reactive oxygen species (ROS) generation induced by MIL-101-NH2, an ROS assay kit was applied. Three groups of chondrocytes were studied and compared: (1) Control group, with chondrocytes incubated with culture medium only; (2) Rosup group, with chondrocytes incubated with culture medium and stimulated by 1 μL of 50 mg/mL active oxygen (Rosup) for 30 min as comparison; and (3) MIL-101-NH2 group, with chondrocytes incubated with culture medium and 100 mg/mL MIL-101-NH2 for 24 h. Then, after washing with a serum-free medium, chondrocytes were stained with 2′, 7′-dichlorofuorescein diacetate (DCFH-DA).. After incubation of each group with 10 μM of DCFH-DA for 30 min, the chondrocytes were washed thrice with PBS. Subsequently, the fluorescence intensity was determined via fluorescence microscopy and ROS levels were evaluated by ImageJ.
2.12. Cellular uptake studies of MCS NPs
To initiate the processes of CCM internalization and transfection and gene silencing, MCS NPs were required to first cross cell membranes and be uptaken by chondrocytes. Owing to the intrinsic green fluorescence of CCM and the red fluorescence of siCy5, the cellular uptake of MCS NPs was investigated using a confocal laser scanning microscope (CLSM). Therefore, the cellular uptake was demonstrated by two different intracellular fluorescence approaches. In this study, chondrocytes with a density of 105 cells per dish, were seeded in dishes with glass bottom and incubated in the culture medium for 24 h. After this, the chondrocytes were treated with the MCS NPs (100 µg/mL) in fresh DMEM at different durations (0, 2, 4, 6, and 8 h). Finally, the medium was removed, and the cells were washed with PBS (pH = 7.4), and then stained with DAPI (10 µg/mL) for 20 min before being observed by a CLSM. Besides, to evaluate the internalization pathway of nanoparticles, Lysotracker Green and MitoTracker Green were incubated with MS NPs at a predetermined time. The co-localization rate was quantitatively determined using ImageJ based on the CLSM images.
2.13. Lysosome escape
To visualize the co-localization of internalized MCS NPs within the lysosomal compartments, the chondrocytes were incubated with MIL-101-NH2 containing siCy5 for different durations at 37 °C. The chondrocytes were washed with PBS several times, fixed with 4% paraformaldehyde for 20 min at 4°C, and sequentially stained with Lysotracker Green (100 nM) for 1 h, and with DAPI (10 µg/mL) for 20 min at room temperature before being observed under the CLSM. A time-dependent study of lysosome escape was performed by incubation MCS NPs with chondrocytes for 30, 60, 120, 240, and 360 min followed by Lysotracker Green and DAPI staining. Subsequently, the time-dependent co-localization of MCS NPs and lysosomes was observed by CLSM, and the co-localization efficiency was quantitatively analyzed using ImageJ based on the CLSM images.
2.14. Treatment of inflammatory chondrocytes stimulated by IL‑1β
The chondrocytes were divided into five groups: (1) Control group, with chondrocytes incubated with culture medium only; (2) IL-1β group, with chondrocytes incubated with culture medium and 10 ng/mL IL-1β for 24 h, simultaneously; (3) MC group, with chondrocytes incubated with culture medium, 100 μg/mL MC NPs and 10 ng/mL IL-1β for 24 h, simultaneously; (4) MS group, with chondrocytes incubated with culture medium,100 μg/mL MC NPs and 10 ng/mL IL-1β for 24 h, simultaneously; (5) MCS group: chondrocytes incubated culture medium with 100 μg/mL MC NPs and 10 ng/mL IL-1β for 24 h, simultaneously.
2.15. Quantitative real‑time polymerase chain reaction (qRT‑PCR) assay
Table 1. The primer sequences used for qRT-PCR
|
Gene
|
Forward primer
|
Reverse primer
|
|
GAPDH
|
CTCAACTACATGGTCTACATGTTCCA
|
CTTCCCATTCTCAGCCTTGACT
|
|
Acan
|
TCCACATCAGAAGAGCCATAC
|
AGTCAAGGTCGCCAGAGG
|
|
Col2a1
|
CTTAGGACAGAGAGAGAAGG
|
ACTCTGGGTGGCAGAGTTTC
|
|
SOX9
|
CAGTCCCAGCGAACGCACAT
|
TGCTGCTGCTGCTCGCTGTA
|
|
MMP3
|
GGCTGTGTGCTCATCCTACC
|
TGGAAAGGTACTGAAGCCACC
|
|
MMP13
|
AAAGAACATGGTGACTTCTACC
|
ACTGGATTCCTTGAACGTC
|
|
HIF-2α
|
CTGAGGAAGGAGAAATCCCGT
|
TGTGTCCGAAGGAAGCTGATG
|
|
IL-6
|
AGTCCTTCCTACCCCAATTTCC
|
TTGGTCCTTAGCCACTCCTTC
|
|
Adamts-5
|
TGTGGTGCGCCAAGGCCAAA
|
CCCTGTGCAGTAGCGGCCAC
|
|
COX-2
|
GATGACGAGCGACTGTTCCA
|
CAATGTTGAAGGTGTCCGGC
|
For RT-qPCR analysis, chondrocytes were seeded into six-well plates and incubation for 48 h. Then these chondrocytes were post-treated with MS NPs, MC NPs and MCS NPs followed by stimulating with 10 ng/mL IL-1β for 24 h. As previously reported, total RNA was extracted from chondrocytes using an RNA isolation kit [54]. One microgram of total RNA was used to synthesize cDNA using a ReverTra Ace qPCR RT Kit. The amplification of cDNA was performed by the SYBR Green real-time PCR Master Mix on a LightCycler 96 instrument.
2.16. Safranin O staining in vitro
In the in vitro study, chondrocytes were fixed with 95% alcohol for 30 min in all groups. After washing with PBS and removing the residue of 95% alcohol, the chondrocytes were stained with safranin O dye for 10 min and then washed with PBS to remove the residual dye. Finally, five groups were measured using an inverted fluorescence microscope.
2.17. Immunofluorescence staining
The prepared chondrocytes were fixed with 4% paraformaldehyde for 15 min, followed by permeabilization with 0.1% Triton X100 for 15 min. Subsequently, the chondrocytes were incubated with mouse anti-MMP13 antibodies (1:100 dilution) at 4 °C overnight. The chondrocytes were washed with PBS several times and then incubated with appropriate Alexa Fluor-coupled secondary antibodies for 1 h. The cell nuclei were stained with DAPI for 15 min. Afterward, Alexa Fluor 594 phalloidin was used to label MMP13. Ultimately, the images were obtained using an Olympus fluorescence microscope.
2.18. Animal experiments
Animal experiments were approved by the Animal Ethics Committee of the Animal Experiment Center of Southern Medical University (Permit Number: 44002100029797). The C57BL/6 mice were obtained from the Animal Experiment Center of Southern Medical University. Animal experiments were conducted in accordance with the guidelines of the Animal Care Committee.
The model mice were randomly divided into five groups on average: the normal control group (NC group), destabilized medial meniscus (DMM) group, MC group, MS group, and MCS group (all premixed with the HA solution). Except for the NC group, the DMM surgery was applied to construct the OA model in male C57BL/6 mice (12 weeks old; n = 40). Anesthesia was used to expose the arthrosis, and the quadriceps was turned laterally to avoid damaging the patellar ligament after the arthrosis was exposed.[55] The medial meniscus was then dissected, and the medial meniscus ligament was transected in a way that did not damage the articular cartilage. Finally, the medial capsular incision was sutured after restoring the quadriceps well and closing the skin. Sham operations involving exposure of the joint capsule without MMTL transection were performed as a non-operated control group. Moreover, the mice in the MC, MS and MCS groups were intra-articular injected with 10 μL solution (1 mg/mL) into joints once per week for four weeks. The mice in these groups were sacrificed for analysis at weeks 4 and 8 after treatment. Besides, the body weights of mice were measured before these mice were sacrificed.
2.19. Micro-CT scan
With the aid of a microtome imaging system, a micro-computed tomography (micro-CT) scan was performed on specimens corresponding to fixed knee joints. The small field was selected for scanning and correcting the CT value, with a 70 kV scanning voltage and 5 μm scan thickness. Three-dimensional knee reconstruction and image capture were performed using Mimics Medical software. After defining the interest region to encompass all osteophytes, the bone volume (BV) and articular space width were analyzed (relative to the NC group). Reconstructed and three-dimensional modeled data were obtained for further analysis.
2.20. Histological staining in vivo
Knee joints from the mice were harvested, fixed in 4% paraformaldehyde for 48 h, and decalcified for 4-8 weeks in 10% ethylenediaminetetraacetate (EDTA). After serial dehydration, the joints were embedded in paraffin and sagittally sectioned at 4-μm thickness. These sections were dewaxed and stained with Hematoxylin&Eosin (H&E), safranin O/fast green and toluidine blue. Then, the sections were graded according to the scoring criteria reported by Osteoarthritis Research Society International (OARSI).[56]
Immunohistochemical staining was performed to analyze the secretion of MMP13. After dewaxed sections were washed with PBS, the sections were treated with 3% (v/v) hydrogen peroxide H2O2 for 15 min at room temperature to block endogenous peroxidase activity. After blocking with normal goat serum for 20 min at room temperature, primary MMP13 antibodies were added and incubated at 4 °C overnight. Afterward, the biotin-labeled horseradish peroxidase solution was added to the sections after 15 min of secondary antibody incubation. To develop colors and dye nuclei, 3, 3′-diaminobenzidine tetrahydrochloride was used as well as hematoxylin. Tissues sections were observed and photographed with an Olympus fluorescence microscope.
2.21 Statistical analysis
All data were expressed as the mean ± standard deviation (SD), and all independent experiments were repeated at least three times. One-way analysis of variance (ANOVA) was used to assess group differences. *p<0.05; **p<0.01; ***p<0.001 were considered statistically significant. Statistical analyses were performed by Origin 9 and GraphPad Prism 9.0.