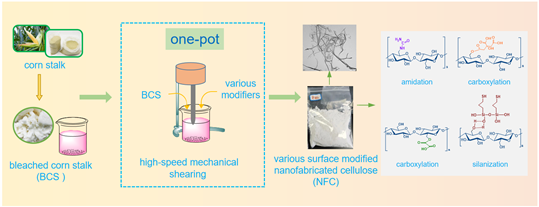
This study proposed a facile, efficient, and energy-saving one-pot strategy to produce nanofabricated cellulose (NFC) from bleached corn stalk along with concurrent modifications of the surface. High-speed mechanical shearing and mechanochemical activation (urea/NaOH, oxalic acid, citric acid, and mercaptopropyl trimethoxysilane) were involved in the strategy. The effects of different surface functionalization on the morphological, crystalline, chemical, and thermal properties of the NFC were investigated. The results suggested that the bleached corn stalk fibers were separated into microfibrils associated with abundant branched and networked cellulose nanofibrils through intensive mechanical shearing. NFC showed an average diameter of 23 nm and an average length of 1530 nm, with an aspect ratio of 67. The hydroxyl groups on the NFC surface were functionalized and modified by forming amide (urea/NaOH), carboxyl (oxalic acid/citric acid), and hydrogen bond (mercaptopropyl trimethoxysilane), respectively. This novel one-pot strategy could open up new application areas for production and surface functionalization of nanocellulose.
Research Article
A facile approach for preparing nanofabricated cellulose from bleached corn stalk with tailored surface functions
https://doi.org/10.21203/rs.3.rs-2217512/v1
This work is licensed under a CC BY 4.0 License
Journal Publication
published 08 May, 2023
You are reading this latest preprint version
nanofabrillated cellulose
surface modification
mechanical shearing
corn stalk
mechanochemical activation
Cellulose is the main composition of cell walls, making plants stiff and upright. Over the past decades, it has been one of the most popular research topics among various renewable materials (Omran et al., 2021). As a natural carbohydrate polymer, it is the most abundant bioresource on Earth and can be derived from plants, animals, or bacteria (Babaei-Ghazvini et al., 2022). Cellulose are widely used to prepare many valuable products like nanostructured biocomposites, tough hydrogels, aerogel membranes, transparent paper, and films (Barbosa et al., 2022; Thongsomboon et al., 2018). Among these, the corn stalk is an annually renewable lignocellulosic biomass, and most corn stalk yield is underutilized in China (Yang et al., 2020). As a result, it can be a good candidate as a low-cost and abundant source of cellulose materials.
Nanocellulose with < 100 nm in diameter and several micrometers in length owns a unique multi-dimensional structure and can be separated into nanofibrils by decreasing diameter (ranging from around 2–4 nm to 100 µm) (Wang et al., 2020). Due to this hierarchical structure, fibrillated cellulose has substantial tunability in terms of morphology (nanocrystal cellulose, nanowhisker cellulose, nanofiber cellulose, and nanofibrillated cellulose) and fiber size (micron and nanoscale cellulose) (Huang et al., 2019; Kumar et al., 2014). Nanominiaturization enables cellulose with excellent mechanical properties, such as strengths and moduli, and optical, thermal, fluidic, and ionic properties (Li et al., 2021). Further, it has great potential, particularly in the fields of papermaking, food, cosmetics, biocomposites, energy, and biomedicine. Among them, nanofibrillated cellulose (NFC) is a promising nanomaterial owing to its special structure, high surface area, excellent mechanical properties, and availability (Jiang et al., 2019; Meng et al., 2019). NFC is usually produced by chemical pretreatment followed by mechanical defibrillation (Hou and Wu, 2022). We previously reported a network-like NFC made from bamboo by using swelling and homogenization treatments. NFC was found to be an excellent reinforcing effect for biopolymer composites (Yokesahachart et al., 2021; Tian, J. et al., 2022; Xu et al., 2021). Chen et al. (2018) also prepared NFC from cornstalk microcrystalline cellulose by high-pressure homogenization. Good strengthening ability and structural toughness network were confirmed as well. In fact, hydrophilicity is inevitable due to the abundance of hydroxyl groups on the surface of cellulose. This is contrary to the need for a functional surface (such as hydrophobic) in the application scenario of NFC as a reinforcement. As a result, it is difficult to achieve the purpose of surface functional modification while preparing NFC without post-treatments.
Cellulose is a homopolymer of β-D-glucopyranose units, which contains three hydroxyl groups (Rana et al., 2021). Consequentially, severe agglomeration and high hydrophility occur in the nanocellulose material, which greatly limits the applications of NFC. Notably, surface modification of NFC can be a key factor in promoting the accessibility of hydroxyl groups, tailoring the chemical function, and breaking down the hydrogen bonds between nanofibrils (Beluns et al., 2021). Surface-functionalization such as esterification, etherification, acetylation, and silylation are widely reported in literature to improve the dispersibility and compatibility of cellulose (Gao et al., 2021; Jiang et al., 2021; Yang et al., 2021). Hong et al. (2020) prepared carboxylated CNF through concentrated oxalic acid hydrolysis and subsequently mechanical fibrillation. Zheng et al.(2020) employed TEMPO-mediated oxidation to increase the number of carboxylic groups of cellulose fiber to further enhance the reinforcing effect and dispersing ability of nanocellulose. At present, the surface modification of NFC needs to be carried out after the preparation of NFC. This strategy adopts a two-step method, which is relatively complex, inconvenient, and energy-intensive (Fourati et al., 2020). As a result, a clean and efficient method to produce NFC while achieving surface modification requires further investigation.
In this study, we proposed a novel one-pot strategy for fabricating and surface-functionalizing of NFC from bleached corn stalks simultaneously. Four different reagents (urea/alkali, oxalic acid, citric acid, and mercaptopropyl trimethoxysilane) and high-speed mechanical shearing were employed to achieve different surface modifications. Surface and chemical properties, micromorphology, and thermal stability of the NFC were analyzed by water contact angle test, Fourier transform infrared spectroscopy (FT-IR), X-ray photoelectron spectroscopy (XPS), scanning electron microscopy (SEM), atomic force microscope (AFM), and transmission electron microscope (TEM), X-ray diffraction (XRD), and thermalgravimetric analysis (TGA). The segregation mechanism and surface modification mechanism of NFC were clearly clarified. This one-pot strategy herein can not only obtain NFC with excellent morphology but also functionalize its surface, which provides merits, including toxic chemicals free and convenient processing steps with associated low manufacturing costs.
2.1. Materials
Corn stalks were harvested in local farmland in Ningbo, Zhejiang, China. They were dried, ground, and sieved through a screen of 60 meshes. Sodium chlorite, acetic acid, and sodium hydroxide ACS grade were purchased from Aladdin, Co., Ltd. (Shanghai, China). Urea, oxalic acid, citric acid, ethanol, and mercaptopropyl trimethoxysilane were purchased from Macklin, Co., Ltd. (Shanghai, China). All other reagents and solvents were used as received from the commercial source.
2.2. Methods
2.2.1. Preparation of NFC
Approximately 200 g of corn stalk (CS) particle was treated with 15 wt% NaOH solution at a liquid-solid mass ratio of 20/1 for 6 h at 75 ℃ to remove the hemicellulose and impurities. Then, the bleaching process was conducted by soaking the alkali-treated CS into 15 wt% acidic sodium chlorite solution (NaClO2 : CH3COOH = 100:7, w/w) at 75 ℃ for 2 h. The residual hemicellulose and lignin were removed (see Fig. 1a). This treatment was repeated 2–3 times until the residue became pure white. Subsequently, the reactant was cooled, rinsed, and filtered using excessive deionized water until the pH reached neutral. Thereafter, bleached corn stalk (BCS) particles were obtained.
BCS were accurately weighed 30 g, 45 g, 25 g, and 45 g to prepare 4 slurries for different surface functionalization, respectively. 1) 30 g BCS was added to 100 mL of sodium hydroxide and urea mixed solution (NaOH : CH4N2O : H2O = 7:12:81, w/w/w) under magnetic stirring at 60 ℃ for 2 h; 2) 45 g BCS was added to 450 g of 40 wt% oxalic acid solution at an acid-pulp ratio of 10/1, stirred at 70 ℃ for 1 h and then diluted using 300 mL deionized water to terminate the hydrolysis reaction; 3) 25 g BCS was added to 160 mL of 60 wt% citric acid solution (weighed 240 g of citric acid), stirring and hydrolyzing for 30 min at 50 ℃; and 4) 250 mL of ethanol aqueous solution (alcohol: water = 4:1, w/w) dissolved 3.6 g mercaptopropyl trimethoxysilane (8 wt% of BCS mass) followed by hydrolysis under magnetic stirring at 50 ℃ for 30 min with acetic acid (adjust pH = 4 ~ 5), then 45 g BCS was added to the above-hydrolyzed solution. Afterward, the above 4 suspensions were subjected to high-speed mechanical shearing at 12000 rpm for 2 h (FA25, Fluko, USA) followed by centrifugation washing at 8000 rpm for 3 min. The centrifugation step was repeated 4–5 times until the pH reached neutral. Then the precipitate was shifted to a freeze-dryer (HUXI, HXLG-12-50B) at -60 ℃ for 6 days to obtain the freeze-dried UA-NFC, OA-NFC, CA-NFC, and MT-NFC respectively corresponding to urea/alkali treatment, oxalic acid treatment, citric acid treatment, and mercaptopropyl trimethoxysilane treatment for further testing (see Fig. 1b).
2.2.2. Scanning electron microscopy-energy dispersive X-ray analysis (SEM-EDS)
The micromorphologies of the raw CS, BCS, and NFCs with different chemical treatments were observed using a field emission scanning electron microscopy (SEM) (Nova NanoSEM 450, FEI, USA). All samples were coated with platinum using the sputtering technique. The emission voltage of the electron microscopy was 10 kV. The spatial elemental distribution was evaluated by SEM using non-destructive energy dispersive electron analysis (EDS), which was performed at a working voltage of 20 kV and was standardized with the Co element using a spectrometer (Oxford Instruments X-MaxN) attached to the SEM.
2.2.3. Transmission electron microscopy (TEM)
TEM observation of NFC with different treatments was carried out on a transmission electron microscope (JEOL JEM-1200EX, Japan) with an accelerating voltage of 120 kV. A droplet of the diluted NFC suspension (0.01 wt% to 0.2 wt%) was deposited on the surface of carbon-coated copper grids. And the NFC was dyed with uranyl acetate.
2.2.4. Atomic force microscopy (AFM)
The size distributions of NFCs were studied by AFM (Tai/5500, Agilent, USA). The images were acquired by adsorbing the samples on silicon wafers. Approximately 10 microliters of the diluted NFC suspension (0.01 wt%) were directly dropped onto the silicon wafer and allowed to dry overnight. The samples were scanned in the air by tapping at relative humidity and temperature using a standard silicon probe (tip radius).
2.2.5. Particle size distribution
The particle size was characterized using the Zetasizer Nano ZS90 (Malvern, England) with a dynamic light scattering at a 90° scattering angle. Three replications were used for the analysis.
2.2.6. Fourier transform infrared spectroscopy (FTIR)
The freeze-dried NFC with different chemical treatments was ground with pre-dried KBr powder and then compressed into thin disks for FT-IR testing. The absorption spectra were recorded using a Nicolet 6700 Fourier transform infrared spectrometer (Thermo Nicolet, USA) with a resolution of 4 cm− 1. The scanning was in the wavenumber range from 4000 cm− 1 to 500 cm− 1. 64 scans were carried out for all samples.
2.2.7. X-ray photoelectron spectroscopy (XPS)
Surface functional modification of different chemical-treated NFCs was carried out using the Thermo Scientific Nexsa XPS spectrometer (USA) equipped with an Al Kα irradiation source. Survey scans were generated from − 10 eV to 1350 eV with a scan step of 1 eV. High-resolution C1s and O1s spectra were recorded from 279 eV to 298 eV and 526 eV to 544 eV, respectively. Besides, Si 2s and Si 2p spectra were recorded from 150 eV to 155 eV and 98 eV to 105 eV. XPS software was used to perform data processing and analysis, the overall spectrum was shifted to fix the contribution of C-C in the C1s spectra at 284.8 eV.
2.2.8. Wettability analysis
The surface wettability of BCS, UA-NFC, MT-NFC, CA-NFC, and OA-NFC was evaluated through the water contact angle test using an Easy-Drop Standard goniometer DSA 100 (Krüss GmbH, Hamburg, Germany) equipped with a camera and analysis software. The BCS, UA-NFC, MT-NFC, CA-NFC, and OA-NFC powder were compressed to disk using a normal hydraulic compress machine. The average values of contact angle for each sample were calculated by 5 specimens with a drop of 5 µL of distilled water on the sample surface.
2.2.9. X-ray diffraction (XRD)
Crystallization properties of NFC with different surface functionalizations were characterized using a Bruker AXS diffractometer (Model D8 Advance, USA) attached with a Cu Kα radiation source (40 kV and 40 mA). The diffraction intensities were recorded between 5° and 40° (2θ angle range) with a scan rate of 0.1 °/min. The degree of crystallinity (Xr) was examined using Eq. (1) by employing Jade 6.0 software:

Where Xr (%) refers to the degree of crystallinity; Sc and Sa indicate the areas of the crystal peak and noncrystal hump, respectively (Tian, Y. et al., 2022).
2.2.10. Thermogravimetric analysis (TGA)
Thermogravimetric analysis (TGA) of the raw CS, BCS, and NFCs with different treatments was studied using the STA 2500 Rgulus thermogravimetric analyzer (Netzsch, Germany). Approximately 10.00 mg of the sample was placed into an alumina crucible; the heating temperature range was 30°C − 550°C at a heating rate of 10°C/min under a nitrogen flow rate of 20 mL/min. An empty alumina crucible was used as a reference.
3.1. Micromorphology analysis of NFC
The morphological features of UA-NFC, OA-NFC, CA-NFC, and MT-NFC are measured and verified by TEM characterization. Branch-liked and network-liked NFC are clearly seen in cellulose with different surface functionalizations. The main body of NFC presents a microfibril feature attached to a large number of nanofibrils. Figure 2a-b exhibit that the diameter of UA-NFC and OA-NFC is in the range of 20–26 nm (average of 23 nm), and nanofibrils are with favorable distribution without agglomeration. This phenomenon is owing to the charge repulsion created by the amide groups and carboxyl groups on the surface of UA-NFC and OA-NFC (Henschen et al., 2019). Additionally, the UA-NFC and OA-NFC show better dispersion in water than the CA-NFC and MT-NFC. These aggregations in the CA-NFC and MT-NFC corresponded presumably to the high specific surface area, and strong hydrogen bonds existed between the nanowhiskers. As a consequence, bundles of elementary nanofibrils bind together and generate a larger dimension (Ca. 3–5 µm).
To gain further insights of the NFC structures, AFM measurements are utilized (Henschen et al., 2019). Figure 2e exhibits the characteristics of CS in that several small particles are agglomerated side-by-side, and no cellulose microfibrils can be found. Because of the high-speed shearing of homogenization, the winding-liked and network-liked nanofibrils with high length-diameter ratios are shown in Fig. 2b-d. This is consistent with that observed in SEM for the same sample. Micrographs of the UA-NFC, CA-NFC, and OA-NFC show that the material consists of nanofibrils with average lengths of 2.06 µm, 1.32 µm, and 1.21 µm, average widths of 0.41 nm, 0.45 nm, and 0.46 nm. Compared with UA-NFC, the CA-NFC and OA-NFC samples are finer and shorter. This could be due to acidification, which decreases the surface polarity of microcrystalline cellulose and segregates the interactions between them. This, in turn, promotes the nanofibrillation process, which is consistent with the results from earlier reports (Henschen et al., 2019). They attributed the fact that the acid environment not only dissolves amorphous molecules but also partly destroys crystalline zones of the fibrils, ultimately resulting in a length-shortening of nanofibrils (Li, D. et al., 2020).
The microstructures of raw CS, and the freeze-dried BCS, UA-NFC, OA-NFC, CA-NFC, and MT-NFC are shown in Fig. 3. A more rough and uneven surface morphology of untreated corn stalks is observed in Fig. 3a. Cracks, small pores, micro-voids (as shown in the upper right), and helical fibrils corresponding to the vessel, xylem tissue, and parenchyma (including cellulose, hemicellulose, pectin, lignin, and other impurities) can be seen on the surface of raw CS (Li, Z. et al., 2020). In addition, it also shows the presence of wax and oils on the surface of the CS, which provides a protective layer (as shown in the bottom left). As shown in Fig. 3b, cellulose microfiber bundles tend to be loose due to the disintegration of the overall structure of cell walls. It indicates the removal of hemicellulose and lignin with the bleaching treatment (Chen et al., 2016). Impurities on the surface of the BCS are also completely removed, exhibiting a partially streaked feature of the fibrils (as shown in the bottom left). This feature facilitates mechanical exfoliation of nanofibrils, as reported by Thien et al. (2022), who reported a similar observation when pineapple leaves were bleached with alkaline hydrogen peroxide solution. Additionally, the surface of BCS shows numerous tiny pores and openings. These voids are generated by the dissolution and leaching out of cohesive components like hemicellulose, lignin, and waxes during the bleaching process. The voids produced on the surface of BCS will provide great mechanical anchoring and interlocking of the cellulose with a polymer matrix (Kumar et al., 2014).
After intensive mechanical shearing treatment (see Fig. 3c-f), the fiber bundles are disaggregated into microfibrils associated with abundant branched and networked cellulose nanofibrils. This means that a large number of nanofibrils are produced, while the overall structure of the microfibrils is not completely disintegrated. This uniquely structured nanocellulose, NFC, was found to have excellent mechanical properties in our previous study (Tian, J. et al., 2022; Xu et al., 2021). As can be seen in Fig. 3c, urea/alkali treatment results in the separation of fiber bundles. Each microfibril can be considered as a bundle of cellulose whiskers linked along the nanofibrils by amorphous domains. The amorphous regions act as structural defects and are responsible for the transverse cleavage of the microfibrils into nanofibrils. This is different from nanocellulose materials such as cellulose nanocrystals, cellulose nanowhiskers, etc. NFC has a partially amorphous structure, which will be characterized in the crystalline structure analysis below (Cheng et al., 2018). The surface morphology of the oxalic/citric acid treated cellulose (OA-NFC/CA-NFC) is shown in Fig. 3d-e. Some nanofibrils with lengths below the micrometer range can be seen therein. The morphology of the OA-NFC/CA-NFC was a slightly entangled nanofibrils network with overall diameters below 200 nm under organic acid hydrolysis. Chen et al. (2016) reported a similar feature of the oxalic acid treated NFC, and attributed it to the fact that acid hydrolysis substantially facilitated mechanical fibrillation of the resultant BCS due to the reduced molecular weight. Nanofibrils on the mercaptopropyl trimethoxysilane treated NFC in Fig. 3f can be clearly seen, and the characteristic is similar to nanofibrillation by mechanical impact (Chen et al., 2019). Abundant nanofabrils are separated from the cell walls of different corn stalk tissues by high-speed shearing treatment (see in bottom left). But the length of the isolated nanofabrils appears to be shorter than that of the acid-base treatment, which will be confirmed in particle size analysis. Consequently, the results shown in Fig. 3a-f suggest that the hyper nanofibrillating of cellulose occurs during the high-speed shearing process. Cellulose suspension passes through the tiny gap between the shearing knives, subjecting the cellulose fibers to tough shear and impact forces. Generally, the unique morphology (branch-like and/or network-like) of NFC is successfully obtained from corn stalks by mechanical treatment. In the four functionalized environments, the size and morphology of NFC nanofibrils are slightly different.
Silanization of cellulose surfaces can effectively improve its interfacial compatibility. This study expects to use a one-pot method to achieve the purpose of NFC preparation and surface functionalization. The uniformity of silanization modification is shown in Fig. 3g-k. The EDS spectrum (Fig. 3g) shows that the surface of MT-NFC mainly consists of C, O, Si and S. Among them, C and O are mainly derived from cellulose, and Si and S mainly come from silane coupling agents. Figure 3h-k shows the EDS elemental mapping images of C, O, Si, and S, respectively. As a consequence, surface silane functionalization of NFC is successfully realized. In addition, the valence bond of Si element will be analyzed in XPS results.
3.2. Surface functionalization of the NFC
3.2.1. FTIR characterization
The FTIR spectra of raw material and chemically functionalized samples are shown in Fig. 4. The wide band between 3450 cm− 1 and 3420 cm− 1 is ascribed to the O-H stretching vibrations. The peak near 2900–2925 cm− 1 in all spectra corresponds to the stretching vibration of the aliphatic saturated C-H group. The peak at 894–898 cm− 1 reflects the C-H bending vibration connecting with the glucose β-glycoside bond in cellulose I, which is contained in the nanofibrils and/or microfibrils (Thien et al., 2022). The characteristic peaks at 3420–3450 cm− 1, 2900–2925 cm− 1, and 894–898 cm− 1 are observed in the 4 surface-modified NFC, indicating that there are no changes in the basic chemical structure of cellulose (Sungsinchai et al., 2022). Notably, the peak at 1730 cm− 1 in the raw CS corresponds to the C = O stretching vibration of the acetyl and uronic ester groups from hemicellulose and lignin (Wang et al., 2022). The peak at 1510 cm− 1 of the raw CS represents the C = C stretching vibration on the lignin. However, these peaks disappear after the 4 surface-modifications, indicating that hemicellulose and lignin were removed (Bozic et al., 2015).
More importantly, the band around 1635 cm− 1 in the UA-NFC is assigned to the -NH2 bending vibration. This suggests that the amidation reaction may have occurred on the cellulose surface, which can be further confirmed in XPS analysis. The hydroxide and urea mixed solution treatment could break the intermolecular and intramolecular hydrogen bonds between the nanofibrils, but also tailor the surface of cellulose under mechanochemical action.
The bands at 1714 cm− 1 correspond to the C = O vibration of the cellulose presented in OA-NFC, which demonstrates the surface carboxylation of cellulose. Three new absorption peaks at 2449 cm− 1, 1384 cm− 1, and 1065 cm− 1 are assigned respectively to COOH group and CH2 group vibration, C-O-C stretching vibration of CA-NFC, confirming the successful citric acid acidification process. The new absorption peak at 1429 cm− 1 is attributed to the vibration of C-H, the characteristic peak of CH2 group for MT-NFC. Peaks in spectra of MT-NFC around 1034 cm− 1 are attributed to Si-O-Si vibration. Combined with the above EDS mapping of Si and S elements, it is fully proved that the MT-NFC surface is silanized. Consequently, the results indicate that high-speed shearing treatment and chemistry modification promote surface functionalization of amidation, carboxylation, and silanization of NFC effectively.
3.2.2. XPS
XPS is further used to validate the surface functionalization and elucidate the reaction mechanism of NFC. Figure 5a-e shows the binding energy of C 1s, O 1s, Si 2s, and Si 2p. The chemical shifts of electron binding energy of C, O, Si can reflect the formation of key groups such as carbonyl, ester, and ether after the amidation, carboxylation, and silanization. Specifically, the binding energy of C attached to two oxygen atoms (O-C-O), which is the C1 of the glucopyran ring, shifts from 288 eV (BCS) to 287.7 eV (UA-NFC), 287.8 eV (OA-NFC), 287.9 eV (CA-NFC) and 287.6 eV (MT-NFC). This indicates an increase of the electron cloud density of the C1, which could be caused by the carboxylation of hydroxyl on the C2 and C6 (Zhang et al., 2020). Additionally, the new peaks appear at 288.9 eV, 289 eV, 289.1 eV on the C 1s spectra of the UA-NFC, OA-NFC, and CA-NFC respectively, which corresponds to the carbonyl peak and confirms the formation of the carboxyl group. Furthermore, on the spectrum of O 1s, the electron binding energy after surface functionalization appears to peak at 531.3 eV, 531.0 eV, 531.3 eV, respectively, which corresponds to the electron binding energy of C = O. These evidences indicate that NFC can achieve surface functionalization after treatment with urea/alkali, oxalic acid, and citric acid.
Following the pretreatment steps, another chemical functionalization involving silanization chemistry is performed on the BCS. As a representative example, mercaptopropyl trimethoxysilane for the modification of the hydroxyl groups on the surface of cellulose is conducted. The peaks at 152.68 eV and 101.68 eV in Fig. 5e3 and Fig. 5e4 correspond to the binding energy of Si 2s and Si 2p, which can be assigned to the generation of hydrogen bonds between hydroxyl groups and silane coupling agent. As a result, the surface hydrophilicity of NFC is modified while possessing silane functional groups such as mercapto groups in this case. Silanized MT-NFC has good interfacial compatibility with rubber and polylactic acid, which can greatly improve the mechanical properties of composites (Ma et al., 2018; Qian and Sheng, 2017).
3.2.3. Water contact angle
Figure 4b shows the surface hydrophilicity of the BCS and different NFCs. The water contact angle of urea/alkali-treated cellulose is lower than that of BCS. The FTIR and XPS results indicate that amide groups appear on the NFC surface after urea/alkali treatment. The electronegativity of the amide group is stronger than that of the hydroxyl group, causing the water contact angle to drop to
33.7º. This indicates that a large number of hydroxyl groups on the surface of UA-NFC underwent an amidation reaction (Golizadeh et al., 2019). The treatment of oxalic acid and citric acid is beneficial to increase the water contact angle and improve the hydrophobicity of the NFCs, which might due to the carboxyl group generated from the carboxylation reaction. The difference is that the number of hydroxyl groups on the NFC surface after oxalic acid modification is theoretically less than that after citric acid modification. In fact, the water contact angle of CA-NFC is 6.4° smaller than that of OA-NFC. In addition, the water contact angle of MT-NFC is similar to the BCS, which can be attributed to the sulfhydryl and hydroxyl groups on silanes. These results show that current preparation strategy can not only improve the hydrophobicity but also the hydrophilicity of cellulose, exhibiting excellent flexibility, selectability and adjustability.
3.3. X-ray diffraction
The X-ray diffraction patterns of corn stalks, BCS, UA-NFC, OA-NFC, CA-NFC, and MT-NFC are depicted in Fig. 5a. The raw material and chemically treated samples have peaks at 2θ = 14.9°, 16.2°, 22.4°, and 34.6°, which are the characteristic peaks of cellulose, indicating that the basic structure of cellulose is maintained, the cellulose I allomorph of neat NFCs are also proved by XRD measurements (Wang et al., 2018). The Xr is determined for the various samples using Eq. (1) and the results for the corn stalks, BCS, UA-NFC, OA-NFC, CA-NFC and MT-NFC are 45.0%, 50.6%, 48.2%, 75.1%, 54.3% and 58.8%, respectively. The higher crystallinity of BCS can be ascribed to the progressive removal of hemicellulose, lignin, and other amorphous fraction of cellulose induced by bleaching treatments. Cellulose has a crystalline structure because of hydrogen bonding interactions and Van der Waals forces between adjacent molecules (Wu et al., 2020). The lightly decrease in crystallinity of UA-NFC compared to BCS may be attributed to the fact that surface urea/alkali consumed partly hydrogen bonds and reduced intermolecular forces. The subsequent high increase in crystallinity of the OA-NFC, CA-NFC, and MT-NFC in relation to BCS is observed. The high-speed shearing treatment could disintegrate the amorphous regions of cellulose and trigger the cleavage of glycosidic bonds, which eventually releases more individual crystallites, meaning an increase in the size of the cellulose I crystallites in UA-NFC, OA-NFC, CA-NFC, and MT-NFC. This could be seen from the comparison of BCS and UA-NFC, OA-NFC, CA-NFC, and MT-NFC in the width of the (200) planes (Wu et al., 2020). By contrast, OA-NFC displays the narrowest and sharpest peaks at 2θ = 22.4° due to its higher crystallinity compared to other samples. This implies that oxalic acid easily enters the interior of cellulose and separates nanofibrils.
3.4. Thermal properties of CS, BCS and NFCs
|
samples |
T10%(℃) |
T25%(℃) |
T50%(℃) |
TDTGmax(℃) |
R550(%) |
|---|---|---|---|---|---|
|
CS |
94.2 |
274.9 |
320.2 |
314.1 |
21.55 |
|
BCS |
276.0 |
322.0 |
343.0 |
348.8 |
7.93 |
|
UA-NFC |
277.9 |
315.9 |
338.9 |
348.1 |
4.42 |
|
OA-NFC |
272.6 |
311.6 |
329.6 |
334.7 |
4.53 |
|
CA-NFC |
265.5 |
301.5 |
324.5 |
331.7 |
2.44 |
|
MT-NFC |
286.8 |
312.7 |
327.8 |
332.5 |
1.98 |
Figure 5b1-b2 show the TGA and derivative thermogravimetry (DTG) curves obtained from corn stalk, BCS, UA-NFC, OA-NFC, CA-NFC, and MT-NFC. Thermal degradation of raw CS, BCS, and the various NFCs with different treatments is detected by TGA to determine the onset temperature and the maximum degradation temperature of the main mass-loss regions (see Table 1). Three different mass-loss regions can be observed (Fig. 5). The initial weight loss of the samples occurs below 100°C, which can be attributed to the reduction of moisture content in lignocellulose fibers. With the temperature increase, the main degradation step corresponds basically to cellulose decomposition, such as depolymerization, dehydration, and pyrolysis of glycosyl units. The last degradation step (above 485°C) is associated with the oxidation and breakdown of the charred residue to lower molecular weight gaseous products.
A small shoulder from CS sample (Fig. 5b2) can be noticed forward of the main degradation peak, which is due to the thermal decomposition of wax, pectin, hemicellulose, and lignin. After removal of hemicellulose and lignin, the BCS, UA-NFC, OA-NFC, CA-NFC, and MT-NFC exhibit single thermal mass loss peaks. The second main mass-loss region (340–350°C) of BCS could be related to the dehydration of cellulose. In fact, it slightly diminishes after surface functionalization and nanofibrillation, indicating that the thermal stability of cellulose decreased after modification. This may be due to the crystalline area of cellulose in the BCS is destroyed during the 4 different treatment processes. The disorder and accessibility of cellulose increase so that the branched and networked nanofibrils on NFC surfaces are easily pyrolyzed. Among them, the sharpest weight drop is observed for MT-NFC, which can be rationalized in light of its relatively short nanofibrils exposed to thermal pyrolysis. The mass residue at temperatures 500–600°C in CS is remarkably high at 21.55%. However, less charred residue of BCS than that of CS is due to the fact that non-cellulosic material could induce higher char formation (Chen et al., 2016). The lowest residue of MT-NFC verifies its high purity. These results are consistent with the findings obtained from the chemical composition, morphology, and structure measurements.
3.5. Solution stability
The ability of the NFCs to form stable suspensions or gels in water is evaluated by qualitatively analyzing the sedimentation rate of the suspensions. As shown in Fig. 5c, it presents the NFC suspensions at 0.2 wt% for 0 min, 15 min, 30 min, 1 h, and 12 h, respectively. With the increase in standing time, the suspension starts to separate. Among them, BCS aqueous suspension is more translucent at different periods, and the particles precipitate very quickly. Referring to the literature (Ji et al., 2019), the higher the content of nanofibrillated material, the more intensive is the transparency of the NFC. Conversely, OA-NFC aqueous suspensions are more uniform and stable. OA-NFC has better nanodispersion in water because the surface carboxylate enhances the homogenous dispersion property and stability of the nanofibers in water.
3.6. Surface functionalization mechanism
The functionalization and modification mechanisms of hydroxyl-grafted amides (urea/NaOH), carboxyl groups (oxalic acid/citric acid), and hydrogen bonds (mercaptopropyl trimethoxysilane) on the NFC surface are suggested and discussed (Fig. 5d). First, NFC is chemically modified with urea in the presence of sodium hydroxide, the cellulose is swollen in concentrated sodium hydroxide solution that destroyed the crystalline aggregation of cellulose and increased the accessibility of fibers to chemicals. Thereafter, through a nucleophilic substitution reaction between alkalized cellulose and urea, UA-NFC was synthesized. This was also corroborated in XPS and FT-IR. The band around 1635 cm− 1 in the UA-NFC is assigned to the -NH2 bending vibration and the electron binding energy of C = O from urea. In addition, carboxylation of NFC is confirmed in the presence of oxalic acid, and citric acid during mechanical treatment. Due to the crystalline structure, it is difficult for the acid to fully penetrate into cellulose fibers. The carboxylation is most likely to occur on C6-OH due to its greater steric accessibility than C2-OH and C3-OH (Henschen et al., 2019). Citric acid and oxalic acid functionalize cellulose by reacting with C6-OH, the C = O electron energy binding peak appeared in XPS as well as the C = O vibration of the carboxyl group appeared in FT-IR, which confirms the above reaction mechanism. Finally, mercaptopropyl trimethoxysilane is added to water for hydrolysis, and acetic acid is added to adjust the pH to weak acidic, which shortens the hydrolysis period. After hydrolysis, the NFC is uniformly dispersed into a silane solution. As a result, etherification occurs with the hydroxyl groups on the NFC surface, and MT-NFC is prepared. Meanwhile, the spectra of Si 2s and Si 2p could be the evidence in XPS.
A simple, energy saving and promising one-step method was developed to produce highly crystalline NFC with tailored surface functions. Nanofibrils could be peeled off from the surface of bleached corn stalk particles under the action of strong mechanical shearing force. The novel NFC presented microfibril features attached with a large number of branch-liked and network-liked nanofibrils. Although NFC contained partially amorphous regions, the overall crystallinity was elevated. Additionally, NFC surfaces were successfully functionalized by amidation, carboxylation, and silanization reaction, respectively. Hydrophilicity of NFC surfaces can be tuned. The hydroxyl groups on the cellulose were modified by grafting amide (urea/NaOH), carboxyl (oxalic acid/citric acid), and hydrogen bonds (mercaptopropyl trimethoxysilane), respectively. The thermal stability and solution stability of NFC are improved after nanofibrillation and surface modification. In particular, OA-NFC aqueous suspensions showed excellent stability. This one-step strategy is expected to open the way towards toxic chemicals free, energy saving, and cost-effective production of nanocellulose from crop residues.
Ethical approval and consent to participate
The article does not include human participants and/or animals research.
Consent for publication
All authors gave their consent for publication.
Availability of data and materials
Data will be made available on request.
Competing interests
The authors declare that they have no known competing financial interests or personal relationships that could have appeared to influence the work reported in this paper.
Funding
This work was financially supported by the Fund for Scientific Research in the Public Interest of Ningbo (No. 2021S067 and 2022S150), the Foundation of the Department of Education of Zhejiang Province (Y202148281).
Author’s contributions
Jiarong Tian and Jing Chen: Investigation, Data Curation, Writing-Original Draft, Visualization, Funding. Zhaoyan Zhang and Yi Wan: Writing - Review & Editing, Supervision. Shaoping Qian: Writing-Review & Editing, Supervision, Funding.
Acknowledgments
The authors also thank Mr. Cesar A. Fontanillo Lopez, affiliated with KU-Leuven Center for IT and IP Law, for the language review.
- Babaei-Ghazvini, A., Acharya, B., Korber, D.R., 2022. Multilayer photonic films based on interlocked chiral-nematic cellulose nanocrystals in starch/chitosan. Carbohydr Polym 275:18709. https://doi.org/10.1016/j.carbpol.2021.118709
- Barbosa, B.M., Vaz, S., Colodette, J.L., de Aguiar, A.R., Cabral, C.P.T., de Freitas Homem de Faria, B., 2022. Structural and chemical characterization of lignin and hemicellulose isolated from corn fibers toward agroindustrial residue valorization. Cellulose 29:8117–8132. https://doi:10.1007/s10570-022-04769-2
- Beluns, S., Platnieks, O., Gaidukovs, S., Starkova, O., Sabalina, A., Grase, L., Thakur, V.K., Gaidukova, G., 2021. Lignin and Xylan as Interface Engineering Additives for Improved Environmental Durability of Sustainable Cellulose Nanopapers. Int J Mol Sci 22. https://doi.org/10.3390/ijms222312939
- Bozic, M., Vivod, V., Kavcic, S., Leitgeb, M., Kokol, V., 2015. New findings about the lipase acetylation of nanofibrillated cellulose using acetic anhydride as acyl donor. Carbohydr Polym 125:340–351. https://doi.org/10.1016/j.carbpol.2015.02.061
- Chen, J.H., Liu, J.G., Su, Y.Q., Xu, Z.H., Li, M.C., Ying, R.F., Wu, J.Q., 2019. Preparation and properties of microfibrillated cellulose with different carboxyethyl content. Carbohydr Polym 206:616–624. https://doi.org/10.1016/j.carbpol.2018.11.024
- Chen, L., Zhu, J.Y., Baez, C., Kitin, P., Elder, T., 2016. Highly thermal-stable and functional cellulose nanocrystals and nanofibrils produced using fully recyclable organic acids. Green Chem 18:3835–3843. https://doi.org/10.1039/C6GC00687F
- Cheng, L., Zhang, D., Gu, Z., Li, Z., Hong, Y., Li, C., 2018. Preparation of acetylated nanofibrillated cellulose from corn stalk microcrystalline cellulose and its reinforcing effect on starch films. Int J Biol Macromol 111:959–966. https://doi.org/10.1016/j.ijbiomac.2018.01.056
- Douglass, E.F., Avci, H., Boy, R., Rojas, O.J., Kotek, R., 2017. A Review of Cellulose and Cellulose Blends for Preparation of Bio-derived and Conventional Membranes, Nanostructured Thin Films, and Composites. Polym Rev 58:102–163. https://doi.org/10.1080/15583724.2016.1269124
- Fourati, Y., Magnin, A., Putaux, J.L., Boufi, S., 2020. One-step processing of plasticized starch/cellulose nanofibrils nanocomposites via twin-screw extrusion of starch and cellulose fibers. Carbohydr Polym 229:115554. https://doi.org/10.1016/j.carbpol.2019.115554
- Gao, B., Yang, J., Zhang, S., Li, X., 2021. Green fabrication of thermally-stable oxidized cellulose nanocrystals by evolved Fenton reaction and in-situ nanoreinforced thermoplastic starch. Cellulose 28:8405–8418. https://doi:10.1007/s10570-021-04039-7
- Golizadeh, M., Karimi, A., Gandomi-Ravandi, S., Vossoughi, M., Khafaji, M., Joghataei, M.T., Faghihi, F., 2019. Evaluation of cellular attachment and proliferation on different surface charged functional cellulose electrospun nanofibers. Carbohydr Polym 207:796–805. https://doi.org/10.1016/j.carbpol.2018.12.028
- Henschen, J., Li, D., Ek, M., 2019. Preparation of cellulose nanomaterials via cellulose oxalates. Carbohydr Polym 213:208–216. https://doi.org/10.1016/j.carbpol.2019.02.056
- Hong, S., Song, Y., Yuan, Y., Lian, H., Liimatainen, H., 2020. Production and characterization of lignin containing nanocellulose from luffa through an acidic deep eutectic solvent treatment and systematic fractionation. Ind Crop Prod 143:111913. https://doi.org/10.1016/j.indcrop.2019.111913
- Hou, Y., Wu, W., 2022. Derived from corn straw cellulose: modified used tire rubber powder composites. Cellulose 29:3935–3945. https://doi:10.1007/s10570-022-04549-y
- Huang, J., Du, Y., Bao, T., Lin, M., Wang, J., Yang, S.T., 2019. Production of n-butanol from cassava bagasse hydrolysate by engineered Clostridium tyrobutyricum overexpressing adhE2: Kinetics and cost analysis. Bioresour Technol 292:121969. https://doi.org/10.1016/j.biortech.2019.121969
- Ji, H., Xiang, Z., Qi, H., Han, T., Pranovich, A., Song, T., 2019. Strategy towards one-step preparation of carboxylic cellulose nanocrystals and nanofibrils with high yield, carboxylation and highly stable dispersibility using innocuous citric acid. Green Chem 21:1956–1964. https://doi.org/10.1039/C8GC03493A
- Jiang, B., Chen, C., Liang, Z., He, S., Kuang, Y., Song, J., Mi, R., Chen, G., Jiao, M., Hu, L., 2019. Lignin as a Wood-Inspired Binder Enabled Strong, Water Stable, and Biodegradable Paper for Plastic Replacement. Adv Funct Mater 30:1906307. https://doi.org/10.1002/adfm.201906307
- Jiang, J., Chen, H., Yu, J., Liu, L., Fan, Y., Saito, T., Isogai, A., 2021. Rate-Limited Reaction in TEMPO/Laccase/O2 Oxidation of Cellulose. Macromol. Rapid Commun 42:e2000501. https://doi.org/10.1002/marc.202000501
- Kumar, V., Bollström, R., Yang, A., Chen, Q., Chen, G., Salminen, P., Bousfield, D., Toivakka, M., 2014. Comparison of nano- and microfibrillated cellulose films. Cellulose 21:3443–3456. https://doi.org/10.1007/s10570-014-0357-5
- Li, D., Wang, Y., Long, F., Gan, L., Huang, J., 2020. Solvation-Controlled Elastification and Shape-Recovery of Cellulose Nanocrystal-Based Aerogels. Acs Appl Mater Inter 12:1549–1557. https://doi.org/10.1021/acsami.9b18569
- Li, T., Chen, C., Brozena, A.H., Zhu, J.Y., Xu, L., Driemeier, C., Dai, J., Rojas, O.J., Isogai, A., Wagberg, L., Hu, L., 2021. Developing fibrillated cellulose as a sustainable technological material. Nature 590:47–56. https://doi.org/10.1038/s41586-020-03167-7
- Li, Z., Chen, C., Mi, R., Gan, W., Dai, J., Jiao, M., Xie, H., Yao, Y., Xiao, S., Hu, L., 2020. A Strong, Tough, and Scalable Structural Material from Fast-Growing Bamboo. Adv Mater 32:e1906308. https://doi.org/10.1002/adma.201906308
- Ma, Y., Qian, S., Hu, L., Qian, J., Fontanillo Lopez, C.A., Xu, L., 2018. Mechanical, thermal, and morphological properties of PLA biocomposites toughened with silylated bamboo cellulose nanowhiskers. Polym Composite 40:3012–3019. https://doi.org/10.1002/pc.25144
- Meng, F., Wang, G., Du, X., Wang, Z., Xu, S., Zhang, Y., 2019. Extraction and characterization of cellulose nanofibers and nanocrystals from liquefied banana pseudo-stem residue. Compos Part B-Eng 160:341–347. https://doi.org/10.1016/j.compositesb.2018.08.048
- Omran, A.A.B., Mohammed, A., Sapuan, S.M., Ilyas, R.A., Asyraf, M.R.M., Rahimian Koloor, S.S., Petru, M., 2021. Micro- and Nanocellulose in Polymer Composite Materials: A Review. Polymers 13. https://doi.org/10.3390/polym13020231
- Qian, S., Sheng, K., 2017. PLA toughened by bamboo cellulose nanowhiskers: Role of silane compatibilization on the PLA bionanocomposite properties. Compos Sci Technol 148:59–69. https://doi.org/10.1016/j.compscitech.2017.05.020
- Rana, A.K., Frollini, E., Thakur, V.K., 2021. Cellulose nanocrystals: Pretreatments, preparation strategies, and surface functionalization. Int J Biol Macromol 182:1554–1581. https://doi.org/10.1016/j.ijbiomac.2021.05.119
- Sungsinchai, S., Niamnuy, C., Wattanapan, P., Charoenchaitrakool, M., Devahastin, S., 2022. Spray drying of non-chemically prepared nanofibrillated cellulose: Improving water redispersibility of the dried product. Int J Biol Macromol 207:434–442. https://doi.org/10.1016/j.ijbiomac.2022.02.153
- Thien, D.V.H., Lam, D.N., Diem, H.N., Pham, T.Y.N., Bui, N.Q., Truc, T.N.T., Van-Pham, D.T., 2022. Synthesis of cellulose-g-poly(acrylic acid) with high water absorbency using pineapple-leaf extracted cellulose fibers. Carbohydr Polym 288:119421. https://doi.org/10.1016/j.carbpol.2022.119421
- Thongsomboon, W., Serra, D.O., Possling, A., Hadjineophytou, C., Hengge, R., Cegelski, L., 2018. Phosphoethanolamine cellulose: A naturally produced chemically modified cellulose. Science 359:334–338. https://doi.org/10.1126/science.aao4096
- Tian, J., Cao, Z., Qian, S., Xia, Y., Zhang, J., Kong, Y., Sheng, K., Zhang, Y., Wan, Y., Takahashi, J., 2022. Improving tensile strength and impact toughness of plasticized poly(lactic acid) biocomposites by incorporating nanofibrillated cellulose. Nanotechnol Rev 11:2469–2482. https://doi.org/10.1515/ntrev-2022-0142
- Tian, Y., Zhou, M., Luo, T., Zhu, P., Cheng, F., Zhang, Y., Lin, Y., 2022. A comparative investigation of gelatinized and regenerated starch composites reinforced by microfibrillated cellulose. Food chem 373:131470. https://doi.org/10.1016/j.foodchem.2021.131470
- Wang, W., Liang, T., Bai, H., Dong, W., Liu, X., 2018. All cellulose composites based on cellulose diacetate and nanofibrillated cellulose prepared by alkali treatment. Carbohydr Polym 179:297–304. https://doi.org/10.1016/j.carbpol.2017.09.098
- Wang, X., Pang, Z., Chen, C., Xia, Q., Zhou, Y., Jing, S., Wang, R., Ray, U., Gan, W., Li, C., Chen, G., Foster, B., Li, T., Hu, L., 2020. All-Natural, Degradable, Rolled‐Up Straws Based on Cellulose Micro‐ and Nano‐Hybrid Fibers. Adv Funct Mater 30:1910417. https://doi.org/10.1002/adfm.201910417
- Wang, Y., Wang, Q., Liu, S., Ji, X., Yang, G., Chen, J., 2022. Lipase induced highly hydrophobic nanofibrillated cellulose film for strain sensor application. Carbohydr Polym 284:119193. https://doi.org/10.1016/j.carbpol.2022.119193
- Wu, J., Zhu, W., Shi, X., Li, Q., Huang, C., Tian, Y., Wang, S., 2020. Acid-free preparation and characterization of kelp (Laminaria japonica) nanocelluloses and their application in Pickering emulsions. Carbohydr Polym 236:115999. https://doi.org/10.1016/j.carbpol.2020.115999
- Xu, L., Zhao, J., Qian, S., Zhu, X., Takahashi, J., 2021. Green-plasticized poly(lactic acid)/nanofibrillated cellulose biocomposites with high strength, good toughness and excellent heat resistance. Compos Sci Technol 203:108613. https://doi.org/10.1016/j.compscitech.2020.108613
- Yang, J., Lu, X., Zhang, Y., Xu, J., Yang, Y., Zhou, Q., 2020. A facile ionic liquid approach to prepare cellulose fiber with good mechanical properties directly from corn stalks. Green Energy Environ 5:223–231. https://doi.org/10.1016/j.gee.2019.12.004
- Yang, X., Biswas, S.K., Han, J., Tanpichai, S., Li, M.C., Chen, C., Zhu, S., Das, A.K., Yano, H., 2021. Surface and Interface Engineering for Nanocellulosic Advanced Materials. Adv Mater 33:e2002264. https://doi.org/10.1002/adma.202002264
- Yokesahachart, C., Yoksan, R., Khanoonkon, N., Mohanty, A.K., Misra, M., 2021. Effect of jute fibers on morphological characteristics and properties of thermoplastic starch/biodegradable polyester blend. Cellulose 28:5513–5530. https://doi:10.1007/s10570-021-03921-8
- Zhang, D.Y., Zhang, X.Q., Yao, X.H., Wan, Y., Song, P., Liu, Z.Y., Fu, Y.J., 2020. Microwave-assisted synthesis of PdNPs by cellulose solution to prepare 3D porous microspheres applied on dyes discoloration. Carbohydr Polym 247:116569. https://doi.org/10.1016/j.carbpol.2020.116569
- Zheng, C., Lu, K., Lu, Y., Zhu, S., Yue, Y., Xu, X., Mei, C., Xiao, H., Wu, Q., Han, J., 2020. A stretchable, self-healing conductive hydrogels based on nanocellulose supported graphene towards wearable monitoring of human motion. Carbohydr Polym 250:116905. https://doi.org/10.1016/j.carbpol.2020.116905
No competing interests reported.