Identification of DElncRNAs, DEmiRNAs and DEmRNAs
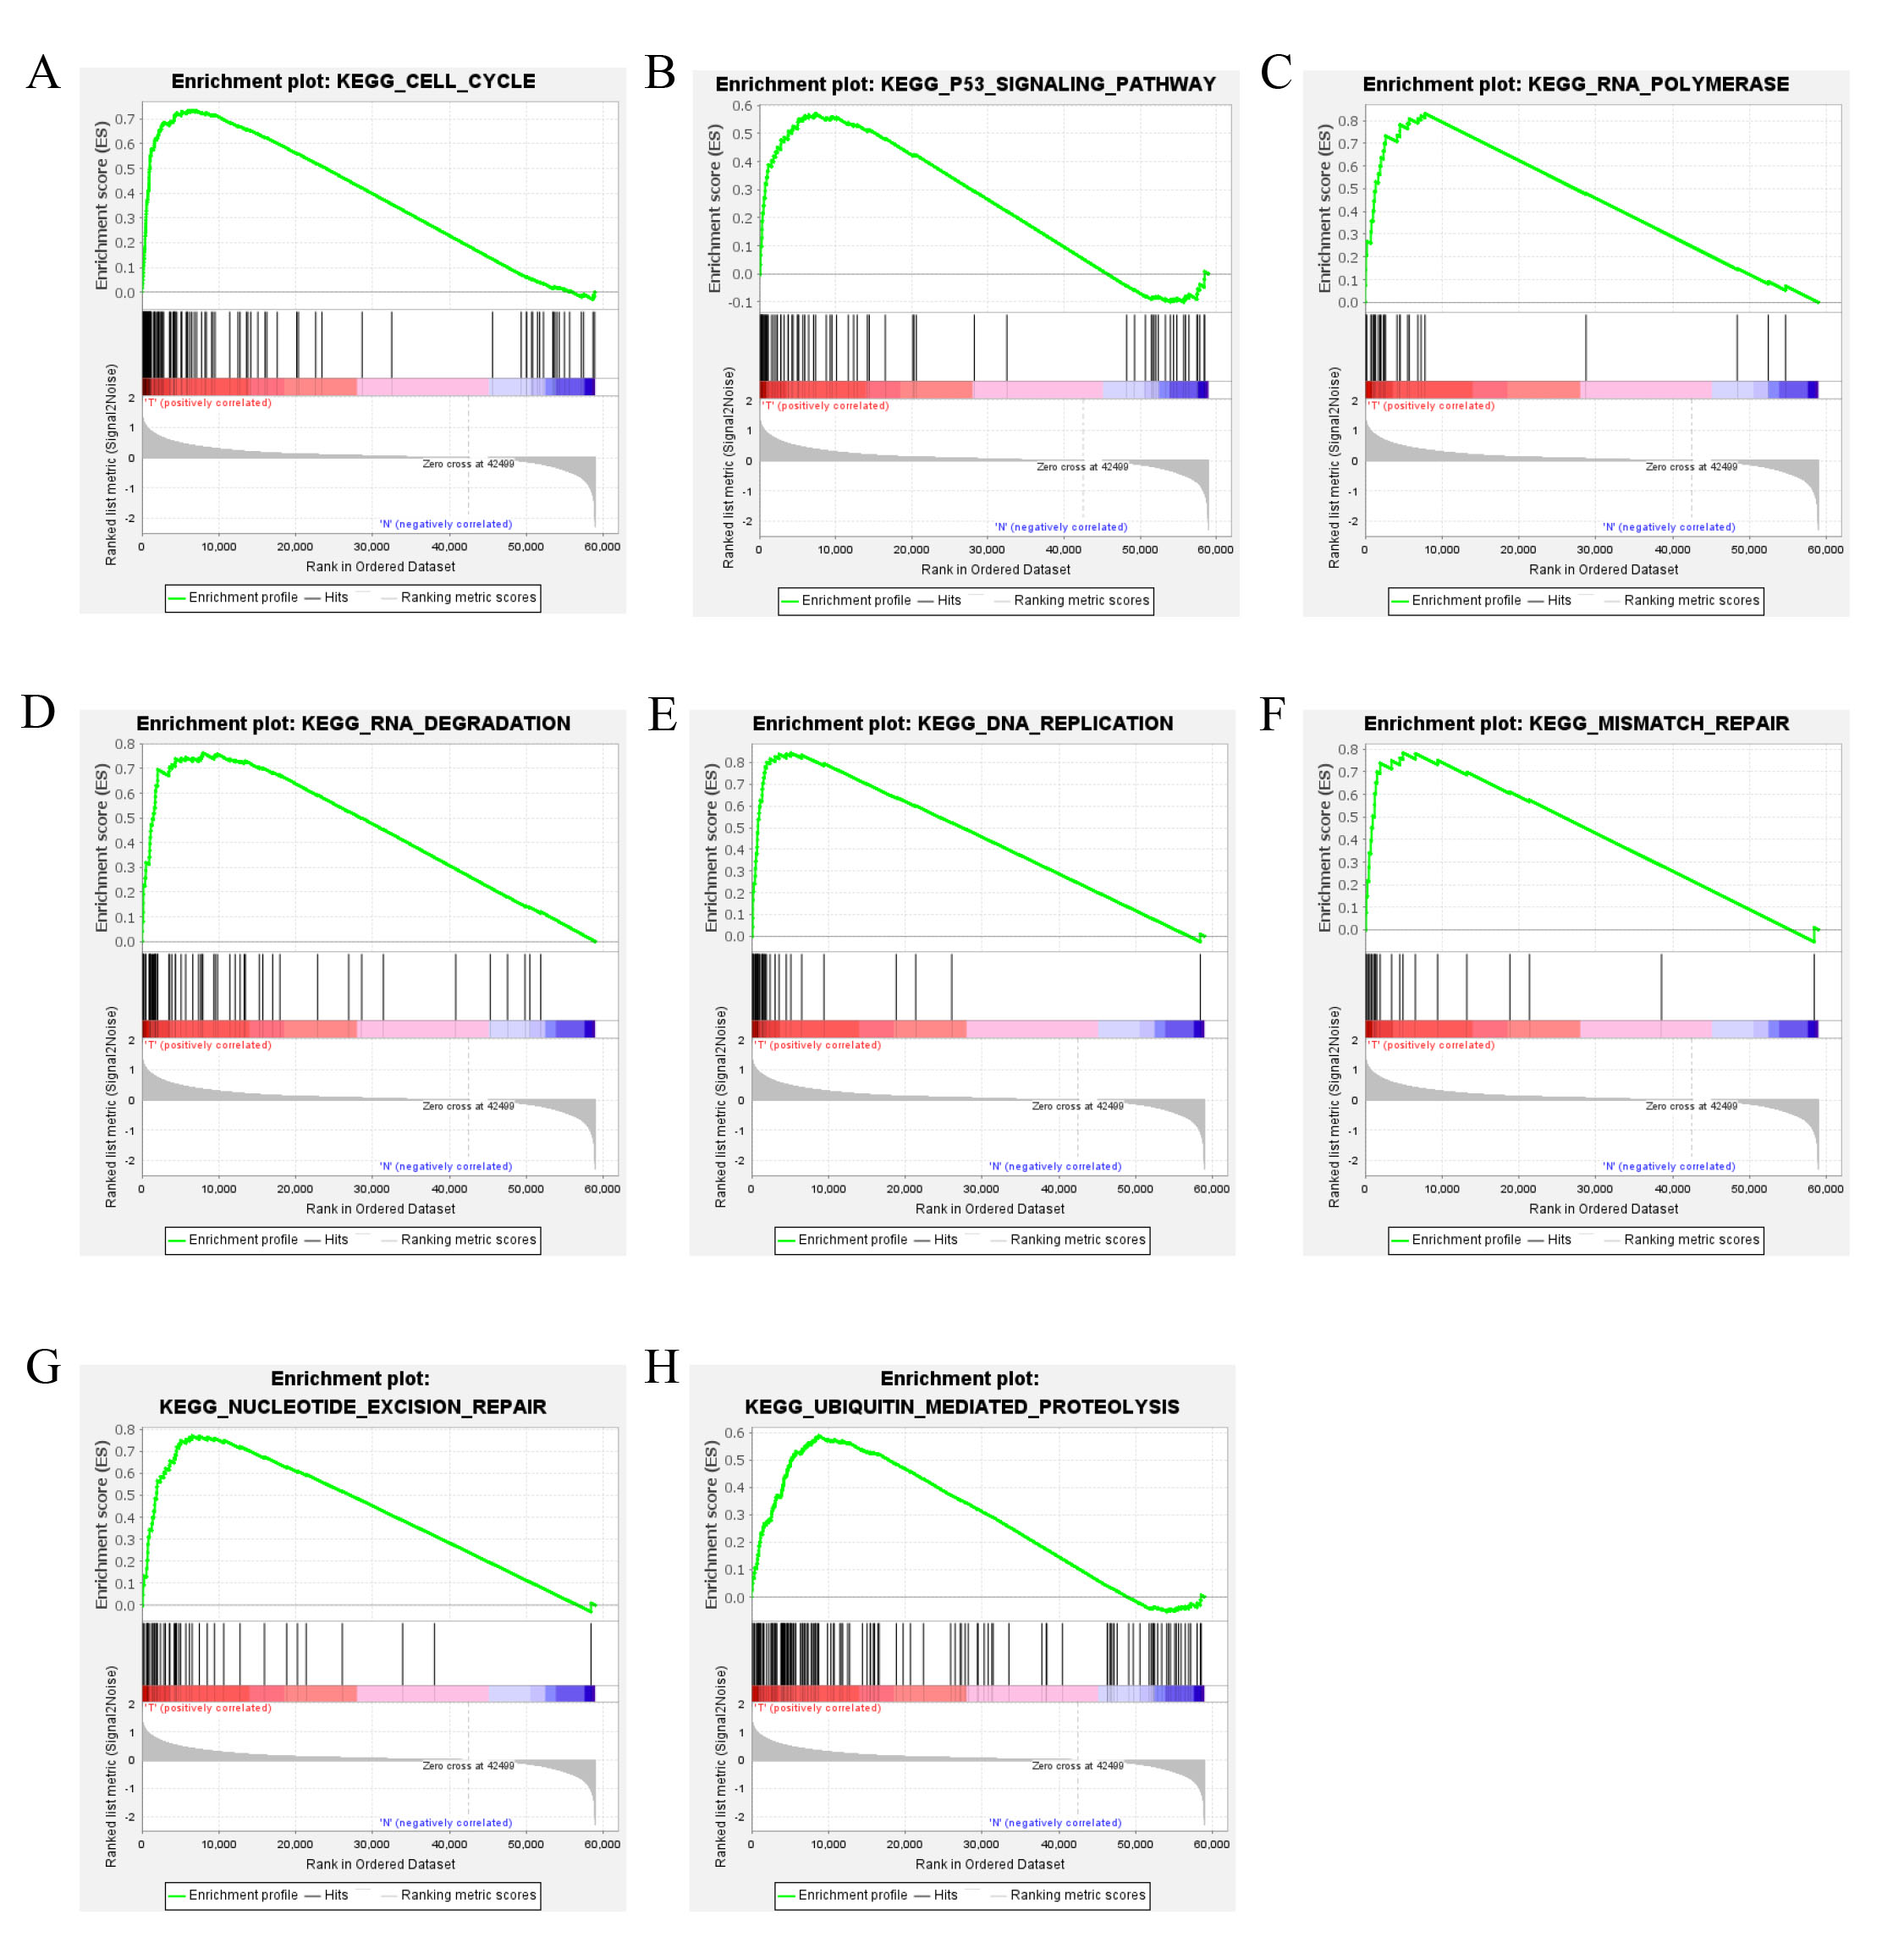
The TCGA RNA-seq expression dataset contains lncRNAs and mRNAs obtained from 458 COAD samples and 41 adjacent normal samples. And the miRNA-seq expression dataset is from 446 COAD samples and 8 adjacent normal samples. GSEA software was used for pathway enrichment analysis to further explore the pathways associated with the gene expression matrix (Supplementary Fig. 1). Compared with RNAs in normal samples, 3222 DEmRNAs (1691 upregulated and 1531 downregulated), 190 DElnRNA (183 upregulated and 107 downregulated), and 192 DEmRNAs (104 upregulated and 88 downregulated) were identified using a rigorous threshold of |log2 FC| > 1.0 and p-vaule < 0.05. Volcano plots and heatmap analyzes were then used to visualize these DERNAs, which are shown in Fig. 2.
Construction of ceRNA networks
Using a rigorous threshold of |log2 FC| > 2.0 and P-vaule < 0.05 as screening criteria, we obtained a total of 50 DElncRNAs,135 DEmiRNAs and 821 DEmRNAs. The lncATLAS and LncACTdb3.0 databases were used for the subcellular localization of DElncRNA. The results show that 17 DElncRNAs are located only in the cytoplasm and 94 DElncRNAs are exhibited in the nuclear and cytoplasm. The DEmiRNAs were entered into Starbase to predict the lncRNAs, and then the predicted results were crossed with DElncRNA to obtain 12 lnRNAs. We used seven online databases to predict the target genes of DEmiRNAs. According to the screening criteria, we obtained a total of 191 mRNA. Finally, a total of 12 lncRNAs, 43 miRNAs, and 189 mRNAs were included in the COAD-associated ceRNA network. According to the prediction results, the ceRNA network, which comprised 244 nodes and 717 edges, was constructed using Cytoscape (Supplementary Table S1 and Fig. 3A).
GO and KEGG enrichment of target genes
To further clarify the biological functions and pathways associated with the ceRNA network, Gene Ontology (GO) enrichment and Kyoto Encyclopedia of Genes and Genomes (KEGG) pathway enrichment analyzes were performed for the target genes in the COAD-associated ceRNA network using the g: Profiler (https://biit.cs.ut.ee/gprofiler/gost) database. The results were found to be statistically significant at P < 0.05. GO analysis showed that the target genes were mainly enriched in “Cellular developmental process”, “Cell differentiation”, “Cell development”, “Cell migration”, “Collagen-containing extracellular matrix”, “Extracellular matrix”, “Cytokine activity”, and “Signaling receptor binding”. The results of KEGG analysis showed that the genes were mainly enriched in “Cytokine-cytokine receptor interaction”, “Proteoglycans in cancer”, “PI3K-Akt signaling pathway”, and “IL-17 signaling pathway”(Fig. 3B).
Survival analysis of the ceRNA network-associated RNAs
To identify potential RNAs strongly associated with prognostic characteristics of COAD patients, K-M survival analysis and log-rank test were performed for each RNA to evaluate their contribution. Figure 4 shows the K-M survival curves of lncRNAs, miRNAs, and mRNAs that are closely related to survival prognosis (P < 0.05).
Construction and validation of the ceRNA network
Based on the survival analysis results, H19, hsa-miR-193b-3p and SIX4 were found to be significant for the prognosis of COAD patients. According to ceRNA mechanism theory, lncRNAs positively regulate mRNA expression by directly interacting with miRNA, so lncRNA positively correlates with mRNA. In the present study, the expression of H19 showed a positive correlation with the expression of SIX4. H19 and SIX4 were highly expressed in tumor tissues; however, hsa-miR-193b-3p was not (Fig. 5A). H19 could act as a sponge for hsa-miR-193b-3p and enhance the expression of SIX4. Thus, H19/hsa-miR-193b-3p/SIX4 was established as a ceRNA network. The target sites in the 3’ UTRs of H19 and SIX4 were predicted by Starbase for pairing with hsa-miR-193b-3p (Fig. 5B).
Construction and Validation of an H19/SIX4 Axis Prognostic Model
H19 and SIX4 were candidate RNAs for the construction of COAD-specific prognostic biomarkers. The expression of the two RNAs was divided into high- and low-risk groups based on the median, and K-M survival analysis showed that the OS of patients with high expression was lower than that of patients with low expression. High expression of H19 and SIX4 was a high risk factor for the prognosis of COAD patients [H19: hazard ratio (HR = 1.54), SIX4: hazard ratio (HR = 1.73)]. Time-dependent ROC curve analysis confirmed that H19 and SIX4 have a high prognostic value. The AUC of H19 for OS was 0.569 at 1 year, 0.589 at 2 years and 0.538 at 3 years, and the AUC of SIX4 for OS was 0.605 at 1 year, 0.596 at 2 years and 0.600 at 3 years. The results showed that SIX4 had a better prognostic value (Fig. 5C).
Validation of SIX4 Abnormally Expression
The above study showed that SIX4 had a good prognostic value in colorectal cancer patients. Therefore, we validated the abnormal expression of SIX4 in tumor and normal tissues. First, immunohistochemical (IHC) staining data obtained from the HPA database showed a higher level of SIX4 protein in COAD tissues than in normal tissues (Fig. 6A). We obtained the same result from the TCGA cohort and the GTEx cohort (308 normal samples, 41 adjacent normal samples and 290 tumor samples), and SIX4 was highly expressed in the tumor group (Fig. 6B). Then, the colorectal cancer datasets, including GSE25070 (26 normal samples and 26 tumor samples), GSE44076 (148 normal samples and 98 tumor samples), GSE37182 (88 normal samples and 84 tumor samples), and GSE39582 (19 normal samples and 566 tumor samples) were downloaded from the GEO database to further verify the expression of SIX4. The results showed that SIX4 was also highly expressed in the tumor tissues(Fig. 6C, 6D, 6E, 6F). In addition, survival analysis of GSE39582 also showed that abnormally high expression of SIX4 was a risk factor for OS in COAD patients (HR = 1.36, P = 0.032) (Fig. 6G).
Correlation Between Immune Infiltration and Expression of SIX4 in COAD
To assess the potential relationship between SIX4 expression and COAD immune infiltration, we used the TIMER database for the subsequent analysis. Analysis using the SCNA module showed that different levels of immune cell infiltration appeared to be associated with alterations in SIX4 gene copy number, including B cells, CD8 + T cells, macrophages, neutrophils, and dendritic cells in COAD (Fig. 7A). Gene module analysis showed that SIX4 expression was significantly negatively correlated with COAD tumor purity and positively correlated with the infiltration levels of B cells, CD8 + T cells, CD4 + T cells, macrophages, neutrophils, and dendritic cells in COAD (Fig. 7B). To further validate the relationship between SIX4 and multiple immune infiltrating cells, we examined the association between SIX4 and the immune marker sets of 24 immune cells. 21 markers, including macrophages, Th1 cells, iDC, Neutrophils, Mst cells, NK cells, DC, Tgd, Tem, T helper cells,TFH, CD8 T cells, aDC, Cytotoxic cells, Tcm, Eosinophils, Treg, T cells, Th2 cells, NK CD56dim cells, and B cells showed a significant positive correlation with the expression of SIX4 in COAD. In contrast, the expression of Th17 cells showed a significant negative correlation with the expression of SIX4 in COAD (Fig. 7C, 7D, Supplementary Table S2). These results suggest that tumor-infiltrating immune cells may play an important role in the clinical outcome of the H19/SIX4 axis in COAD.
PPI Network of SIX4 in Cancers and Enrichment Analysis
To explore the potential mechanisms of SIX4 involvement in carcinogenesis, we constructed a protein-protein interaction (PPI) network of SIX4 using the GeneMANIA online tool. SIX4 is strongly associated with EYA2 and KDM6A, which play critical roles in cancer development and prognosis (Fig. 8A). According to the GEPIA2 database, SIX4-related genes, including EYA2 and SIX5, were down-regulated, while IL27RA, GTF2RID1, EREG, and TRIM16 were up-regulated in colorectal cancer tissues (Fig. 8B). GO and KEGG enrichment analysis of 20 genes associated with SIX4 to investigate the further functions of SIX4 in COAD. The GO enrichment terms associated with SIX4 were mainly enriched in “epithelial cell proliferation”, “embryonic organ morphogenesis” and “embryonic organ development”. The KEGG pathway enrichment terms related to SIX4 were “Transcriptional misregulation in cancer” and “Signaling pathways regulating pluripotency of stem cells”. (Fig. 8C, Supplementary Table S3 ).
Expression Analysis and Survival Analysis of SIX4 in Pan-Cancer
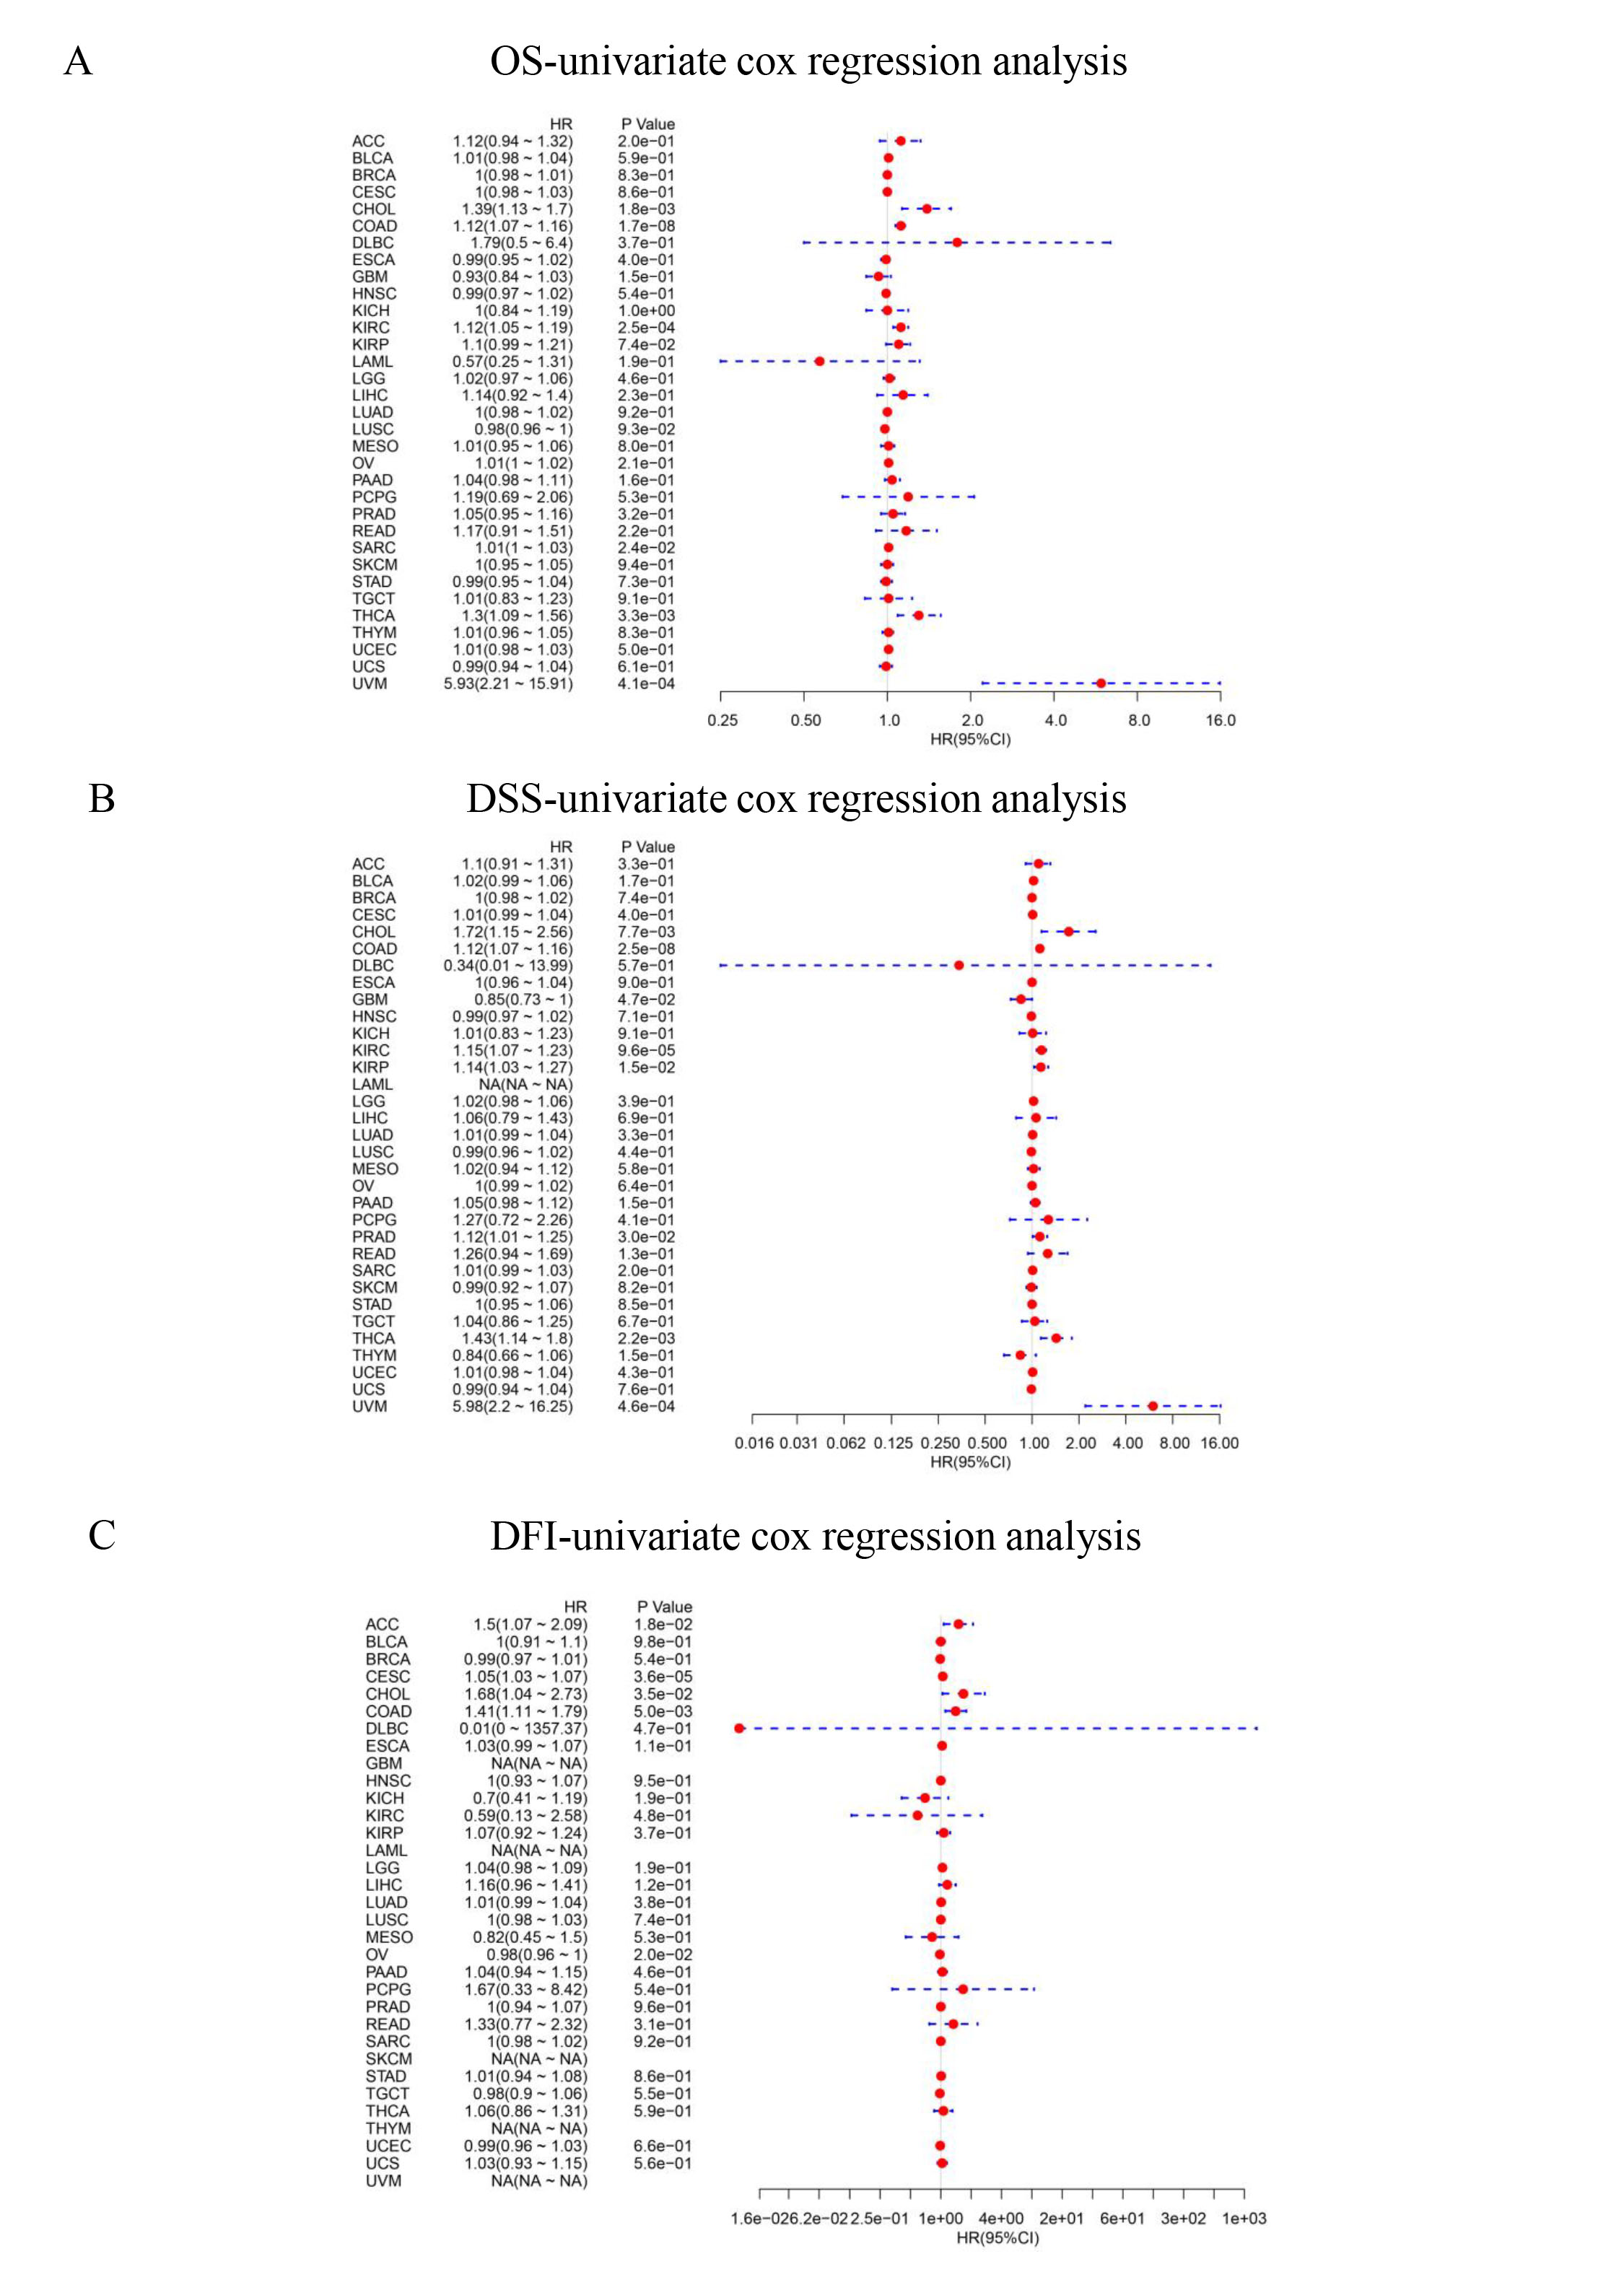
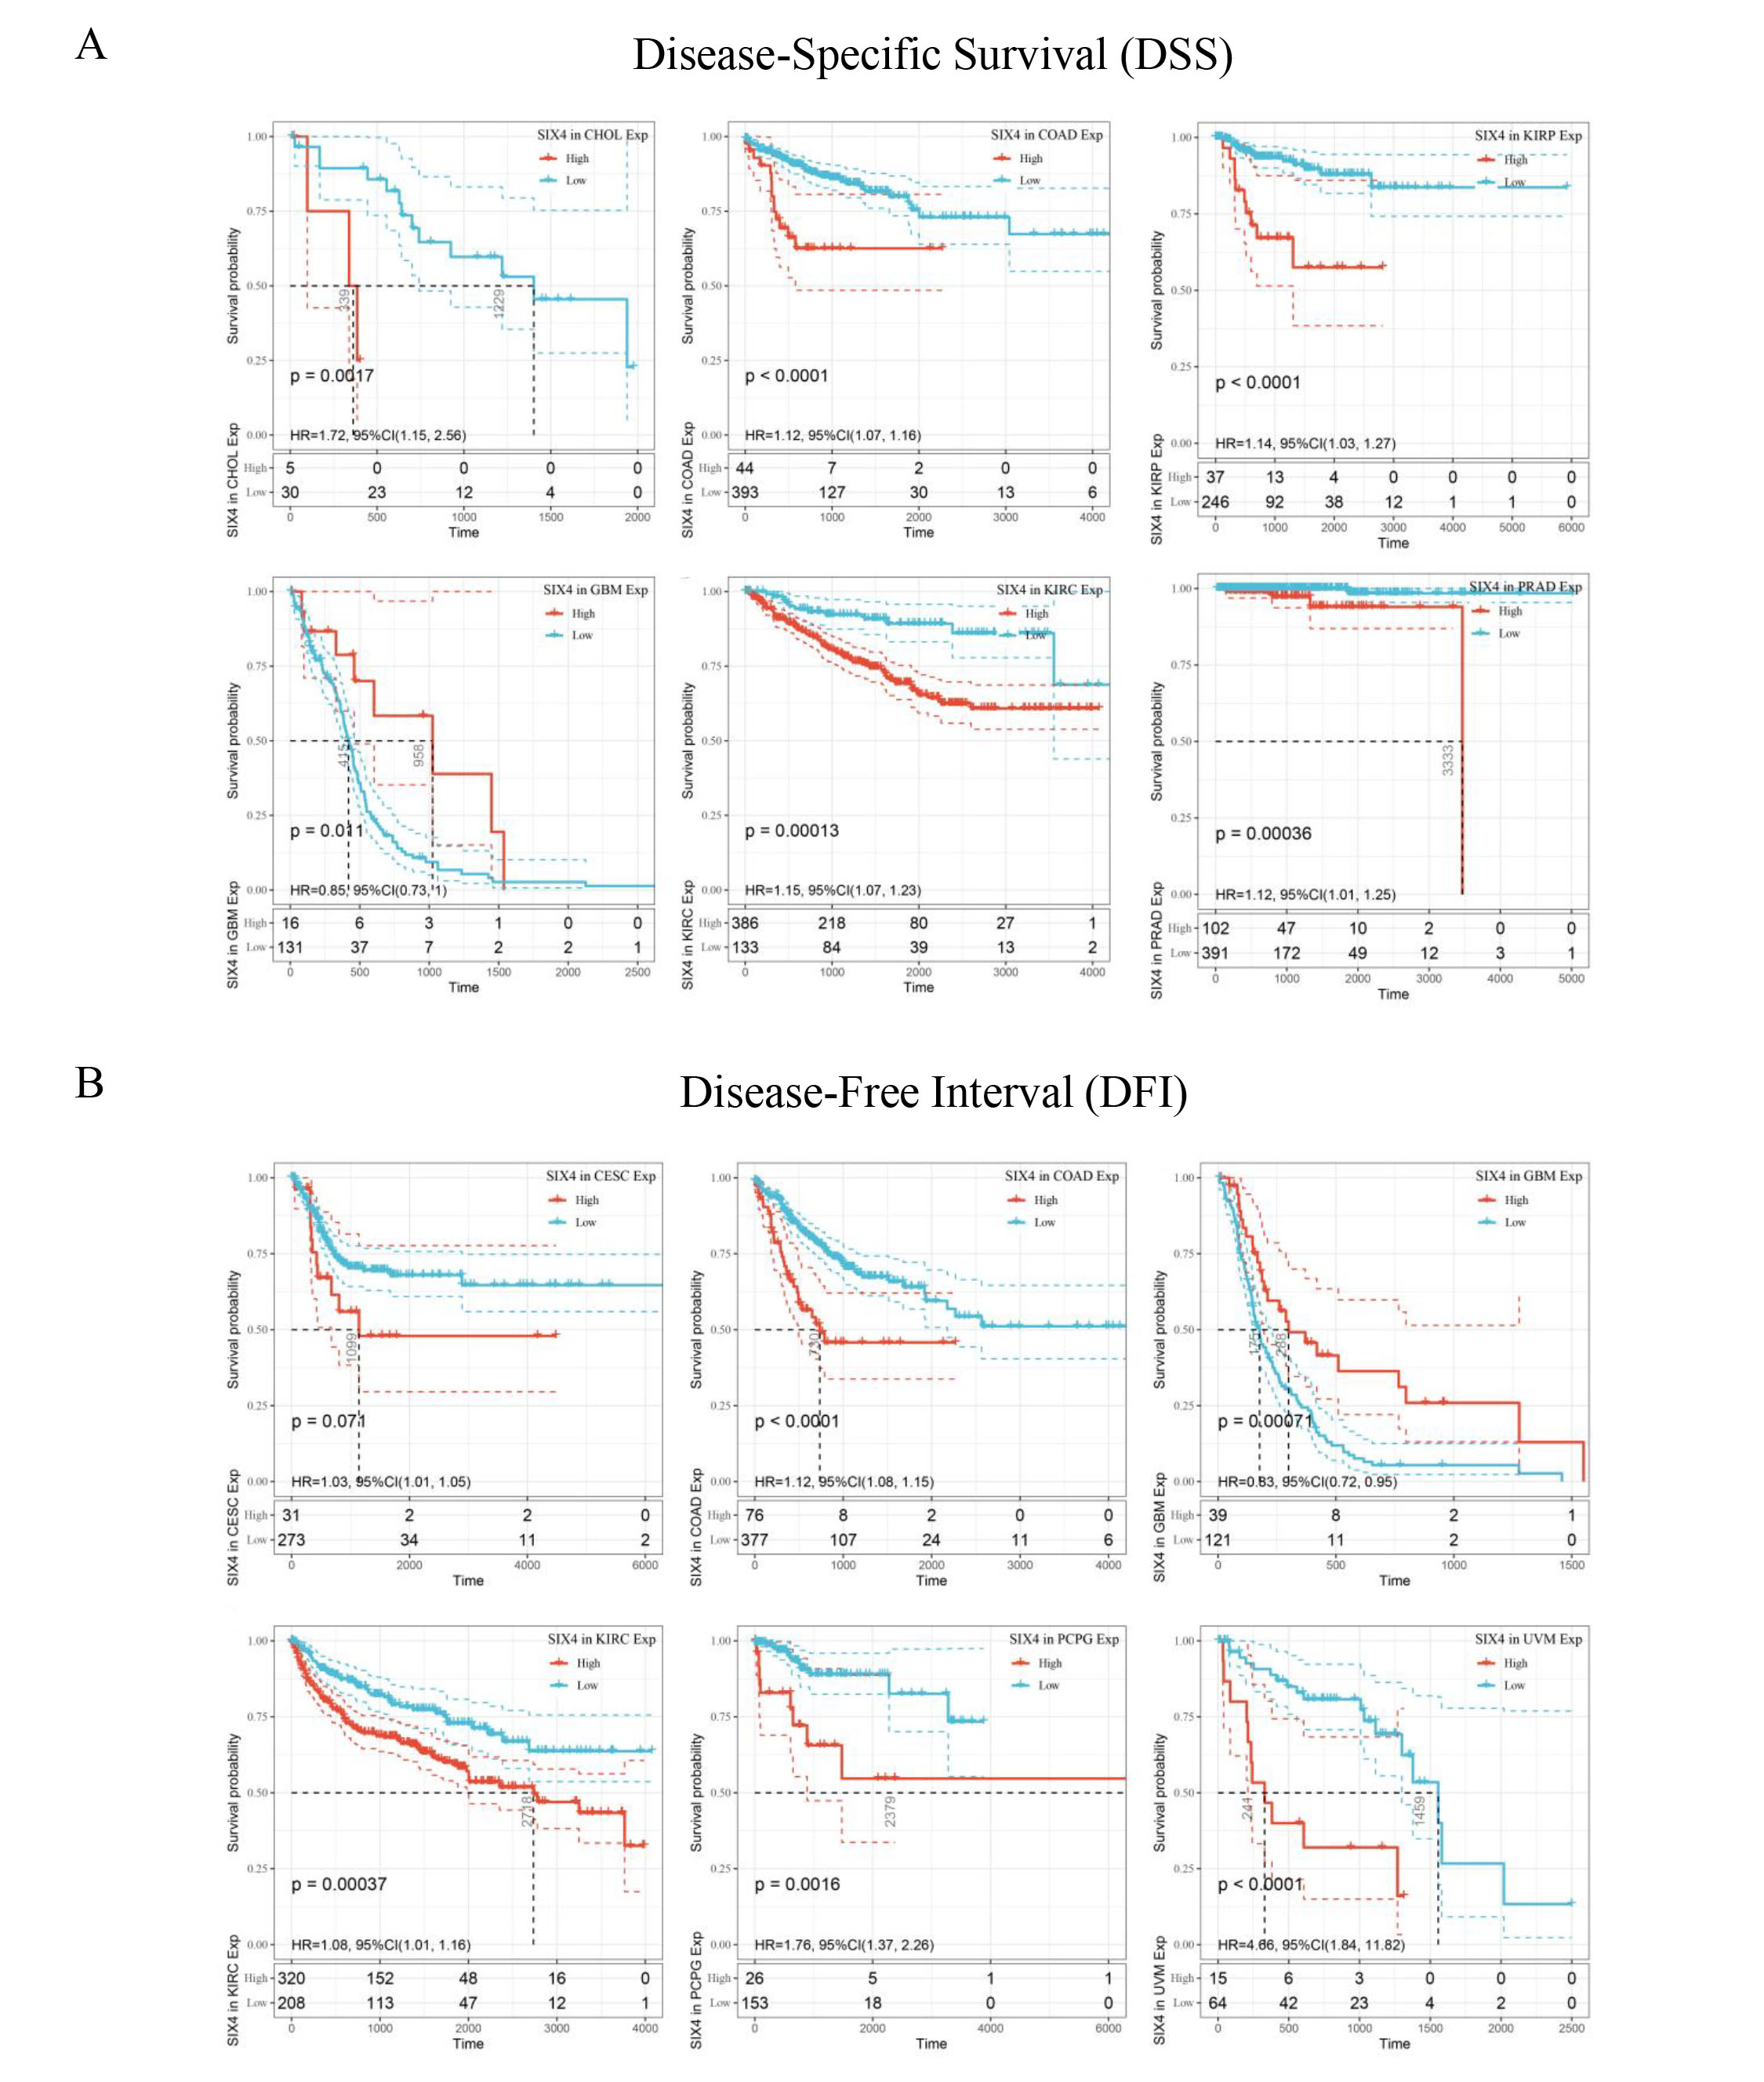
The DiffExp module of the TIMER database was used to explore the expression of SIX4 between tumor and adjacent normal tissues for all TCGA tumors. The expressions of SIX4 were significantly different in a number of tumor tissues and normal tissues, including BLCA, BRCA, CHOL, COAD, ESCA, HNSC, KICH, KIRC, KIRP, LIHC, LUAD, LUSC, PRAD, READ, STAD, THCA, UCEC. Among them, SIX4 was highly expressed in BLCA, BRCA, CHOL, COAD, ESCA, HNSC, KICH, LIHC, LUAD, LUSC, PRAD, READ, STAD, and UCEC tumor tissues, while it was weakly expressed in KIRC and KIRP tumor tissues (Fig. 9A). We combined the data of normal tissues from the GTEx database with the data of tumor tissues from the TCGA database to analyze the differential expression of SIX4 in pan-cancer. SIX4 expression levels in ACC, BLCA, BRCA, CESC, CHOL, COAD, ESCA, GBM, HNSC, KICH, LGG, LIHC, LUAD, LUSC, OV, PAAD, PRAD, READ, SKCM, STAD, TGCT, THCA, UCEC, and UCS were significantly higher than those in adjacent normal tissues. In contrast, SIX4 expression was lower in KIRC, KIRP and LAML than in normal tissues (Fig. 9B). Then, the relationship between SIX4 expression and prognosis [ overall survival time (OS), disease-specific survival (DSS) and disease-free interval (DFI) ] was analyzed using univariate cox regression analysis, plotting forest plots, and plotting K-M curves in the significant tumors. The results showed that patients with higher SIX4 expression were related to poor OS for CHOL (HR = 1.39, P < 0.0001), COAD (HR = 1.12, P = 0.00015), KIRC(HR = 1.12, P = 0.00082), SARC(HR = 1.01, P < 0.0001), THCA(HR = 1.3, P = 0.00011) and UVM(HR = 5.93, P = 0.00052). The results showed that the expression of SIX4 was related to the prognosis of patients with various tumors (Supplementary Figure S2, S3 and Fig. 9C).
Correlations between SIX4 expression and TMB, MSI, MMRs, and methyltransferases correlation analysis in pan-cancer
The association between TMB/MSI and SIX4 expression was evaluated. The results showed that SIX4 expression was positively correlated with TMB in THYM (P < 0.01), PRAD (P < 0.01), PAAD (P < 0.01), LUAD (P = 0.014), LGG (P = 0.0026), LAML (P = 0.034), and COAD (P < 0.01), but negatively correlated with UCS (P = 0.025), OV (P = 0.026), LIHC (P = 0.011), KIRP (P < 0.01), KIRP (P < 0.01), ESCA (P < 0.01) and CESC (P < 0.01) (Fig. 10A). We also found that SIX4 level was positively correlated with MSI in LUSC (P = 0.0011), and COAD (P < 0.01), but negatively correlated with BRCA (P = 0.032) (Fig. 10B).
The expression of SIX4 was significantly associated with mutations in five MMR genes (MLH1, MLH2, MLH6, PMS2, EPCAM) in multiple cancers, except ACC, DLBC, UCS (Fig. 10C). In addition, a close relationship was found between the expression of SIX4 and mutations in 4 methyltransferases in several cancer types (Fig. 10D).
The enrichment in the high and low expression groups was analyzed using GSEA
Then, GSEA was used to identify the functional enrichment of SIX4 with high and low expression. P < 0.05, FDR < 0.25 as screening criteria, KEGG enrichment term exhibited that high expression of SIX4 was mainly associated with “Notch signaling pathway” and “Small cell lung cancer”. And HALLMARK enrichment showed that high expression of SIX4 was mainly enriched with “Mitotic spindle”, “G2M checkpoint” and “UV response DN” (Fig. 10E).