Discovery of SNVs and indels
The five native Malaysian trios were sequenced at coverage of 28-38× (~30× on average). One Mendriq (MDQ) sample had the lowest sequence coverage at 28.3× (Table 1). On average 97.5% (Phred Score ≥10) of the reads were mapped to the reference genome (GRCh37). As shown in Table 1, more than 6.9 million SNVs (3.4 million per genome) and approximately 1.2 million bi-allelic indels (< 100 bp, 0.6 million per genome) were discovered in the fifteen genomes. The average Ti/Tv ratio was similar across all the native Malaysian populations (2.1 per genome), which was consistent with published reports [14,38,39]. The individual genome heterozygosity ranged between 51.6 – 56.7% for SNVs and 59.5 – 66.8% for indels, lower than other global populations (Table 1; Figure 1a), suggesting that the native Malaysian populations are genetically more homogenous.
We further examined whether there were genomic regions enriched with variants. Hotspots of variants were determined by selecting the top 1% non-overlapping windows across the genome, each spanning 1 Mb, with top counts of mutations that passed the quality control (genotyping quality ≧ 50; read depth = 10 – 120; allele balance = 0.3 – 0.7). SNVs and indels were treated independently. Regions adjacent to 1 Mb from the telomeres and centromeres were excluded. As expected, the region Chr6:29-33 Mb harboured the largest number of both SNVs and indels, followed by Chr8:3-4 Mb (Table S2-S3). These two regions encompass immunity-related protein-coding genes (the MHC Class II genes, ANGPT2, DEFA, and DEFB on chromosome 6; CSMD1 on chromosome 8) [40–42], and have been reported previously as SNV hotspots in the Singapore Malays [38]. Particularly noteworthy is CSMD1, which is highly expressed in the brain [43] and may play a role in the susceptibility of malarial infection [41,42]. The region Chr22:49-50 Mb was another hotspot of SNVs and indels, spanning two immune related genes FAM19A5 and C22orf34. Protein-coding genes underlying the mutation hotspots regions were significantly enriched in olfaction, immunity and hemoglobin among others (Table S4), suggesting that genomic regions which are ‘sensitive’ towards environmental responses tend to be more variable.
We applied SnpEff version 4.3T [36] to classify the variants according to their functional effects, and summarized the number of SNVs and indels of each category in each population in Table S5-S6. We found 98.5% of the SNVs and 99% of the indels were non-coding variants; while the remains included possibly harmful variants with low (1.1% SNVs and 0.08% indels) and moderate (0.4% SNVs and 0.15% indels) impact, and disruptive variants with high impact (0.03% SNVs and 0.07% indels, e.g., exon-loss, frameshift, splice-acceptor, splice-donor, start-lost, stop-gained, stop-lost, and transcript-ablation variants). Each genome carried 290 loss-of-function (LOF) SNVs on average (Table S7), consistent with previously reported number of LOF variants (200-800) in each healthy human genome [44]. Although fewer samples were sequenced, the number of LOF-SNVs in our data was comparable with that reported in the 1000 Genomes Project data (Table S5), which represents a larger sample size with low sequencing depth. When comparing across the five native Malaysian populations, the number of LOF-SNVs per genome between OA and NB were similar (291 vs. 289 per sample) (Figure 1c; Table S7).
On average, 486 high-impact and 320 LOF-indels were identified in each sample, similar with other global populations (Figure 1d; Table S6; Table S7) [45]. Of these, 354 were homozygous deletions in at least one sample, and 555 indels presented in more than one sample. Frameshift indels (FS-indels) are generally thought to be pathogenic and may confer significant phenotypic consequences [45]. We observed 644 FS-indels in the 15 samples (on average 327 in each), of which 171 were homozygous deletion in at least one sample, and 580 FS-indels presented in more than one sample. One example of high-frequency FS-indels in the 15 samples include an 11-bp mutation affecting MICA (frequency = 0.87). MICA has been attributed to autoimmune diseases and viral infection [46,47]. Details of the FS-indels identified are tabulated in Table S8. Protein-coding genes affected by LOF-indels showed significant enrichment in Ca2+ dependent cell adhesion and olfactory transduction (Table S4). A similar functional enrichment pattern was observed on genes overlapping with FS-indels.
Identification of novel SNVs and indels
We observed approximately 0.19 million SNVs (2.7%) and 0.03 million indels (2.3%) not reported in dbSNP153. The overall novelty rate across autosomal chromosomes was similar, ranging from 2.2% (chromosome 21) to 3.0% (chromosome 5) for SNVs, and from 2.0% (chromosome 13) to 2.9% (chromosome 22) for indels. Genomic regions emerged with higher densities of novel SNVs or indels are listed in Table S9-S10. The variant-enriched region Chr8:3-6 Mb, again, harbored the largest number of novel SNVs; Chr1:145-148 Mb showed a substantial excess of novel indels than other regions.
Comparing across the native Malaysian populations, we found that OA populations harbored more novel variants than NB populations did on both population (1.0-1.6% of SNVs and 1.4-1.7% of indels in OA; 0.5% of SNVs and 1.2% of indels in NB) and individual (0.7-1.2% of SNVs and 1.2-1.5% of indels in OA; 0.3% of SNVs and 1.1% of indels in NB) levels (Table 1; Figure 1b; Table S5-S6). Notably, the two Negrito populations especially the Bateq (BTQ) trio, harbored the highest proportion of putative novel SNVs and novel indels (novelty rates are 1.2% for SNVs and 1.5% for indels in each BTQ sample) (Table S5-S6). OA and NB populations shared a smaller number of novel SNVs (1,323, making up 0.9% and 3.1% of the novel SNVs in OA and NB, respectively), but more novel indels (8,358, making up 36.4% and 64.7% of the novel SNVs in OA and NB, respectively) in common.
Estimating de novo mutation rates
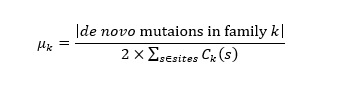
We further identified autosomal de novo mutations in the offspring of each trio. We applied stringent control for genotyping quality and have filtered out the mutations with allele balance ≤ 0.3 or ≥ 0.7. Therefore, the de novo mutations identified could be considered in the germline (see Methods). The number of de novo SNVs ranged in 37-62 for each offspring (listed in Table S11). Correspondingly, the germline de novo mutation rate was estimated to be 0.81×10⁻⁸-1.33×10⁻⁸ per site per generation for SNVs (Table 2), which falls within the expected range [15,48]. As listed in Table S11, there were a total of 242 de novo SNVs in the five offspring, affecting 137 genes, of which 108 were protein-coding genes. These genes showed significant functional enrichment in epidermal growth factor (8 of the 108 genes, Table S4). All the de novo SNVs were individual-specific, but we found two mutations in MDQ (Chr2:141,474,240) and Dusun (DSN) (Chr2:141,657,309) which fell in the same gene, LRP1B, and encodes for a member of the low-density lipoprotein receptor family. In addition, CACNA1C and SLC43A2 were affected by multiple de novo SNVs in MRT. Two adjacent intronic allele substitutions (at positions 2,605,335 and 2,605,336, respectively; both were novel mutations) occurred in CACNA1C. This gene encodes a subunit of voltage-dependent calcium channel, and plays important roles in a wide range of biological functions, e.g. muscle contraction, hormone or neurotransmitter release, gene expression, cell motility, cell division and cell death, and might be attributed with cardiovascular diseases. Other interesting de novo SNVs include a ‘modifier’ C > T substitution at rs72668090 in EGLN3 and a T > C mutation at position 84,692,399 in NRG3 in the MDQ offspring. Both genes were reported to function in cardiovascular diseases [49,50].
Compared with SNVs, the de novo mutation events for indels occurred less frequently. The mutation rate was estimated to be 1.0×10⁻⁹-2.9×10⁻⁹ per site per generation according to the 5-10 de novo indels identified in the five offspring (Table 2; Table S12), in accordance with previous reports [14,54]. We did not observe any direct physical or functional attribution between the de novo indels and de novo SNVs in each sample – they were located distant from each other (> 1 Mb) and in different genes. A candidate gene of interest affected by a de novo indel was CDH13 in the Murut (MRT) offspring. CDH13 is a member of GPI-anchored member of the cadherin superfamily, which encodes for the protein T-cadherin that is prominently expressed in heart. It is associated with blood pressure regulation, atherosclerosis protection and regulation of adiponectin level [53–55]. Interestingly, this gene was also reported to be associated with malaria susceptibility [56], and consistently exerted as a signature of positive selection in the Negrito populations from Peninsular Malaysia [17,18].
Analysis of copy number variants
To minimize potential false positive calls, we utilized both ERDS and CNVnator to identify CNVs on the individual level (see Methods). Consequently, 9,152 CNVs over 100 bp in size were detected in the 15 samples, including 7,470 deletions and 1,682 duplications. Each sample carries 551-777 CNVs (610 on average) (Table S13). The number of CNVs identified in each genome was similar (~1,700), except that the MDQ trio was observed to carry a higher number of CNVs (2,172). The size distribution of CNVs is shown in Figure 2a. Deletions were enriched in the length of 461 bp (43 deletions), and duplications were enriched in the length of 1 kb (458 duplications). The largest CNV was a duplication found in the MRT trio, spanning 529 kb at 18q11.2. It encompassed RBBP8, which encodes for protein that regulates cell cycles and proliferation [57]. Using the 50% reciprocal overlap criteria to compare with the Database for Genome Variants (DGV), a substantial amount of the CNVs identified (~22.1%; 742 deletions and 1,276 duplications) are previously unreported, of which 1,214 (13%) were recurrent (observed in at least 2 out of the 15 genomes studied). These novel CNVs were enriched in size range <1 kb for deletions and in 1-10 kb for duplications. In the total of 9,152 CNVs, 42% (3,832) were genic variants, disrupting 694 genes (i.e, CNV breakpoints fell within the exons; average 139 genes per genome). We observed a large number of duplications (copy number (CN) > 2) in this study, which suggests that the duplication events may have been under-reported in previous array-based platforms, likely due to the limitation of the nature of the technology. We observed 12 de novo CNVs in this study, which converts to a mutation rate of ~0.001, consistent with the range of the reported rate (Table 2; Table S14) [48]. All the 12 de novo CNVs were deletions ranging in 281-2,778 bp. Two candidate genes of interest affected by the de novo CNVs were LMF1 and CLDN14 identified in MDQ and DSN, respectively. LMF1 encodes for protein lipase maturation factor, which involves in maturation and transport of lipase. CLDN14 encodes an integral membrane protein and a component for tight junction strands regulating the cell-cell adhesion in epithelial or endothelial cell sheets.
We then investigated the CNV sharing among the native Malaysian trios, and grouped them as Orang Asli CNVs (OA-CNVs; shared by BTQ, MDQ and Semai (SMI)), Negrito CNVs (NGO-CNVs; shared by BTQ and MDQ), North Bornean CNVs (NB-CNVs; shared by DSN and MRT), and Malaysian CNVs (MLS-CNVs; shared by OA and NB populations). As expected, populations that are historically closer tended to share more CNVs. For instance, we observed more CNV regions shared within OA population (302 OA-CNVs) and within NB population (386 NB-CNVs), than those shared between these two groups (227 MLS-CNVs) (Figure 2b; Table S15). Candidate genes affected by the OA-CNVs were enriched in the synapse-related ion transduction (Table S4).
We further investigated the inheritance of several candidate genes of interest that were known to either lie on the segmental duplication region, or carry multiple allelic CNVs. Numerous studies have reported the attributions and roles of CNVs underlying these genes in a wide range of disease traits. Genes affected by those reported CNVs are listed in Table S16, including: CCL3L1, DEFA/B, FCGR2/3, AMY1/2, GSTT/GSTM, LPA, and CYP2D6 [58–67]. The copy number of these candidate genes were surprisingly lower than average as previously reported [59,60,62,68]. All five trios showed duplication (copy number = 3) in AMY and DEFB103A (except MRT) but a deletion (copy number = 1) in gene DEFB130. BTQ and MDQ showed duplication for the DEFA1B gene (copy number > 2) but not the rest of the trios. The most variable gene among all trio members were LPA, ranging in 4 (DSN) -10 (MDQ). Some of the copy number of these candidate genes of interest were not called, probably due to the stringent quality control criteria during the SV call, which had filtered out the ‘noisy’ calls. Validation is recommended for identifying these copy number variants harbouring the complex and segmental duplicated regions [59,69–71].
Novel insertions shared with archaic hominids
Novel insertions (NIs) (fragment size in 47 – 19,045 bp) to the human reference genome have been identified in the native Malaysian genomes. To avoid possible artefacts in sequencing and variants calling, we only focused on the inherited NIs that was present in the offspring and at least one of his/her parent. The number of inherited autosomal NIs in OA (5,984 – 6,145 in each trio) was slightly more than that in NB (5,979 – 5,991 in each trio), probably due to the ancient origin and long-term isolation of the OA hunter-gatherers. A full list of inherited NIs can be found in Table S17. We found 547 of these NIs were unique to the OA, and 205 were unique to NB. Interestingly, 45.2 – 46.4% of the NIs in each sample could also be observed in the Neanderthal or Denisovan genomes (Table 3). Consistent with the lower proportion of Denisovan-like genomic segments in the native Malaysian populations [23], only around 50 of the archaic-like NIs in each sample could be specifically observed in the Denisovan genome; while the Neanderthal-like segments constituted a large proportion of the archaic-like NIs. Enrichment analysis revealed that genes underlying Neanderthal-like segments are enriched for synapse-related cell junction, immunity, ion channel, etc. (Table S4).