4.1. Materials
HES with an average molecular weight (Mw) of 130 kDa and hydroxyethyl molar substitution (MS) of 0.4 was purchased from Wuhan HUST life Sci & Tech Co., Ltd (Wuhan, China). Bromopro pylamine hydrobromide, succinic anhydride, cholesterol, N-ethyl-N'-(3-dimethylaminopropyl) carbodiimide hydrochloride (EDCI, 98%), and polycaprolactone were purchased from Aladdin Reagent Inc. (Shanghai, China). FX was purchased from MedChemExpress Co., Ltd. (Shanghai, China). Small interfering RNA duplexes against Twist (siTwist) [5’-GCU GAG CAA GAU UCA GAC CTT-3’ (sense)], negative control RNA (siNC), and Cy5-labeled siNC nonspecific to any gene [5’-UUC UCC GAA CGU GUC ACG UTT-3’ (sense)] were all ordered from GenePharm Co., Ltd. (Shanghai, China). INTERFERin® transfection reagent was obtained from Polyplus-transfection Co., (France). The Calcein-AM/PI live cell/dead cell double staining kit, and Annexin V-fluorescein isothiocyanate/propidium iodide apoptosis detection Kit were all obtained from Dojindo China Co., Ltd. (Shanghai, China). The MTT cell proliferation and cytotoxicity assay kit, Hoechst 33258 and Lyso-Tracker green were obtained from Beyotime Biotechnology Co., Ltd. (Shanghai, China). Transforming growth factor-β (TGF-β) was obtained from PeproTech, Inc. (Jiangsu, China). The anti-Twist antibodies were purchased from Abcam (Cambridge, UK). Anti-α-SMA antibodies were purchased from Abmart (Shanghai, China). Anti-GAPDH antibodies were purchased from Proteintech Group, Inc. (Wuhan, China). DiR iodide [1,1-dioctadecyl-3,3,3,3-tetramethylindotricarbocyanine iodide] were purchased from AAT Bioquest, Inc.(CA, USA). All other chemicals were of analytical grade and used as received.
4.2. Synthesis of aminopropyl HES (HES-NH2)
HES was dissolved in 6.2 mol NaOH solution at 0.5 g/L, cooled for 40 min at 4 °C, and 960 mg 3-bromopropylamine hydrobromide was added for the reaction. The mixture was then reacted for 20 min at 4 °C. Adjust the pH to 7.0 by adding 37% HCl solution. The grafted polysaccharide was recovered by cooling precipitation in anhydrous ethanol (4 °C). The precipitate was then freeze-dried after being redissolved in distilled water for dialysis. The amino group content was determined using hydrogen nuclear magnetic resonance spectroscopy (1H-NMR) characteristic spectra.
4.3. Synthesis of carboxylated CH (CH-COOH)
0.5 g of cholesterol and 0.5 g of succinic anhydride were added to 10.0 mL of pyridine solution to dissolve, and the reaction was stirred at 70 ºC for 3 h before being rotary evaporated to dryness. The precipitation obtained is dissolved in ethanol and rotated again, and the white final product is the carboxylated modified cholesterol (CH-COOH), which is freeze-dried.
4.4. Synthesis of hydroxyethyl starch-cholesterol polymer (HES-CH)
1 g CH-COOH and 1 g HES-NH2 were dissolved in 10 mL DMSO, then 0.5 g 1-hydroxybenzotriazole (HOBT) and 0.5 g 1-ethyl-(3-Dimethylaminopropyl) carbodiimide hydrochloride (EDC) were added, the mixture was heated and reacted overnight to obtain hydroxyethyl starch grafted cholesterol polymer (HES-CH), and unreacted was removed by dialysis impurities. The reactant solution was freeze-dried to obtain hydroxyethyl starch coupled cholesterol polymer (HES-CH) powder. Fourier transform infrared spectroscopy (FT-IR) and 1H-NMR were used to characterize the structure of HES-CH powder.
4.5. Preparation of FX@HES-CH self-assembled NPs
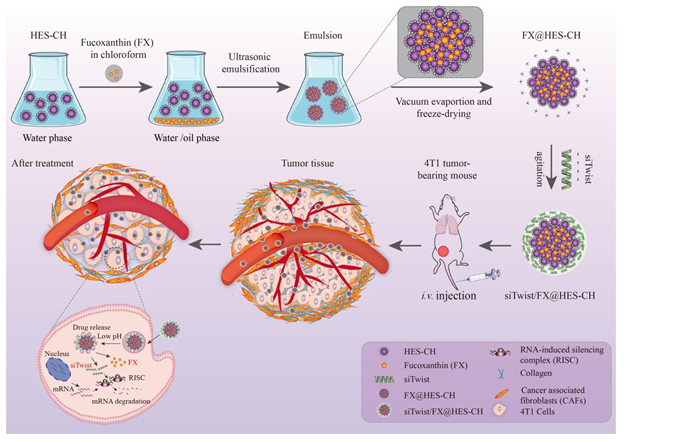
Emulsion solvent evaporation was used to produce FX@HES-CH NPs. In a nutshell, 100 mg HES-CH was dissolved in 100 mL deionized water, and 10 mg FX was dissolved in 10 mL chloroform mixture. A cell crushing apparatus was used for ultrasound during emulsification. Subsequently, the chloroform solvent in the emulsion was removed using the rotary evaporation method to obtain the suspension of FX@HES-CH. The prepared FX@HES-CH NPs were lyophilized to obtain FX@HES-CH freeze-dried powder. FX concentration was measured by UV spectrophotometer at 449 nm [57]. The following formula was used to calculate the drug loading content and entrapment efficiency of FX:

4.6. Loading siRNA onto FX@HES-CH NPs
FX@HES-CH was mixed with 1 mg/mL siRNA in different weight ratios (2.5, 5, 10, 20, 40, 60, 80, 100, w/w). After magnetically stirring for 30 min at 4 °C, the binding of FX@HES-CH to siRNA was tested using agarose gel electrophoresis.
For the serum degradation stability assay, siRNA solution and siRNA/FX@HES-CH NPs solution were treated with FBS (50%, v/v) at 37 °C. The sample was collected at each time point for agarose gel electrophoresis analysis.
4.7. Cell culture
Mouse triple-negative breast cancer cell line (4T1) and mouse embryonic fibroblasts line (NIH/3T3) were purchased from the Chinese Academy of Sciences Cell Bank (Shanghai, China). 4T1 cells and NIH/3T3 cells were cultured in RPMI-1640 medium and DMEM medium, respectively, at 37 °C in a humidified atmosphere of 5% CO2. Both media were supplemented with 10% (v/v) fetal bovine serum (FBS), 100 U/mL penicillin, and 100 μg/mL streptomycin.
4.8. Cellular uptake and intracellular trafficking of nanoparticles
To understand the cell internalization of nanoparticles or free siRNA, 4T1 cells treated with Cy5-siNC@HES-CH was imaged using confocal laser scanning microscopy (CLSM, Fluoview FV3000, Olympus, Japan). Cells were first seeded at a density of 6 × 10⁴ cells per well in glass-bottom dishes and cultured for 24 h. Cells were then treated with Cy5-siNC@HES-CH (100 nM Cy5-siNC) for another 6 or 12 h. PBS, free Cy5-siNC and HES-CH (empty vectors) were used as control. After incubation with NPs, cells were washed, and. then Hoechst 33258 (1 μg/mL) and Lyso-Tracker Green (100 nM) were added and fixed in ice-cold PBS containing 2% paraformaldehyde for 10 min. Red fluorescence (λex/em, 650 nm/670 nm) of Cy5-siNC, blue fluorescence of Hoechst 33258 (λex/em, 346 nm/460 nm) and green fluorescence of LysoTracker Green (λex/em, 504 nm/511 nm) were observed using CLSM.
Quantitative analysis of NPs internalized by 4T1 cells was performed using flow cytometry. Cells were placed at a density of 6 × 10⁴ cells per well in 6-well cell culture plates and incubated for 12 h with PBS, Cy5-siNC (100 nM), HES-CH, Cy5-siNC@HES-CH (100 nM Cy5-siNC). All cells were harvested and washed 3 times with PBS. Data were acquired by a BD FACSAriaTM Ⅲ flow cytometer and analyzed by FlowJo_V10 software.
4.9. Cytotoxicity assay
The MTT assay kit was utilized to confirm the in vitro synergic cytotoxicity of siTwist/FX@HES-CH. Briefly, 3 × 10³ 4T1 cells were seeded in each well of a 96-well cell culture plate and cultured overnight. Cells were then treated with FX or siTwist/FX@HES-CH at different concentrations for 24, 48, and 72 h. After that, 100 μL of fresh medium containing 10 μL of MTT was added to the each well for 4 h in the dark. Following the incubation, 100 μL of Formazan lysis solution was added to each well, and incubated at 37 °C for 3 h, until all the purple crystals were dissolved. And finally, the absorbance at 450 nm was measured with a microplate reader (Multiskan FC, Thermo Scientific, USA).
The cytotoxicity of different formulations was also evaluated using the MTT assay. Briefly, 3 × 10³ 4T1 cells were seeded in each well of a 96-well cell culture plate and cultured at 37 °C in a 5% CO2 incubator overnight. The cell culture media was then replaced with fresh media containing different drugs, including PBS, free FX, siTwist, free FX + siTwist, HES-CH, FX@HES-CH, siNC/FX@HES-CH, and siTwist/FX@HES-CH (FX concentration of 20 μM, siTwist concentration of 100 nM). After another 48 h of incubation, cell viability was determined using MTT assay as described above.
4.10. Flow-cytometry apoptosis assay
Cell apoptosis was detected using the Annexin V-/FITC apoptosis detection kit. 4T1 cells were seeded at a density of 1 ×10⁵ cells per well in 6-well cell culture plates and cultured at 37 °C in a 5% CO2 incubator overnight. The cell culture media was then replaced with fresh media containing different drugs, including PBS, free FX, siTwist, free FX + siTwist, HES-CH, FX@HES-CH, siNC/FX@HES-CH, and siTwist/FX@HES-CH (FX concentration of 20 μM, siTwist concentration of 100 nM). After another 36 h of incubation, the cells were harvested, washed twice with cold PBS, resuspended in 400 μL Annexin V binding buffer, and stained with Annexin V-FITC/PI for 20 min at 2-8°C in the dark. Fluorescence was quantified by flow cytometer (BD FACSAriaTM Ⅲ, USA). The results were analyzed using FlowJo_V10 software.
4.11. Viable and dead cells observations
In order to intuitively assess cellular viability after treating with the various formulations, the Calcein-acetoxymethyl (AM) / propidium iodide (PI) double staining kit was used according to the manufacturer’s protocol. In brief, 4T1 cells were seeded at a density of 1 × 10⁵ cells per well in 6-well cell culture plates and cultured at 37 °C in a 5% CO2 incubator overnight. Cells were then incubated with different formulations for 48 h, and washed with PBS. Following that, cells were incubated with calcein-AM and PI solutions for 15 min at 37 °C, then washed with PBS and imaged with fluorescence microscope.
4.12. Wound-healing assay
For the wound-healing assay, 4T1 cells were seeded at a density of 2 × 10⁵ cells/mL to 6-well cell culture plates and cultured for 24 h. When cells grew to 80% confluence, the cell monolayer was scraped by sterile 10 μL pipette tips, and washed three times with cold PBS. Cells were then incubated with PBS, free FX, siTwist, free FX + siTwist, HES-CH, FX@HES-CH, siNC/FX@HES-CH, and siTwist/FX@HES-CH for another 36 h. Cells were imaged under an inverted microscope.
4.13. Transwell migration and invasion assays
The in vitro anti-metastatic efficacy of siTwist/FX@HES-CH NPs was measured in 4T1 cells by cell migration and invasion assays in an insert Transwell device. In brief, for the migration assay, 2 × 10⁵ 4T1 cells in 100 μL serum-free medium were added to the upper chamber, and 600 μL of medium containing 10% FBS was added to the lower chamber. PBS, free FX, siTwist, free FX + siTwist, HES-CH, FX@HES-CH, siNC/FX@HES-CH, and siTwist/FX@HES-CH were added in both chambers. Cells were cultured at a 37 °C incubator and allowed migration through the insert membrane for 24 h. For the invasion assay, the upper chamber was coated with diluted Matrigel by serum-free medium (1:10, 100 μL/well, BD Biocoat), then 100 μL serum-free medium containing 2 × 10⁵ 4T1 cells was added in the upper chamber, and the lower chamber was filled with 600 μL medium with 10% FBS. PBS, free FX, siTwist, free FX + siTwist, HES-CH, FX@HES-CH, siNC/FX@HES-CH, and siTwist/FX@HES-CH were also added in both chambers, and the cells were incubated for 36 h. Non-migrated cells (on the upper chamber) were removed by swabs. Cells that had migrated or invaded were fixed with methanol and stained with 0.1% crystal violet, and cells were photographed and counted under an inverted microscope.
4.14. Western blot assay
Twist protein expression in 4T1 cells was determined by western blot analysis. Briefly, 4T1 cells were seeded at a density of 1.5 × 10⁵ cells per well in 6-well cell culture plates and cultured overnight. The cell culture media was then replaced with fresh media containing different drugs, including PBS, free FX, siTwist, free FX + siTwist, HES-CH, FX@HES-CH, siNC/FX@HES-CH, and siTwist/FX@HES-CH (FX concentration of 20 μM, siTwist concentration of 100 nM). After another 48 h of incubation, total cellular proteins were harvested, and the expression levels of Twist were determined by western-blot assay.
NIH/3T3 cells were seeded at a density of 2×10⁵ cells per well in 6-well cell culture plates and cultured overnight. The medium was then replaced with fresh DMEM medium containing TGF-β (10 ng/mL) and pre-incubated at 37 °C. Following that, the cells were treated with PBS, free FX, siTwist, free FX + siTwist, and siTwist/FX@HES-CH for 48 h (FX concentration of 20 μM, siTwist concentration of 100 nM). Total cellular proteins were harvested, and the expression levels of α-SMA were determined by western-blot assay.
To analyze the expression of Twist in the TNBC tumors, tumor-bearing mice were randomly assigned to six groups and were given i.v. with saline, free FX (15 mg/kg), HES-CH, siTwist@HES-CH (equivalent to 1 mg/kg siTwist), FX@HES-CH (equivalent to 15 mg/kg FX) or siTwist/FX@HES-CH (equivalent to 15 mg/kg FX or 1 mg/kg siTwist) on days 0, 3, 6, excised tumor tissue on the ninth day, and the target proteins were harvested and determined by western-blot assay.
4.15. In vitro penetration and inhibition evaluation in three-dimensional multicellular tumor spheroids (MCTSs)
In order to evaluate the effect of inhibiting the activity of cancer associated fibroblasts (CAFs) on drug penetration, we simulated the solid tumor microenvironment to establish hybrid multicellular tumor spheroids (MCTSs) model co-cultured with tumor cells (4T1) and fibroblasts (NIH/3T3), and then evaluated permeation of siTwist/FX@HES-CH NPs in vitro. Briefly, 80 μL of hot sterile agarose solution (1.5%, w/v) were pre-plated in a 96-well plate. After cooling to room temperature for solidification, 4T1 cells and NIH/3T3 cells were mixed in 96-well plates and cultured into hybrid MCTSs in a 2:1 ratio. After MCTSs grew to appropriate sizes, siTwist@HES-CH (containing 100 nM siTwist) and siTwist/FX@HES-CH (containing 100 nM siTwist and 20 μM FX) nanoparticles were incubated with MCTSs, respectively. At the same time, Cy5-NC/C6@HES-CH was also added to each group. After 48 h incubation at 37°C, MCTSs were washed with cold PBS and fixed with 4% paraformaldehyde. Subsequently, spheroids were scanned by CLSM from the top to the middle of the MCTSs. Each 4T1 & NIH/3T3 MCTS has a scan layer of 15 μm.
The construction scheme of MCTSs for tumor spheroids inhibition is the same as described above. After the spheroids reached to appropriate sizes, they were divided into six groups, and PBS, FX, HES-CH, siTwist@HES-CH, FX@HES-CH, siTwist/FX@HES-CH (FX concentration of 20 μM, siTwist concentration of 100 nM) were added to the medium, respectively. An inverted light microscope was used to image and record the diameter changes in MCTSs on a daily basis.
4.16. In vivo biodistribution of NPs
Animal studies were carried out in accordance with protocols approved by Huazhong University of Science and Technology's Institutional Animal Care and Use Committees (IACUC). Breast tumors were orthotopically implanted by injecting 2 × 10⁵ 4T1 cells into the mammary fat pad of female BALB/c mice (GemPharmatech, JiangSu, China). When the tumor volumes reached approximately 200 mm3, mice were randomized into three treatment groups and injected through the tail vein with PBS, free DiR iodide [1,1-dioctadecyl-3,3,3,3-tetramethylindotricarbocyanine iodide] (DiR, 1 mg/kg DiR), and DiR@HES-CH (1 mg/kg DiR). The mice were then euthanized at 48 h after injection, and their hearts, livers, spleens, lungs, kidneys, and tumors were collected. All of the organs were washed with cold PBS and photographed using an in vivo imaging system (Pearl Trilogy, LI-COR, USA).
In addition, when the tumor volumes reached approximately 200 mm3, tumor-bearing mice were randomized into eight groups (n = 3 per group), and injected through the tail vein with DiR@HES-CH NPs at a DiR dose of 1 mg/kg. All mice were euthanized and imaged at 1, 6, 12, 24, 36, 48, 72, and 96 h after injection. The mice were then sacrificed at various time points following injection, and tumors, along with other major organs (heart, liver, spleen, lung, and kidney), were collected for ex vivo imaging. All the organs were washed with cold PBS and photographed using an in vivo imaging system (Pearl Trilogy, LI-COR, USA).
4.17. Orthotopic mouse tumor model and treatment
An orthotopic mouse tumor model was established by injecting 1×10⁵ 4T1 cells into the mammary fat pad of female BALB/c mice on day -7. When tumors growing reached approximately 70-100 mm3 in volume, mice were randomly assigned to six groups (n = 6) and were given i.v. with saline, free FX (15 mg/kg), HES-CH, siTwist@HES-CH (equivalent to 1 mg/kg siTwist), FX@HES-CH (equivalent to 15 mg/kg FX) or siTwist/FX@HES-CH (equivalent to 15 mg/kg FX or 1 mg/ kg siTwist) on days 0, 3, 6, 9, 12, and 15. Body weight and tumor size were monitored every 3 days for a total of 7 times. Tumor length and width were measured by calipers, and tumor volume was calculated according to the formula: volume (mm3) = length × width2 /2. The mice were euthanized eighteen days following treatment, and the locally developed tumors were removed, rinsed with cold PBS, and imaged. Subsequently, the completely peeled tumors were fixed in PBS containing 4% formaldehyde. Tumor tissues and major organs (heart, liver, spleen, lung, and kidney) slices were stained with H&E for routine histology assay. Immunohistochemistry revealed TUNEL assay, Ki67, and CD31. Immunofluorescence was used to detect Twist and α-SMA expression in primary tumors, as well as Masson staining for collagen analyses.
4.18. siTwist/FX@HES-CH NPs suppress lung metastasis of TNBC
The breast cancer spontaneous metastasis mouse model was established followed by the same procedures as the previous model. When tumors growing reached approximately 100 mm3 in volume, the 4T1 tumor-bearing mice were randomly assigned to six groups (n = 5) and were administered i.v. with saline, free FX (15 mg/kg), HES-CH, siTwist@HES-CH (equivalent to 1 mg/kg siTwist), FX@HES-CH (equivalent to 15 mg/kg FX) or siTwist/FX@HES-CH (equivalent to 15 m/kg FX or 1 mg/kg siTwist) on day 0, 3, 6, 9, 12, 15 and 18. All the animals were euthanized on day 35 after treatment. The lungs were removed, washed with cold PBS, and photographed. The metastasis-suppressive effects of NPs were evaluated by counting the number of metastatic foci on the lung and H&E staining.
4.19. Statistical analysis
All the experiments were repeated at least in triplicate. Data were expressed as mean ± standard deviation (SD). Results were analyzed by two-tailed Student's t-test for two groups and one-way ANOVA for multiple groups. *p < 0.05, **p <0.01, ***p < 0.001, and ****p < 0.0001 were considered to be statistically significant. The samples/animals were allocated to experimental groups and processed randomly.

