The specimens of this study were manufactured following the ISO 10477 standards, third edition 2018, for ceramic tests. The materials used in the study are described in Table 1.
Table 1 - Materials used in the study

A Duralay acrylic resin model (Reliance, Co Worth, IL, United States) was obtained from a PVC (polyvinyl chloride) plastic matrix, with dimensions of 4 millimeters (mm) in diameter by 5 millimeters (mm) in height, which was reproduced in special Durone plaster (Dentsply, Petrópolis, RJ, Brazil) [13]. This plaster cylinder was scanned by the CAD/CAM system, and later the zirconia cylinders were made. One hundred and five zirconia cylinders, 4mm in diameter and 5mm in height, were prepared from a block of yttria-stabilized zirconia (Vipiblock-Zirconn, Vipi - Brazil), pre-sintered, using the CAD/CAM system (Ceramill- AMANNGIRRBACH–Germany) and subsequently sintered at a temperature of 1450ºC, for 10 hours, in the ceramic oven (Ceramill Therm-AMANNGIRRBACH–Germany), in the Dental Prosthesis Laboratory C2 (Figs. 1 and 2).
One of the zirconia cylinders, already sintered and before being embedded in the epoxy resin, was molded using Futura dense consistency addition silicone (DFL-Brasil), making a matrix, which served as a mold for the creation of 100 composite resin cylinders ( Filtek Z350- 3M-ESPE) in A2 color. The molds were filled in increments of a maximum of 2 mm, each increment being light cured for 20 seconds, at a light intensity of 1200 mW/cm 2 with the light curing device, measured with a rayometer (Radii-cal SDI-Australia).
The zirconia cylinders were embedded in cylindrical PVC tubes (25mm in diameter by 20mm in height) and filled with colorless epoxy resin (Redelease, São Paulo, SP, Brazil), which was manipulated in a 2:1 ratio, for 1 to 1 2 minutes, leaving only a free surface of the zirconia, which after the final polymerization of the epoxy resin was sanded, with silicon carbide abrasive sandpaper of 150 and 280 µm (T223) (Norton – Guarulhos – São Paulo Brazil), cooled in water, in the Metallographic Polytrix sander (Risistec -PLR-II - São Paulo, SP, Brazil), to simulate the surface roughness caused by the machining process, in the manufacture of zirconia restorations. Then, the specimens were placed in an ultrasonic vat (Odontobrás 1440D – Ribeirão Preto – São Paulo - Brazil), for removal of debris and cleaning, with distilled water, for 5 minutes at 50ºC. Subsequently washed with distilled water and allowed to dry at room temperature for 30 minutes in Fig. 3.
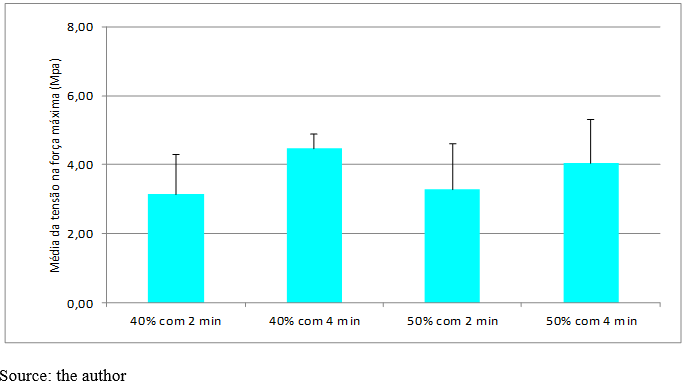
The 100 specimens were then randomly divided into 10 groups (n = 10) according to the surface treatment received and storage time, described in Table 2.
Table 2
Division of groups according to zirconia surface treatment and storage time.
|
Group
|
Surface treatment of Zirconia (n = 10)
|
Thermocycling + Storage time in distilled water at 37°C
|
|
1- Control
|
No surface treatment
|
5000TC* + 730 Days
|
|
2- HF 40%-2min.
|
Conditioning with 40% hydrofluoric acid for 2 minutes
|
5000TC + 730 Days
|
|
3- HF 40%-4min.
|
Conditioning with 40% hydrofluoric acid for 4 minutes
|
5000TC + 730 Days
|
|
4- HF 50%-2min.
|
Conditioning with 50% hydrofluoric acid for 2 minutes
|
5000TC + 730 Days
|
|
5- HF 50%-4min.
|
Conditioning with 50% hydrofluoric acid for 4 minutes
|
5000TC + 730 Days
|
| *TC = Thermocycles |
Atomic Force Microscopy (AFM) analyzes were performed on 2 samples of each material, using a commercial AFM (Veeco Metrology Group, Santa Barbara, CA, USA) in contact mode (cantilevers) with a constant spring of 0.1 N/m and OTR 8–35 Nanoprobe SPM Tips. Images (30 × 30 µm) were obtained at a resolution of 512 × 512 pixels, and analyzed using dedicated software (Nanoscope v616r1, Veeco Metrology Group and WSxM 4.0 Develop 11.1, Nanotec Electronica, TreaCantas, Spain). At the Laboratory of Evaluation and Development of Biomaterials of the Northeast (CERTBIO), of the Department of Materials Engineering, of the Federal University of Campina Grande.In the experimental group where the zirconia surface was etched with 40% hydrofluoric acid for 2 minutes, only one atomic force microscopy image was obtained*
Immediately after surface treatment of the zirconia specimens as described in Table 2, all groups were cemented with Panavia F 2.0 resin cement, as recommended by the manufacturer. For this, the composite resin cylinders previously made had their bonding surface conditioned with 37% phosphoric acid Condac 37 (FGM - Brazil) for thirty seconds, washed with water/air for the same time and dried with absorbent paper. Liquids A and B of the ED primer, which comes with the Panavia F 2.0 cement, were mixed, which was applied for 30 seconds on the surface of the resin cylinders, after this waiting time, they received a jet of air, free of water for 15 seconds. and excess primer was removed with absorbent paper. Soon after, the base and catalyst pastes of Panavia F 2.0 were mixed, in a block of paper, supplied by the manufacturer, for 20 seconds and it was placed on the surface of the zirconia cylinders. The resin cylinder already prepared was placed on the cement and a weight of 500 grams was placed on the zirconia-cement-resin set for 20 seconds, to avoid air bubbles, after removing the weight, the excess cement was carefully removed with micro applicator and explorer probe nº 5. Before light curing, the water-soluble gel oxyguard II from the Panavia F 2.0 kit was applied to avoid non-polymerization of the surface layer of the cement, due to exposure to air. After this application, the set was light-cured for 40 seconds on 3 sides, at a light intensity of 1200 mW/cm 2 with a light-curing device, measured in a radiometer (Radii-cal SDI-Australia).It was waited for 3 minutes and the specimens were washed in running water (Fig. 4).
After cementation, all specimens were stored in distilled water at 37°C for 48 hours and then thermocycled for 5000 cycles in thermal baths at a temperature of 5°C to 55°C (± 3) with an immersion time of 30 seconds and transfer time of 2 seconds on average (Nova Ethics, Vargem Grande do Sul, SP, Brazil), at the Biomaterials Research Center (CPQB) of the Faculty of Dentistry/UPE. Subsequently, they were stored for 730 days in distilled water at 37°C in a bacteriological incubator (ODONTOBRÁS – IND. E COM. EQUIP. MED. ODONT. LTDA – Ribeirão Preto – São Paulo - Brazil) .
The specimens were adapted and secured in a specific device and taken to an EMIC universal testing machine, of the DL 10000 line ( São José dos Pinhais - PR, Brazil), of the Laboratory of Tests of the Department of Mechanical Engineering of UFPE, where it was applied a constant load with a speed of 1.0 mm/min, until fracture occurs. Figure 5. The load cell provided a force of up to 250N. The shear bond strength was calculated by dividing the maximum fracture load by the circular cementing area, using the formula for circular area - π .r², where π is equal to 3.1416 and the radius is equal to 2mm, since the diameter of the samples was 4mm. Results were expressed in mega pascals (Mpa) [14].
After testing in the universal testing machine, all specimens had their surface morphology evaluated in a binocular stereomicroscope, model Q744S, brand QUIMIS, with 40 times magnification [15] to count the failure mode that presented three forms: adhesive, mixed and cohesive.
The failure mode classification was: adhesive (with less than 1/3 of the luting material attached to zirconia), cohesive (when there was more than 2/3 of the luting material attached to zirconia), mixed (when there was more than 2/3 of the luting material attached to zirconia and less than 2/3) [16; 17].
Data were descriptively analyzed using the following measures: mean, standard deviation, coefficient of variation, median and the 25th and 75th percentiles. The F test (ANOVA) for one factor and the multiple comparison tests were used to compare groups of size. The choice of the F test (ANOVA) was due to the verification of the normality of the data in each group and the comparisons of Size due to the significant difference in the variances between the groups. Fisher's exact test was used to assess differences between groups in relation to categorical variables. The verification of the hypothesis of normality was performed using the Shapiro-Wilk test and the hypothesis of equality of variances was carried out using the Levene F test. The level of significance used in the decision of the statistical tests was 5%. The data were entered into the EXCEL spreadsheet and the program used to obtain the statistical calculations was the IMB SPSS version 25.