Data
In order to develop and prospectively test DL models designed to fully automate FB and AFV assessment, the models were trained on a newly constructed database of 172,293 de-identified fetal ultrasound images that were collected from 12,356 US examinations performed in six health centers in two different cities of Morocco between 2015 and 2021. In addition publicly available datasets, using the following ultrasound machines: General Electric’s Voluson E6, E8, E10, S8 and S10, and Aloka17.
Within the collected data, 30,249 2D standard biometry planes of the abdomen, brain, and femur were preprocessed and annotated based on the pixelated annotations (images containing calipers - acronyms referring to biometry measurements) and annotated. In addition, ground truth masks were automatically extracted at the preprocessing step to alleviate the work of annotators in the segmentation tasks. In total, fifteen human annotators (ranging from medical students to Radiology and Obstetrics professors) participated in the annotation process using our bespoke annotation platform based on the open-source tool Label Studio19 that we adapted to our needs. Each annotation included the type of standard plane (abdomen, brain, femur) and some of the quality criteria associated with it as described by the International Society of Ultrasound in Obstetrics and Gynecology (ISUOG) guidelines20 (Table 1) and polygonal segmentation in the case of the femur. A further distinction between transthalamic, transcerebellar and transventricular planes was made by the annotators. Quality criteria such as the zoom (head, abdomen, femur occupying more than half of the image – caliper placement – angle of the femur to the horizontal < 45 °) were omitted in the annotation process. Instead, their detection was automated through fetal structure segmentation: calculating the surface ratio of the structure to the whole image or the angle of the femur to the horizontal to determine conformity to the criteria described by Salomon et al21 (Table 1). That step was designed to ensure that the models select the best suitable plane on a given video loop, detecting the presence or absence of the quality criteria, and displaying them with the measurement, allowing an insight into the model’s choice as well as a correction if necessary.
Images were also annotated according to the presence or absence of an AF-pocket defined as an in-utero fluid pocket free of fetal parts or umbilical cord. In the case of the presence of the AF pocket, annotators were asked to segment it manually.
Figure 1 summarizes the amount of annotated data for the segmentation of the three biometric structures and their classification based on their respective quality criteria, along with the number of individual measurements in the annotated data for the classification and segmentation of AF pockets.
Table 1: Criteria for score-based biometry plane assessment developed by Salomon et al21 Models’ performance on the retrospective data

Segmentation and Classifications Models
We assessed the performances of our models on the retrospective test sets comparing them to the experts’ annotations for standard plane detection, quality criteria detection, fetal structure segmentation and AF-pocket detection and segmentation.
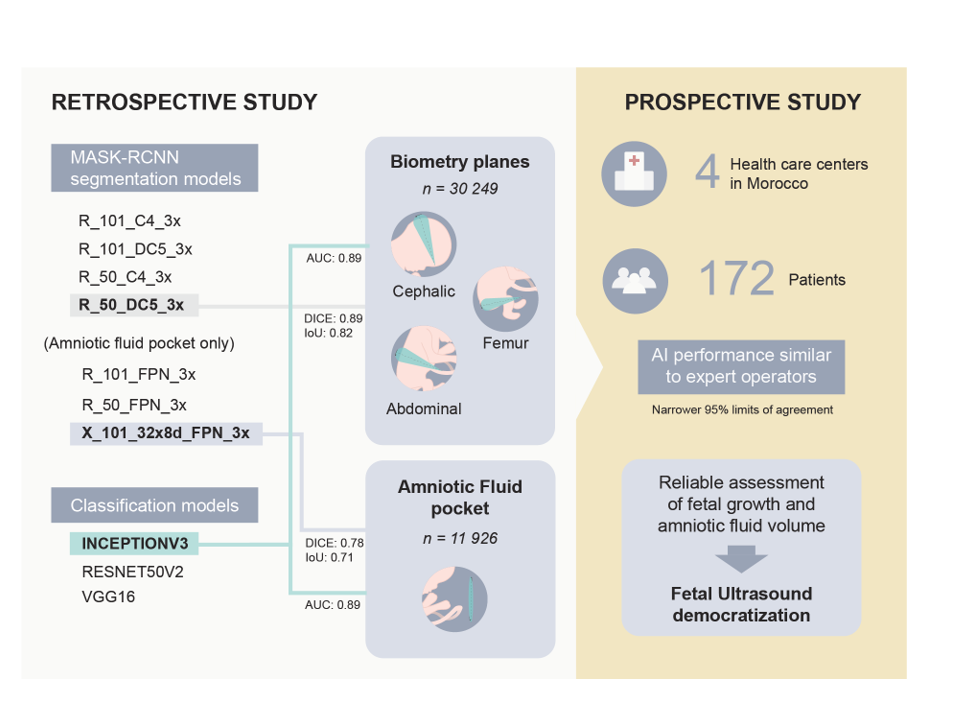
For the standard plane detection and anatomical regions (brain, abdomen, and femur) segmentation, four MASK-RCNN models were finetuned (R_101_C4_3x, R_101_DC5_3x, R_50_C4_3x, R_50_DC5_3x). The R_50_DC5_3x model achieves the best performance with an average DICE score of 0.89 and an Intersection over Union (IoU) score of 0.82 versus 0.96 and 0.90 respectively reported with the FUVAI model14 (figure 2). The Segmentation of the brain region achieved the best performance with a DICE score of 0.95 and an IoU of 0.91.
For each biometry plane, classification models for quality criteria detection were assessed on the test set of the retrospective data (figure 3). Assessment of the quality of the standard biometry plane allows for better reproducibility of the AC measurement, we assessed 4 quality criteria (kidneys not visible (A_KN), plane showing portal sinus (A_PS), plane showing stomach bubble (A_SB), symmetrical plane (A_SYM)) leaving out the image zoom quality criteria that is the only one that is not qualitative and can be inferred directly from the abdomen segmentation. Based on three fine-tuned models (INCEPTIONV3, RESNET50V2 and VGG16), INCEPTIONV3 shows the best results for all the criteria with an average area under the curve (AUC) of 0.86. The results also show that A_SB criterion is detected better compared to other criteria with an AUC of INCEPTIONV3 of 0.93.
For the classification of the brain plane, five quality criteria were assessed: cerebellum not visible (B_CB), plane showing cavum septum pellucidity (B_CS), plane showing posterior horn of lateral ventricles (B_PVV), symmetrical plane (B_SYM) and plane showing thalami (B_TH). Similarly, the 3 classification models were finetuned for this task. They show very similar results with an average AUC of 0.83. The results also show that the B_CB criterion is well detected compared to other criteria with an AUC of INCEPTIONV3 of 0.95 (figure 3).
For the femoral plane, the performances of the model designed to detect if both ends of the femur are clearly visible were poor as inter-observer variability was high in the training set, thus, it was not used for image quality scoring. For the femoral plane on the prospective part of the study, the size, subsequent femur to image sizes ratio, and angle of the femur were directly obtained from the femur segmentation stage and kept as the only quality criteria.
For the AF Pocket classification, we compared the finetuned models (RESNET50V2, INCEPTIONV3 and VGG16) on the retrospective test set (figure 4). The results show almost equivalent AUC scores of 0.89. Similarly, we compared 7 finetuned MASK-RCNN models ('R_101_C4_3x', 'R_101_DC5_3x', 'R_101_FPN_3x', 'R_50_C4_3x', 'R_50_DC5_3x', 'R_50_FPN_3x', 'X_101_32x8d_FPN_3x') for the segmentation of the AF pocket region (figure 4). The results show that 'X_101_32x8d_FPN_3x' achieved the best performance with a DICE score of 0.78 and an IoU of 0.71 versus a DICE of 0.877 for the state of the art model by Cho et al.33 who tested the model on only 125 images.
From this retrospective study, we adopted the finetuned R_50_DC5_3x model for the segmentation of the fetal structures, the finetuned INCEPTIONV3 models for the quality criteria and the AF pocket detection, and the finetuned X_101_32x8d_FPN_3x model for the AF pocket segmentation. These models will then be evaluated on the prospectively acquired data.
Models performance on the prospective evaluation
Study population
From October 2021 to April 2022, 172 patients with singleton pregnancies were included in our prospective study. Multiple pregnancies were not an exclusion criterion, and patients were included even in the case of partially complete examinations. However, duplicates and patients without an image nor cine-loop available or no corresponding ground truth measurement obtained were excluded (figure 5). In total, the study gathered: 142 different cine-loops containing a femoral plane; 144 containing an abdominal plane; 123 containing a cephalic plane; and 90 containing AF-pockets.
The US machines and healthcare centers from which the prospective data differed from those of the retrospective data were retained. Three of the four centers where the prospective part of the study was conducted did not participate in the retrospective data collection. Several US machines used in the prospective testing were not present in the retrospective data as well: Mindray DC 40 and Resona 6, Philips Medical Systems Affinity 50W and 70G, GE Voluson P8.
When possible, EFW and GA were computed from all measurements using the recommended Hadlock and Intergrowth formulae29,30 and all necessary measurements performed by the doctors with the corresponding available cine-loops.
Hadlock formula for EFW estimation29:
Intergrowth recommended formula for GA estimation > 14 weeks30:
Overall, the mean GA estimated by the operators was of 30 weeks and 3.13 days ± 6 weeks and 3.1 days (range: 15 weeks and 2 days – 41 weeks and 2 days), the mean measured HC, BPD, AC, FL, EFW and SDP were respectively of 26.37 ± 5.88 cm (range: 11.29 – 34.71 cm), 7.41 ± 1.72 cm (range: 3.09 – 10.07 cm), 23.98 ± 6.58 cm (range: 8.95 – 38.18 cm), 5.28 ± 1.44 cm (range: 1.52 – 7.86 cm), 1606.78 ± 957.56 g (range: 108.81 – 3783.86 g and 5.25 ± 2.22 cm (range: 2.15 – 17.37 cm).
The models segmented each relevant anatomical region and then extracted the planes with the highest composite score, including quality score according to the ISUOG subjective quality criteria, the zooming of the image inferred from the anatomical segmentation to total image ratio, and the confidence of the model’s prediction (figure 6).
The models were able to extract measurements from all the videos containing standard biometry planes. The 95% limits of agreement expressed in percentage using the Bland-Altman method were of 2% for HC, 4.2% for BPD, 3 % for AC, 5.1% for FL, 2.7% for GA, 8% for EFW and 26 % for SDP. All percentages found are narrower than reported inter and intra observer limits of agreements among sonographers (HC: 3.0%, AC: 5.3%, FL: 6.6% for intraobserver difference and HC: 4.9%, AC: 8.8%, FL: 11.1 for interobserver difference)31(figure 6). Visual assessment of the Bland-Altman plots shows random artifactual bias for every parameter, the variability increasing with the size of the parameter. However, our results also show constant bias for SDP and FL, the predicted measurements for both parameters being consistently greater than those of the physicians.
This over-expectation of the femur segmentation by the model can be mitigated by reviewing the images manually. By selecting images with abnormal results, we found (figure 7) that the model often selected planes showcasing strictly horizontal femurs, and that the predicted calipers were placed avoiding the grand trochanter in accordance with measurement guidelines in contrast to some of the participating physicians32.
As for the SDP discrepancy, it appears as though the model actually detected deeper pockets not selected or measured by the clinician. However, the model’s failure can also be explained by a slight angulation of the probe from 90° results in a larger antero-posterior pocket diameter at the time of examination which will be construed as the SDP by our approach (figure 7).
The ICC for each measurement was high (>0.9 for all parameters apart from SDP) showing excellent reliability of the performed measurements: AC = 0.982, HC = 0.987, BPD = 0.975, FL = 0.945, GA = 0.978, EFW = 0.9713, SDP = 0.692.
The MAE for each biometric parameter was of 0.67 ± 0.69 cm for HC, 0.33 ± 0.22 cm for BPD, 0.27 ±0.40 cm for FL, 0.91 ± 0.81 cm for AC, 9.85 weeks ± 14.36 days for GA, 147.18 ± 177.97 g for the EFW and 1.46 ± 1.10cm for SDP (table 2).
The FUVAI model is the closest one to our approach for end-to-end automated biometric assessment from cine-loops and showed similar performances to those of trained sonographers14.
We computed the MAE of each parameter using the open source FUVAI model developed by Plotka et al.14 and compared them with our approach (table 2).
It showed inferior MAE compared with our approach for every biometric parameter except for BPD. We also note that our approach was able to correctly detect the entirety of the corresponding biometry plane while FUVAI failed to do so.
The MAE between the predicted SDP and the measured SDP was also lower than the one reported by Cho et al33 with their state of the art model for AF pocket segmentation: AF-net (1.46 cm with our approach vs 2.666 cm for Cho et al33 on a retrospectively annotated data-set).
There were no cases of oligohydramnios in the prospective set and 7 cases (7.07%) of polyhydramnios. The sensitivity and specificity of the models at detecting polyhydramnios was 86.6%, and 85.7% respectively when comparing them to the experts’ estimation.
The models’ estimated biometric parameters were computed during the prospective phase of the study at the earliest time after each examination was complete. No adverse effect was reported during the entirety of this study.
Table 2: Mean Absolute Error (MAE) for each predicted biometric value, EFW, and GA compared to clinicians and state of the art model FUVAI showing superior correct detection rates and lower MAE with our approach, except for the BPD measurement.
