Experimental animals and management
Two hundred and eighty-eight (288) Hy-Line Brown laying hens, at 34 weeks of age were used for this study. Laying hens were reared in a closed housing system, with forced ventilation and cage dimension of 60cm x 46 cm x 44 cm. Each cage was equipped with a nipple drinker, and contained 3 birds. Groups of 4 cages represented 1 replicate of an experimental unit (12 birds per replicate). Hens were randomized to have similar average laying rates of 86% per replicate. Birds were allowed 1 week adaptation period and fed basal diets (corn-soybean meal-based diet containing 16.5 % CP, 2700 ME kcal/kg, 3.5 % calcium and, 0.4% available phosphorus) before the start of the experiment. Afterward, hens were allowed ad-libitum access to water and experimental diets for the 8 weeks study period. Daily lighting regime was maintained at 16h light and 8h of darkness.
Experimental design and diets
Birds were arranged into 4 treatments, 6 replicates with 12 hens each. Dietary treatments were prepared by substituting L-citrulline powder (98%) for equal amounts of corn at quantities of 0, 0.25%, 0.5% and, 1.0% as shown in Table 1. L-Cit was purchased from Shandong Fosun Biotechnology Co., Ltd, China and, feed formulation was according to the National Research Council standard [35]. Experimental diets were prepared twice during the study period (4 weeks interval) to prevent feed deterioration and stored in a well-ventilated room. The experiment was conducted during the summer months of July and August.
Table 1: Calculated dietary composition and nutrient levels of experimental diets
|
|
Control
|
0.25% L-Cit
|
0.50 % L-Cit
|
1.00 % L-Cit
|
|
Corn (8.5% CP)
|
54.055
|
53.805
|
53.555
|
53.055
|
|
Wheat bran
|
7.99
|
7.99
|
7.99
|
7.99
|
|
Soya bean oil
|
1.79
|
1.79
|
1.79
|
1.79
|
|
Soybean meal, 43%
|
24.29
|
24.29
|
24.29
|
24.29
|
|
Salt
|
0.35
|
0.35
|
0.35
|
0.35
|
|
Limestone
|
9.6
|
9.6
|
9.6
|
9.6
|
|
Dicalcium phosphate
|
1.44
|
1.44
|
1.44
|
1.44
|
|
Choline chloride, 50%
|
0.09
|
0.09
|
0.09
|
0.09
|
|
|
0.1
|
0.1
|
0.1
|
0.1
|
|
DL- Methionine, 99%
|
0.17
|
0.17
|
0.17
|
0.17
|
|
Mineral premix 1 ,0.1%
|
0.1
|
0.1
|
0.1
|
0.1
|
|
Vitamin premix 2 ,0.025%
|
0.025
|
0.025
|
0.025
|
0.025
|
|
L-citrulline , 98%
|
0
|
0.25
|
0.5
|
1
|
|
Total
|
100
|
100
|
100
|
100
|
|
Nutrients levels
|
|
|
|
|
|
Total CP , %
|
16.5
|
16.85
|
17.19
|
17.89
|
|
Non-citrulline CP, %
|
16.5
|
16.48
|
16.46
|
16.42
|
|
Metabolizable energy, kcal/kg
|
2700
|
2700
|
2700
|
2700
|
|
Calcium, %
|
3.5
|
3.5
|
3.5
|
3.5
|
|
Available Phosphorus, %
|
0.404
|
0.404
|
0.404
|
0.404
|
|
Digestible Lysine (Poultry)
|
0.78
|
0.78
|
0.78
|
0.78
|
|
Digestible Methionine (Poultry)
|
0.4
|
0.4
|
0.4
|
0.4
|
|
Digestible Methionine + Cysteine (Poultry)
|
0.619
|
0.619
|
0.618
|
0.616
|
|
Digestible Threonine (Poultry)
|
0.505
|
0.504
|
0.504
|
0.502
|
|
Digestible Tryptophan (Poultry)
|
0.161
|
0.161
|
0.161
|
0.161
|
1 The mineral premix provide the follow quantities per kilogram of diet: iron, 55 mg; selenium, 0.3 mg; copper, 5.5 mg; Zinc, 88 mg; I, 1.7 mg; manganese, 88 mg. 2 The vitamin premix provide the follow quantities per kilogram of diet :vitamin A, 8800 IU; vitamin D3, 3300 IU; vitamin K, 2.2 mg; vitamin E, 16.5 IU; cholecalciferol, 2800 IU; riboflavin 18.0 mg; niacin, 50 mg; pantothenic acid, 28 mg; biotin, 0.1 mg; folic acid, 0.6 mg.
Production performance
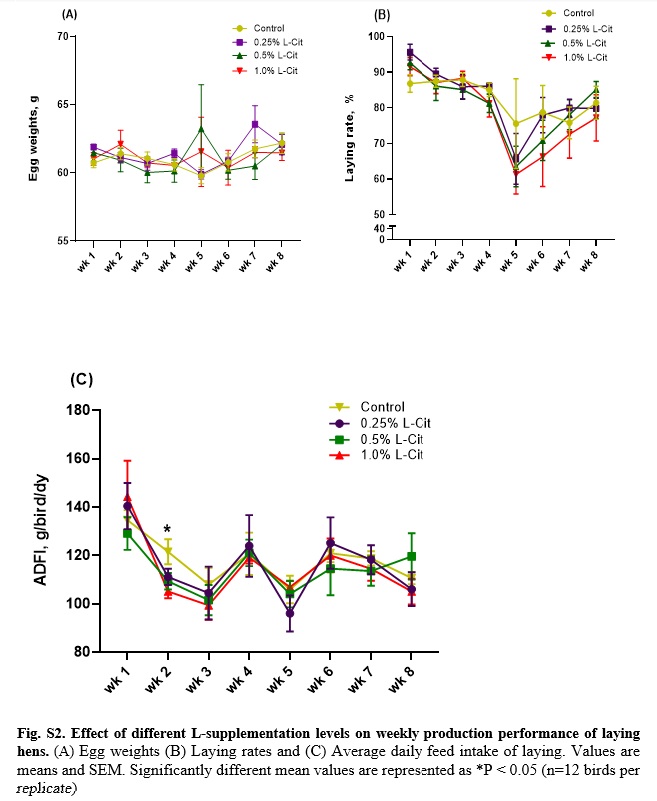
Egg production and egg weights were recorded daily, while body weights and feed intake were recorded weekly throughout the experimental period. Data computed were feed conversion ratio (FCR), laying rate, and egg mass. FCR was calculated as the ratio between feed intake and egg mass.
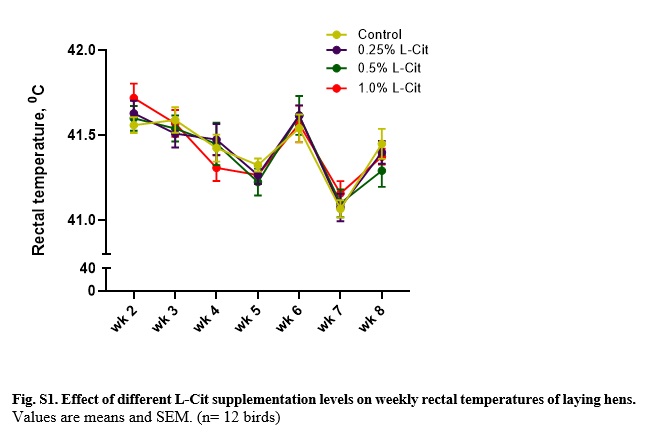
Air and rectal temperature monitoring
Air temperature was monitored during the experimental period using temperature data recorder (ZDR-41, ZaDa, HangZhou, China) which were strategically wired on the cages to record from the 3 tier positions (top, middle and bottom). Air temperature logging was carried out for 6 weeks during the experimental period. Rectal thermometer was used to record cloacal temperatures from 2 hens per replicate weekly, by inserting probe 2-3cm within rectum for 60 seconds.
Egg quality assessment
In the 8th week, random samples of 10 eggs per replicate (total of 240 eggs) were collected on a single day. Egg quality indices such as egg weights, yolk weights, and shell weights were measured using a sensitive weighing balance. Yolk color (1 to 15 based on the yolk color chart), yolk grade (AA, A, B or C), albumen height (± 0.1 mm), and Haugh unit (0~130) were measured using automatic egg multi tester (EMT-5200, Touhoku Rhythm Co. Ltd., Japan). Shell thickness was measured using an echometer (D-56 Wuppertal 1, Karl Deutsch), egg lengths, and egg width were measured using the vernier caliper. Egg shape index was calculated as egg breadth/egg length, and albumen weight was computed as the difference between egg weight, shell weight, and yolk weight.
Blood sampling and analysis
Blood samples were collected twice during the experiment, at the 4th and 8th week, the hens were fasted for 12 h before sampling. Blood sample was collected from the wing vein using a heparinized syringe of 5 mL capacity, with 23 guage (0.6 x 25mm) hypodermic needles. Plasma and serum samples were obtained after centrifugation at 3000×g for 10 min at 40C and stored at −20◦C until further analysis.
Plasma metabolites
Plasma concentrations of glucose, aspartate aminotransferase (AST), urate, and total protein were measured spectrophotometrically using Hitachi L-7020 automatic biochemical analyzer (Hitachi High-Technologies Corp., Tokyo, Japan). Plasma triglyceride (TG) and total cholesterol (TCH) were detected with test kits according to the manufacturer’s guidelines (Jiancheng Bioengineering Institute, Nanjing, Jiangsu, China). TG was determined via glycerol phosphate oxidase peroxidase assay, with repeatability (CV) ≤ 4.0% and inter-assay difference ≤ 6.0%. TCH assay was based on the enzyme-coupled reaction that quantifies both cholesterol esters and free cholesterol, with a repeatability (CV) ≤ 3.0% and inter-assay difference ≤ 5.0%. Calorimetric determination for TG and TCH was at 540nm using a microplate reader (Elx808, Bio-Tek Winooski, VT).
Amino acid (AA) profiling
Free AA concentration in serum was determined by ion-exchange chromatography using Hitachi L-8900 Amino acid Analyzer (HITACHI High-Tech Science, Japan). Serum sample (1mL) was mixed with 40 mg of salicylic acid to allow deproteinization, then vortexed and stored at 4°C for 10 to 12 hrs. Thereafter, samples were centrifuged at 4°C, 12000g for 30 min, and the supernatant was collected and passed through a filter (0.22 µm) before reading in the amino acid analyzer. The ratios of circulating amino acid metabolites associated with arginine metabolism were calculated [36].
Determination of nitric oxide concentration
Nitric oxide actively metabolizes into nitrite (NO2−) and nitrate (NO3−) and the sum of both nitrate and nitrite concentrations (NO2− +NO3−) represents the levels of nitric oxide (NOx) in vivo. In this study, the concentration of NO2− was measured by color intensity after the reduction of NO3− into NO2− by nitrate reductase. NOx concentration in plasma was detected using a commercial kit (Jiancheng Bioengineering Institute, Nanjing, Jiangsu, China). Supernatant was collected and absorbance was detected at 540 nm using a microplate reader (Elx808, Bio-Tek Winooski, VT).
Detection of nitric oxide synthesis
Systemic nitric oxide synthase activity, that is, total NOS (tNOS) and inducible NOS (iNOS), were tested with commercial kits according to the manufacturer’s protocols (Jiancheng Bioengineering Institute, Nanjing, Jiangsu, CN). NOS catalyzes the reaction of L-arginine and molecular oxygen to produce NO. The NO formed reacts with nucleophilic substances to produce nonferrous compounds. The presence or absence of calcium was used to determine the calcium-dependent activity of tNOS and calcium-independent activity of iNOS [37]. The reaction’s absorbance was measured with 1cm cuvets at 530 nm using a UV-2450 spectrophotometer (Beijing PGeneral, Beijing, CN).
Anti-oxidant parameters
Plasma antioxidant parameters including superoxide dismutase (SOD), total antioxidant capacity (T-AOC), glutathione peroxidase (GSH-Px), catalase (CAT) and malondialdehyde (MDA) were determined using commercial kits based on manufacturer’s guidelines (Jiancheng Bioengineering Institute, Nanjing, Jiangsu, China).
T-AOC was determined based on the ferric reducing antioxidant power assay (FRAP) principle where antioxidants reduce ferric tripyridyltriazine complex (Fe3+-TPTZ) to ferrous tripyridyltriazine (Fe2+-TPTZ) and the reaction absorbance was read at 570nm. For SOD activity, samples were pre-tested to achieve 40-60 % inhibition rates. The assay was performed with an intra-assay CV of 5.05% and inter-assay CV of 3.32% at 450nm absorbance. CAT activity was determined using the visible light method where hydrogen peroxide (H2O2) is decomposed by CAT and ammonium molybdate is added to stop the reaction. The remaining H2O2 reacts with ammonium molybdate to form a complex which was determined at 405nm and calculated as catalase activity. GSH-Px catalyzes the reaction of H2O2 with reduced glutathione to produce water. GSH-Px activity was determined by expressing the consumption of reduced glutathione in the reaction system at 412 nm. Pre-testing was carried out to determine the correct dilution ratio of 45-50% inhibition rate. Also, the extent of lipid peroxidation was tested using the thiobarbituric (TBARS) principle of malondialdehyde activity, absorbance was measured at 532 nm. The reaction absorbance for SOD, CAT, GSH-Px, MDA, and T-AOC were measured using a microplate reader (Elx808, Bio-Tek Winooski, VT).
Statistical analysis
Data collected were analyzed with one-way ANOVA using Statistical Analysis Software (version 8e; SAS Institute, Cary, NC, United States). The data were presented as mean ± SEM. Differences between the means were evaluated using Duncan’s Multiple Range Test. Linear and quadratic regression were carried out using R Studio version 1.2.5042 [38]. Differences were considered significant at P < 0.05