3.1. Structure and Feature of the Chloroplast Genome of I. britannica.
The chloroplast genome of I. britannica is characterized by a typical circular DNA molecule with a length of 150,774 bp. The genome had the typical quadripartite structure, consisting of a large single-copy (LSC) region, a small single-copy (SSC) region, and a pair of inverted repeats (IRs) regions, which were 82,451 bp, 18,423 bp, and 24,950 bp long, respectively (Figure S1). The GC content of the total genome, LSC, SSC, and IR regions was 37.72%, 35.97%, 31.28%, and 43.01%. The contents of IR regions were higher than LSC and SSC regions. The length of the protein-coding sequence (CDs), rRNA sequences, and tRNA sequences were 78703 bp (52.20%), 9394 bp (6.23%), and 2726 bp (1.81%) long, respectively. The non-coding region of the chloroplast genome of I. britannica mainly consisted of introns and gene spacer regions, which accounted for 39.76% of the entire genome length (Table S2).
The chloroplast genomes of the six Inula species were not highly conserved, with lengths ranging from 150 428 (I. japonica) to 152 592 bp (I. racemosa), with a difference of 1838 bp. The genome sizes were closely associated with the length of LSC and SSC regions. The overall GC content did not vary significantly, ranging from 37.68% (I. racemosa) to 37.73% (I. helianthus-aquatilis). The difference in the LSC regions (1215 bp) was more significant than in the SSC regions (166 bp) and IR(233 bp) regions in the six Inula species. The GC contents of IR regions were higher than those of SSC and LSC regions in all six Inula species (Table S2).
The chloroplast genome of I. britannnica encoded 109 unique genes and a total of 130 genes. In the chloroplast genome, the numbers of unique protein-coding genes (PCGs), rRNA genes, and tRNA genes were 79, 4, and 28, respectively (Table S2). The number of genes encoded by the six Inula chloroplast genomes ranged from 129 (I. helianthus-aquatilis) to 131 (I. racemosa) (Table S2), with an average number of 115 homologous genes, including 81 PCGs, eight rRNAs and 26 tRNAs (Table S3). Three PCGs: ndhD, psbN, and ycf15, were missing in I. helianthus-aquatilis, and the psbL was absent in I. racemosa. The pbf1 was found only in I. helianthus-aquatilis (Table S4). In addition, 15 tRNA genes are found to differ in six species.
A total of 18 genes had introns in I. britannica (Table S5). Among them, eight PCGs (atpF, ndhA, ndhB (×2), rpl2 (×2), rpoC1, and rps16) contained one intron, eight tRNA genes (trnA-UGC (×2), trnC-ACA, trnG-UCC, trnI-GAU(×2), trnK-UUU, trnL-UAA) had one intron. Two PCGs (ycf3, clpP) harbored two introns (Table S6). Among the six Inula species, trnK-UUU had the longest intron, 2535 bp long, including the embedding matK gene. I. lineariiflia and
I. helianthus-aquatilis chloroplast genomes also have 18 genes with introns (Figure S2). I. racemosa chloroplast genome had the most intron-containing genes of 20. In contrast, I. hupehensis and I. japonica had the minor intron-containing genes of 17. The petB and rpl16 genes were detected in I. racemosa, and trnC-ACA and two trnE-UUC genes were present in I. britannica,
I. lieariifola, I. racemosa, and I. helianthus-aquatilis. In contrast, two trnI genes were found only in
I. japonica and I. hupehenisis. The longest intron was found in trnK-UUU of I. racemosa with a size of 2554 bp.
3.2. SSR and Repeat Structure Analyses
The numbers of Simple Sequence Repeats (SSRs) ranged from 26 (I. racemosa) to 35 (I. britannica). Mononucleotide repeats were the most abundant in all six Inula chloroplast genomes. A/T repeat was the most abundant. Moreover, their numbers ranged from 27 to 34. Dinucleotide and trinucleotide repeat sequences only constituted a small fraction of all repeat motifs. In the chloroplast genome of I. britannica, 35 microsatellite sequences were found. The primary type was A/T (34), accounting for 97.14% of the other types. There was only one AT/AT sequence (Figure S3-A).
Repeated sequences can play an essential role in genome recombination and rearrangement and might also contain phylogenetic information in some taxa. In this study, 19 tandem repeat sequences were found in the chloroplast genome of I. brithannica. The repeat unit length was more than 20 bp, and the similarity between repeat units was more than 90%. Among them, the most extended tandem repeat sequence was 32 bp with 93% similarity (Table S7). Similar repeat lengths were observed in the other five Inula species. The number of tandem repeat sequences of the other five Inula species was about 18–22, similar to that of the I. britannica (Figure S3-B). The most extended repeat unit in the six Inula species was 45 bp from I. racemosa (Figure S3-C).
Dispersed repeats were another type of repeat sequence distributed in the genome in a scattering manner. Dispersed repeats include palindromic repeats and forward repeats. Twenty palindromic repeats and 17 direct repeats were identified in the chloroplast genome of I. britannica. The most extended scattered sequence was one forward repetitive sequence with 56 bp long (Table S8). We found that the number of direct repeat units was the largest in the chloroplast genome of I. linariifolia, and the number of palindromic repeats was the smallest in I. racemosa. The lengths of the direct and palindromic repeats were mostly 30–39 bp, with a few being 40–49 bp or 50–59 bp in six Inula species (Figure S3-D).
3.3. Codon Usages
The RSCU of the chloroplast genomes of six Inula species was calculated on all PCGs. The codon content of 20 amino acids in all PCGs of the chloroplast genome of I. britannica is shown in Figure S4. The amino acids Met, and Trp was encoded by a single codon, AUG, and ACC, respectively. The other 18 amino acids were encoded by two to six codons, showing a clear preference for codon usage. The values indicated the most abundant amino acid in the I. Britannica was AGA-Arg (2); the least abundant one was CGC-Arg (0.46).
A heatmap describing the clustering of the RSCU values of six Inula species is shown in Figure S5. Results showed that the codon preference was almost identical in these species. The codons UUA-M (methionine, Met) and UGA-W (tryptophan, Try) in all six species had no bias (RSCU = 1), so were AUA-I (I. britannica and I. racemosa), CGA-R (I. britnanica), GCC-A (I. racemosa), and UGG-* (I. racemosa). Concurrently, the numbers of codons with RSCU > 1 and RSCU < 1 were similar. For the 30 most frequent codons, the codons all ended with purine A or T, except TCC-Ser and GGG-Gly. Moreover, for all codons, a bias in favor of purine (A/T) at the third codon position was apparent, similar to those reported before [43].
3.4. Boundary Expansion Analysis of Six Inula Chloroplast Genomes
Analysis of dot plots with Gepard software showed that the SSC regions of the chloroplast genome of I. japonica and I. linariifolia were in the same direction as the Arabidopsis thaliana. In contrast, the SSC regions of the four species, including I. britannica, were in directions opposite to those of A. thaliana (Figure S6). To better compare the similarity and diversity of the chloroplast genomes of the six Inula species, the sequences of the SSC regions of I. japonica and I. linariifolia were reverse-complemented in the following analysis. We then compared the six Inula chloroplast genomes using mVISTA program using I. hupehensis as a reference (Figure S7). The alignment revealed a high degree of similarity among the six Inula species. The non-coding regions were more divergent than the coding regions.
IR boundary analysis of six complete plastomes of Inula species showed that the contraction of IR expansion is consistent across the six Inula species regardless of the direction of the SSC regions (Figure S8). The result indicated two variations in the chloroplast genome of I. racemosa. Firstly, a 576 bp fragment of the ycf1 gene in I. racemosa was found in the border area IRa region adjacent to the SSC region. Secondly, rps19 genes were located in the LSC region except that of the I. racomosa, for which most sequences were located in the LSC regions, and only a 20 bp long fragment was in the IRb regions.
3.5. Identification of Hypervariable Regions and Molecular Markers
To identify highly variable regions that could be used as molecular markers for Inula species authentication, we calculated the genetic distances among the intergenic spacer regions (IGS) using the kimura 2-parameter (K2p) model. The K2p values ranged from 0.142 to 18.88. Fourteen genes had the highest K2p values: trnC-GCA-petN (18.88), rpoB-rpoC1 (14.90), trnE-UUC-rpoB (9.70), trnY-GUA-trnE-UUC (9.27), ccsA-trnL-UAG (5.19), trnL-UAG-rpl32 (4.99), rps19-rpl2 (4.84), ycf3-trnS-GGA (4.69), rpl22-rps19 (4.31), ycf1-rps15 (3.55), trnF-GAA-ndhJ (3.41), trnT-UGU-trnL-UAA (3.22), trnM-CAU-atpE (3.18), psbC-trnS-UGA (3.15). They were most suitable for molecular marker development (Fig. 2).
In addition, we used the Ecoprimer program to identify molecular markers. Six pairs of molecular makers were found (Table 1 ). These regions can also be used for maker development.
3.6. Phylogenetic Analysis
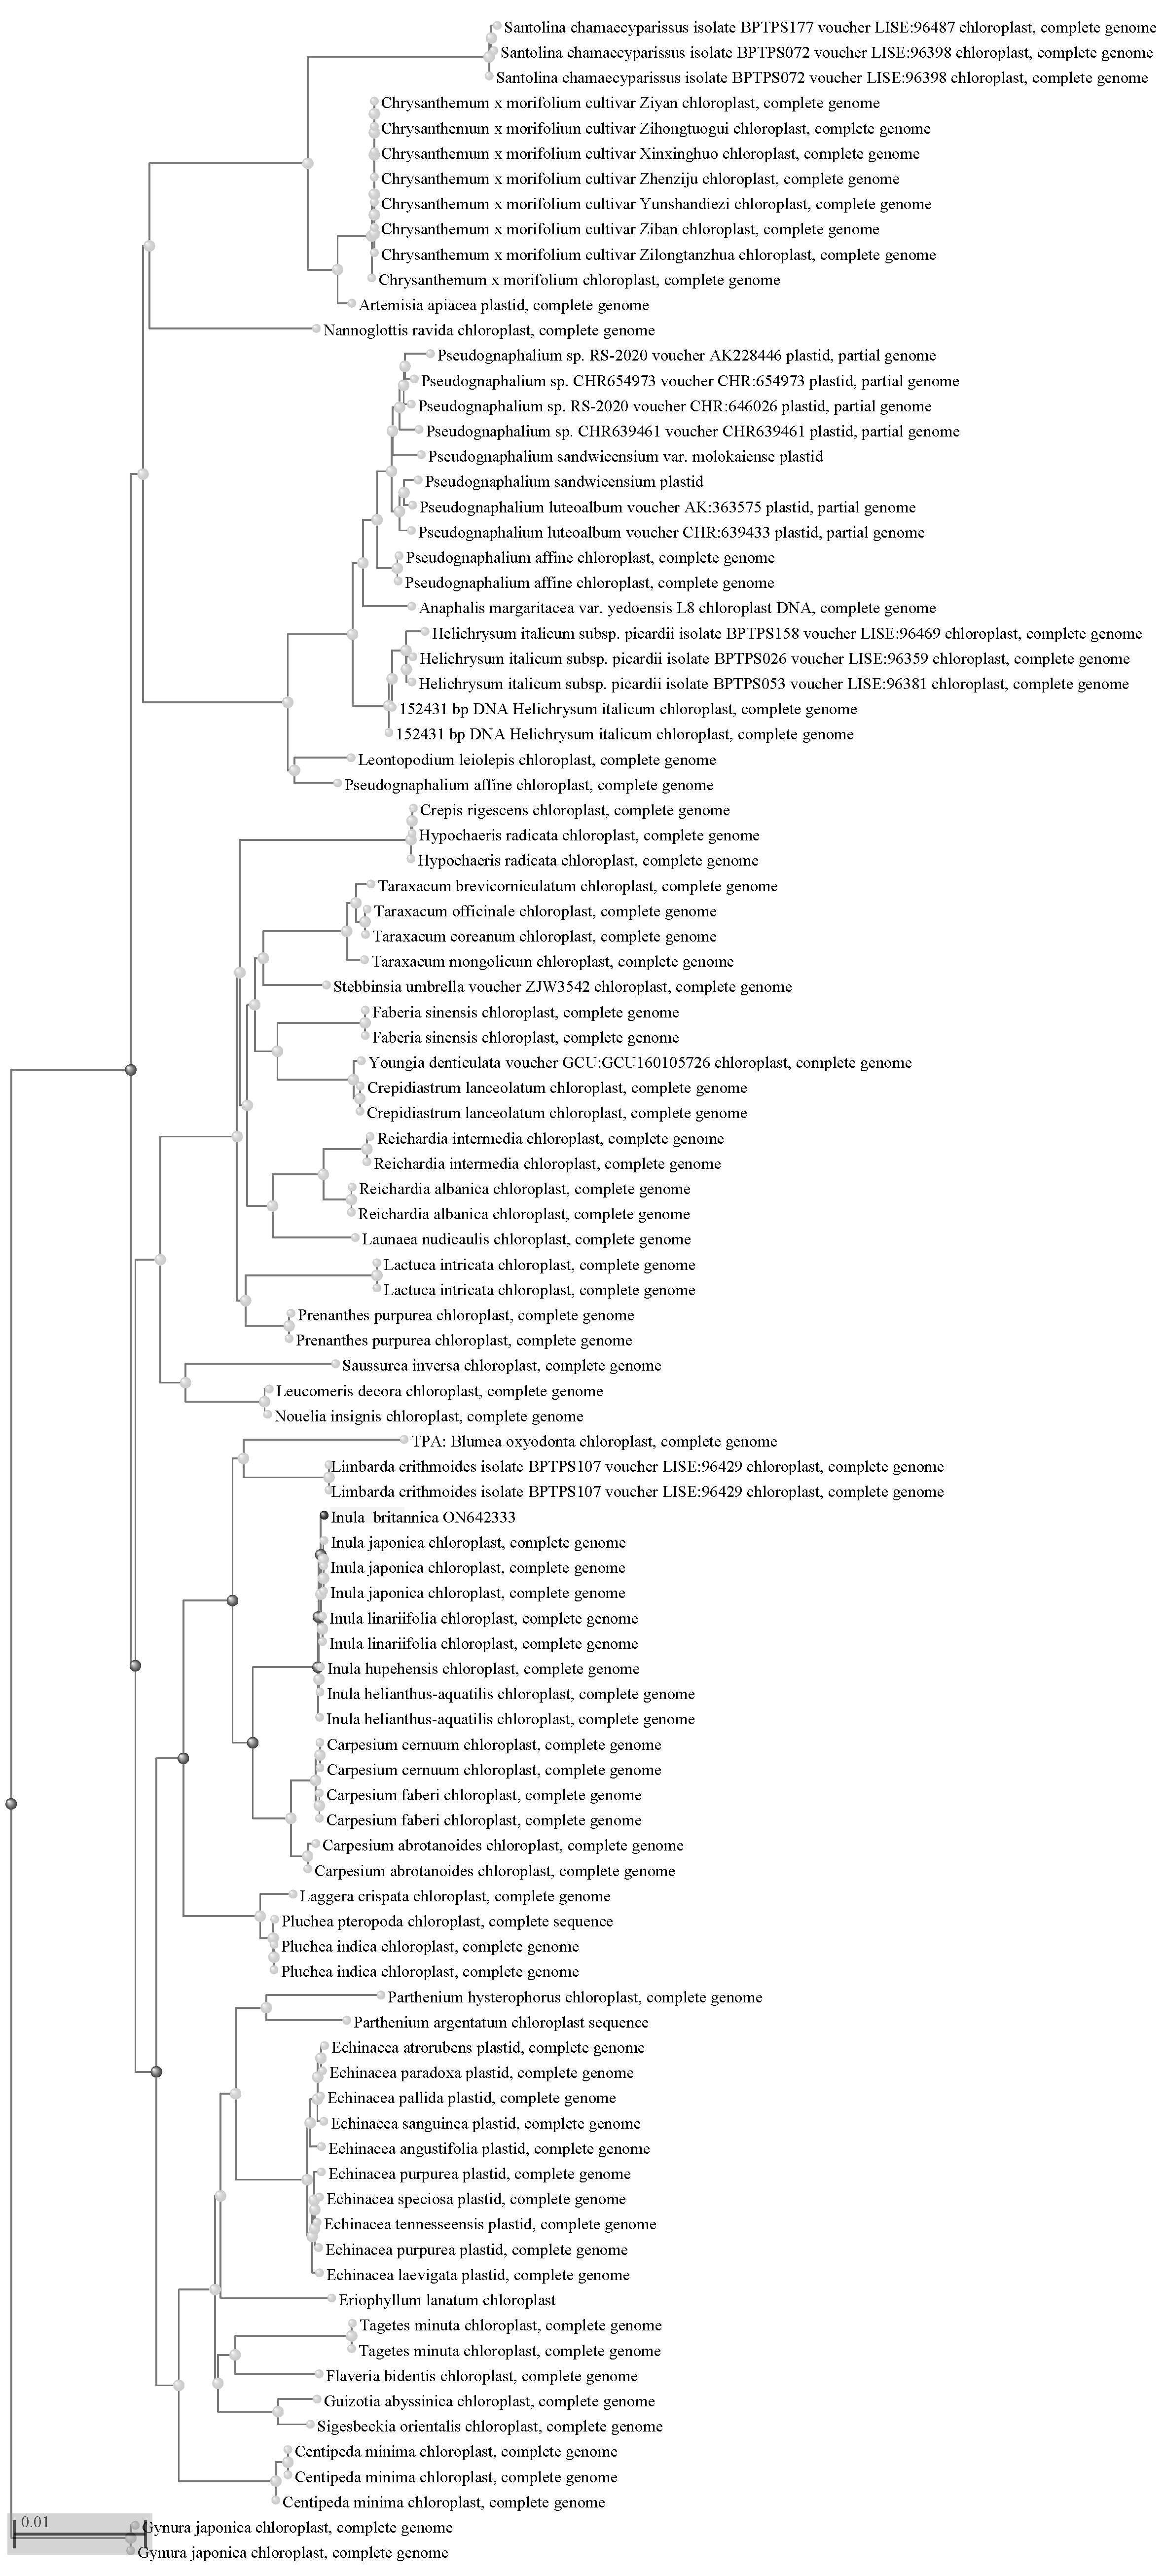
To determine the phylogenetic positions of the Inula species, we extracted the protein sequences from 72 common protein-coding genes of the 17 Inulae species. We conducted phylogenetic analysis, with Chrysanthemum vestitum as the outgroup. The topologies of the phylogenetic trees obtained using ML and BL methods were generally consistent. Most nodes in the phylogenetic tree were supported with large bootstrapping values, indicating the robustness of the trees. It can be seen that I. Britannica is most closely related to I. japonica and I. linariifolia。However, I. racemosa was divided from the other five species and was clustered with the Tugarinovia mongolica belonging to Tugarinovia of subtribe Inulinae (Fig. 3). Subsequently, we construted phylogy tree of subfamily Asteroideae species, Same result were found, I. britannica was clusted with I. japonica and linariiflia, I. racemosa wasnot grouped with Asteroideae species, but clustered with Synurus deltoids and dolomiaea calophylla, which belonged to subfamily Carduoideae (Fig. 4).
3.7. Morphological Characters Evolution
The evolutionary relationships of the five Inula species were then analyzed with their morphological characters (Fig. 5). The analysis of the achenes with hair or not of Inula indicated that the ancestral state of the achenes is hairless and then shaggy (Fig. 6a). Puberulent evolved at least twice. The flower with a diameter > 5 mm was the ancestral state of the Inula species (Fig. 6b). Furthermore, semi-spherical involucre was the ancestral state in Inula (Fig. 6d). Our data suggest that I. racemosa inflorescence is the ancestral state of Inula, then monothetic capitula (Fig. 6e). However, ancestral state reconstruction for leaf shape showed that this character exhibited random diversity among Inula plants, and its ancestral state was equivocal (Fig. 6c)..
3.8. Divergence Time estimation
The divergence time of the I. britannica with the other three Inula species, I. hupehensis, I. japonica, and I. linariiflia, was estimated to occur in the late Pliocene (~ 3.25 Mya, 95% PHD = 2.67 ~ 3.83 Mya, Fig. 6). The diversification of I. japonica, and I. leariifolia, was 0.022 Mya; they were split with I. hupehensis at about 0.07 Mya in the Pleistocene. I. racemosa arose at around 10.46 Mya (95% PHD = 9.25 ~ 11.66 Ma). The I. helianthus-aqutilis originated at 26.08 Mya (95% PHD = 24.28 ~ 27.97 Ma) in Miocene.
