Patient characteristics
From 2006 to 2015, a total of 1,143 HCC patients were identified, of which 69 (6%) had HCC with spinal metastases accounting for 5.8% of all spinal metastasis patients treated in our hospital. Most of the patients were non-elderly men with moderate to poor KPS.
HCC and spinal metastases were simultaneously diagnosed in 24 (34.8%) patients. The remaining 45 (65.2%) patients developed spinal metastases 30–1,074 days after HCC diagnosis, with a median duration of 196 days. Thirty-seven patients were hepatitis B virus (53.6%) and 16 (23.2%) were hepatitis C positive, while the remaining 16 (23.2%) had a history of alcoholic cirrhosis. Two or more spinal metastases were observed in 30 (43.5%) patients. The area of the affected spine included the combined region of the affected spine (31.8%), thoracic (36.3%), lumbar (24.6%), and cervical (7.3%). The most common skeletal-related events (SRE) was neural compression (33.3%), pain (27.5%), and pathologic fracture (8.7%). A total of 30.5% of spinal metastases were detected incidentally during the workup of primary tumor and tumor staging. For primary HCC treatment, five (7.2%) patients underwent primary tumor resection and 15 (21.7%) underwent palliative intervention, such as percutaneous ethanol injection, transcatheter chemoembolization and/or radiofrequency ablation, while 49 (71.1%) received best supportive care. For treatment of spinal metastasis, two (2.9%) patients received palliative spinal surgery with postoperative external beam radiation (EBRT), 35 (50.7%) received EBRT alone, and 32 (46.4%) received palliative treatment. The clinical characteristics are summarized in Table 1.
Table 1. Clinical characteristics of the patient cohort
|
Clinical Characteristics
|
Total
n (%)
|
Missing
n (%)
|
Hazard ratio*
(95% CI)
|
3-month survival (%)
|
6-month survival (%)
|
12-month survival (%)
|
P-value**
|
|
Gender
|
|
|
|
|
|
|
|
|
Male
|
60 (87.0)
|
0 (0)
|
Reference
|
45.0
|
33.3
|
16.7
|
0.520
|
|
Female
|
9 (13.0)
|
|
0.79 (0.39, 1.61)
|
66.7
|
44.4
|
22.2
|
|
|
Age group (years)
|
|
|
|
|
|
|
|
|
≤60 years
|
50 (72.5)
|
0 (0)
|
Reference
|
52.0
|
38.0
|
22.0
|
0.036
|
|
>60 years
|
19 (27.5)
|
|
1.78 (1.03, 3.08)
|
36.8
|
26.3
|
5.3
|
|
|
Karnofskys performance status
|
|
|
|
|
|
|
|
|
Good
|
17 (24.7)
|
0 (0)
|
Reference
|
82.4
|
70.6
|
41.2
|
0.003
|
|
Moderate
|
25 (36.2)
|
|
2.29 (1.15, 4.54)
|
48.0
|
28.0
|
12.0
|
|
|
Poor
|
27 (39.1)
|
|
3.16 (1.63, 6.15)
|
25.9
|
18.5
|
7.4
|
|
|
Cirrhosis
|
|
|
|
|
|
|
|
|
No
|
21 (30.4)
|
7 (10.2)
|
Reference
|
66.7
|
47.6
|
23.8
|
0.024
|
|
Yes
|
41 (59.4)
|
|
1.95 (1.08, 3.51)
|
39.0
|
29.3
|
17.1
|
|
|
Ascites
|
|
|
|
|
|
|
|
|
No
|
33 (47.8)
|
10 (14.5)
|
Reference
|
66.7
|
51.5
|
27.3
|
0.001
|
|
Yes
|
26 (37.7)
|
|
2.44 (1.39, 4.28)
|
26.9
|
15.4
|
7.7
|
|
|
Total bilirubin (mg/dL)
|
|
|
|
|
|
|
|
|
<2.0
|
55 (79.7)
|
1 (1.5)
|
Reference
|
56.4
|
43.6
|
21.8
|
<0.001
|
|
2.0–3.0
|
5 (7.2)
|
|
2.75 (1.06, 7.15)
|
20.0
|
0
|
0
|
|
|
>3.0
|
8 (11.6)
|
|
11.25 (4.39, 28.86)
|
0
|
0
|
0
|
|
|
Serum albumin (mg/dL)
|
|
|
|
|
|
|
|
|
>3.5
|
25 (36.2)
|
1 (1.5)
|
Reference
|
68.0
|
56.0
|
24.0
|
0.056
|
|
2.8–3.5
|
26 (37.7)
|
|
1.38 (0.78, 2.45)
|
30.8
|
23.1
|
19.2
|
|
|
<2.8
|
17 (24.6)
|
|
2.17 (1.14, 4.14)
|
41.2
|
23.5
|
5.9
|
|
|
Number of primary tumor
|
|
|
|
|
|
|
|
|
Single tumor
|
14 (20.3)
|
2 (2.9)
|
Reference
|
71.4
|
50.0
|
35.7
|
0.018
|
|
Multiple tumors
|
53 (76.8)
|
|
2.20 (1.13, 4.29)
|
43.4
|
32.1
|
13.2
|
|
|
Portal vein involvement
|
|
|
|
|
|
|
|
|
No
|
28 (40.6)
|
11 (15.9)
|
Reference
|
71.4
|
50.0
|
25.0
|
0.196
|
|
Yes
|
30 (43.5)
|
|
1.43 (0.83, 2.45)
|
33.3
|
26.7
|
16.7
|
|
|
Visceral organ metastasis
|
|
|
|
|
|
|
|
|
No
|
35 (50.7)
|
2 (2.9)
|
Reference
|
65.7
|
51.4
|
25.7
|
0.017
|
|
Yes
|
32 (46.4)
|
|
1.35 (1.05, 1.73)
|
31.3
|
18.8
|
9.4
|
|
|
Number of vertebral columns involved
|
|
|
|
|
|
|
|
|
1
|
30 (43.5)
|
3 (4.4)
|
Reference
|
53.3
|
40.0
|
20.0
|
0.751
|
|
2
|
19 (27.5)
|
|
0.95 (0.52, 1.73)
|
57.9
|
36.8
|
15.8
|
|
|
≥3
|
17 (24.6)
|
|
1.21 (0.66, 2.22)
|
35.3
|
29.4
|
17.7
|
|
|
Number of extra spinal bone metastases
|
|
|
|
|
|
|
|
|
0
|
32 (46.4)
|
7 (10.2)
|
Reference
|
59.4
|
43.8
|
25.0
|
0.256
|
|
1–2
|
21 (30.4)
|
|
1.52 (0.86, 2.69)
|
42.9
|
33.3
|
14.3
|
|
|
≥3
|
9 (13.0)
|
|
1.64 (0.74, 3.63)
|
33.3
|
22.2
|
11.1
|
|
Abbreviations: CI, confidence interval.
*Hazard ratio from univariable Cox’s proportional hazard regression
**P-value from log-rank test
Survival rate of patients with HCC with spinal metastases
The median survival time of the cohort was 79 days (95% CI, 62–118 days) with the longest duration of follow-up for a single patient at 930 days. At the end of the study, only two (2.90%) patients had censored observations. The overall survival rates for HCC with spinal metastases at 3, 6, 9, 12, and 24 months were 47.8%, 34.8%, 24.6%, 17.4%, and 1.8%, respectively.
Candidate predictors
From the univariable log-rank analysis, seven clinical characteristics were identified as potential predictors of survival for HCC patients with spinal metastasis: aged >60 years (P=0.036), moderate and poor Karnofskys Performance Status (P=0.003), the presence of cirrhosis (P=0.024), the presence of ascites (P=0.001), total bilirubin level ≥2 mg/dL (P<0.001), HCC with multifocal tumors (P=0.018), and the presence of visceral organ metastasis (P=0.017). The survival probabilities at 3, 6, and 12 months for each predictor were estimated and depicted by Kaplan–Meier curves (Figure 1).
Final predictors
All candidate predictors listed in Table 1 were included in the full multivariable prediction model via flexible parametric survival regression, regardless of their statistical significance from univariable analyses. No statistical evidence of violation of proportional hazards assumption was found in the Schoenfeld residuals test (P=0.944). To reduce the number of predictors, backward elimination was performed based on a critical P-value < 0.1 and on the likelihood ratio test of each model after elimination of non-significant predictors. The modeling procedures were performed with both the multiple imputed method and complete-case analysis, and the results of each model were compared. In this study, both models yielded the same final covariates within the model; therefore, a model based on complete-case analysis was reported.
Four final predictors remained within the reduced model: aged > 60 years (Hazard Ratio [HR] 1.77, 95% Confidence Interval [CI] 0.97–3.23, P=0.062), moderate and poor KPS (HR 2.00, 95% CI 0.96–4.18, P=0.066 and HR 2.96, 95% CI 1.48–5.92, P=0.002, respectively), total bilirubin level ≥ 2 and ≥ 3 mg/dL (HR 2.22, 95% CI 0.82–5.99, P=0.114 and HR 10.4, 95% CI 3.92–27.82, P<0.001, respectively), and multiple foci of HCC (HR 2.63, 95% CI 1.29–5.35, P=0.008) (Table 2). The estimated beta-coefficients for all predictor variables on the hazard scale and their 95% CIs from both the full and reduced models are shown, see Supplementary Table 1, Additional file 1. Predictors with a positive beta-coefficient increased the probability of mortality, whereas predictors with a negative beta-coefficient decreased the probability of mortality. The reported beta-coefficients could be converted to hazard ratios by exponentiation of the beta-coefficients.
Table 2. Estimated hazard ratios in the full and reduced multivariable flexible parametric regression models
|
Predictors
|
Full model
|
Reduced model
|
|
HR
|
95% CI
|
P-value
|
HR
|
95% CI
|
P-value
|
|
Age group (years)
|
|
|
|
|
|
|
|
≤60
|
1.00
|
Reference
|
|
1.00
|
Reference
|
|
|
>60
|
2.13
|
0.99, 4.54
|
0.052
|
1.77
|
0.97, 3.23
|
0.062
|
|
Karnofskys performance status
|
|
|
|
|
|
|
|
Good
|
1.00
|
Reference
|
|
1.00
|
Reference
|
|
|
Moderate
|
1.86
|
0.71, 4.88
|
0.204
|
2.00
|
0.96, 4.18
|
0.066
|
|
Poor
|
3.64
|
1.61, 8.21
|
0.002
|
2.96
|
1.48, 5.92
|
0.002
|
|
Cirrhosis
|
|
|
|
|
|
|
|
No
|
1.00
|
Reference
|
|
|
Not included
|
|
|
Yes
|
1.20
|
0.60, 2.39
|
0.600
|
|
|
|
|
Ascites
|
|
|
|
|
|
|
|
No
|
1.00
|
Reference
|
|
|
Not included
|
|
|
Yes
|
1.05
|
0.32, 3.42
|
0.935
|
|
|
|
|
Total bilirubin (mg/dL)
|
|
|
|
|
|
|
|
<2.0
|
1.00
|
Reference
|
|
1.00
|
Reference
|
|
|
2.0–3.0
|
3.27
|
0.20, 12.59
|
0.085
|
2.22
|
0.82, 5.99
|
0.114
|
|
>3.0
|
9.22
|
2.46, 34.50
|
0.001
|
10.44
|
3.92, 27.82
|
<0.001
|
|
Serum albumin (mg/dL)
|
|
|
|
|
|
|
|
>3.5
|
1.00
|
Reference
|
|
|
Not included
|
|
|
2.8–3.5
|
0.80
|
0.34, 1.91
|
0.619
|
|
|
|
|
<2.8
|
2.66
|
1.05, 6.71
|
0.039
|
|
|
|
|
Number of primary tumor
|
|
|
|
|
|
|
|
Single tumor
|
1.00
|
Reference
|
|
1.00
|
Reference
|
|
|
Multiple tumor
|
3.42
|
1.23, 9.51
|
0.019
|
2.63
|
1.29, 5.35
|
0.008
|
|
Portal vein involvement
|
|
|
|
|
|
|
|
No
|
1.00
|
Reference
|
|
|
Not included
|
|
|
Yes
|
1.46
|
0.75, 2.85
|
0.265
|
|
|
|
|
Visceral organ metastasis
|
|
|
|
|
|
|
|
No
|
1.00
|
Reference
|
|
|
Not included
|
|
|
Yes
|
1.19
|
0.85, 1.67
|
0.301
|
|
|
|
|
Number of vertebral columns involved
|
|
|
|
|
|
|
|
1
|
1.00
|
Reference
|
|
|
Not included
|
|
|
2
|
1.10
|
0.52, 2.32
|
0.807
|
|
|
|
|
≥3
|
1.70
|
0.69, 4.16
|
0.248
|
|
|
|
|
Number of extraspinal bone metastases
|
|
|
|
|
|
|
|
0
|
1.00
|
Reference
|
|
|
Not included
|
|
|
1–2
|
0.93
|
0.31, 2.78
|
0.892
|
|
|
|
|
≥3
|
1.03
|
0.33, 3.19
|
0.964
|
|
|
|
Abbreviations: HR, hazard ratio; CI, confidence interval.
Model calibration and discrimination
For measure of discrimination, the Harrell C-statistics for the full and reduced models was 0.77 and 0.72, respectively. The Somers’ D was 0.55 for the full model and 0.44 for the reduced model. The Royston & Sauerbrei’s D statistic and of the reduced model were 1.571 (SE 0.274) and 0.37 (95% CI 0.20–0.51), respectively. The calibration of the final model was visualized with a calibration plot, where predicted risk and observed outcomes were compared against one another within each of the different risk quantiles (Figure 2). The prognostic model appeared to be well calibrated in the third, fourth, and fifth risk quantiles. The model overestimated the probability of death in the first risk quantile and underestimated the probability of death in the second risk quantile.
Internal validation
Internal validation of the derived prognostic model was performed via a bootstrap resampling procedure with 200 replicates. The apparent C-statistics and the test C-statistics were 0.73 (95% CI 0.68–0.79, min 0.61, max 0.81) and 0.71 (95% CI 0.70–0.71, min 0.64, max 0.73), respectively. The C-statistic optimism was 0.023 (95% CI, 0.017–0.028). The Royston & Sauerbrei’s D statistic optimism was 0.31 (apparent D 1.79 and test D 1.48), and the optimism was 0.09 (apparent 0.43 and test 0.34). The shrinkage factor was 0.82 (95% CI 0.80–0.84). The regression coefficients in subsequent validation studies should be multiplied by this factor to yield a more reliable estimate of the predicted probabilities.
Demonstration of individual predictions from the HCC-SM CMU model
From the final remaining predictors of the newly derived HCC with spinal metastasis model by Chiang Mai University or HCC-SM CMU model, all HCC patients with spinal metastasis were individually categorized into 36 possible subcategories. The survival probabilities of each patient were estimated at three specific time points (3, 6, and 12 months) based on the HCC-SM CMU model. Each of the 36 subtypes of HCC patients was assigned a specific survival probability with a 95% CI (Supplementary Table 2, 3, and 4, Additional File 1). For demonstration purposes, we selected nine possible types of patients with different combinations of predictor variables and presented, along with patient profile, the model estimated survival probabilities of each patient at 3, 6, and 12 months (Table 3). The individual prediction curves of each patient are presented in Figure 3. For clinical applicability, the HCC-SM CMU score chart, where four predictors were cross-tabulated and each cell was labeled with survival probability and colored according to pre-specified risk groups was introduced (Figure 4).
Table 3. Demonstration of the model-estimated survival probability at each time point from nine sample patients.
|
Input predictor variables
|
Model estimation of survival probability
(%, 95% confidence interval)
|
|
No
|
Age
|
KPS
|
Total bilirubin
|
Number of primary tumor
|
3 months
|
6 months
|
12 months
|
|
1
|
41
|
Good
|
0.8
|
Single
|
89.5 (74.9–95.9)
|
83.4 (62.1–93.3)
|
69.4 (43.1–85.4)
|
|
2
|
64
|
Good
|
1.2
|
Single
|
82.2 (56.2–93.6)
|
72.5 (38.9–89.6)
|
52.4 (17.8–78.5)
|
|
3
|
52
|
Good
|
1.8
|
Multiple
|
74.8 (57.6–85.8)
|
62.0 (41.2–77.3)
|
38.3 (19.4–57.1)
|
|
4
|
66
|
Moderate
|
1.6
|
Single
|
67.6 (41.0–84.2)
|
52.5 (23.3–75.2)
|
27.5 (6.5–54.4)
|
|
5
|
56
|
Moderate
|
2.3
|
Single
|
61.2 (21.0–85.7)
|
44.6 (7.1–78.2)
|
19.8 (0.6–60.0)
|
|
6
|
46
|
Good
|
3.2
|
Single
|
31.5 (1.2–73.8)
|
15.0 (0.1–62.2)
|
2.2 (0–35.9)
|
|
7
|
48
|
Good
|
3.4
|
Multiple
|
4.8 (0–35.7)
|
0.7 (0–19.9)
|
0 (0–3.6)
|
|
8
|
69
|
Poor
|
3.8
|
Single
|
0.2 (0–17.7)
|
0 (0–6.6)
|
0 (0–0.4)
|
|
9
|
76
|
Poor
|
6.9
|
Multiple
|
0 (0–0.4)
|
0 (0)
|
0 (0)
|
Abbreviation: KPS, Karnofsky performance status
Comparative validation of the HCC-SM CMU model
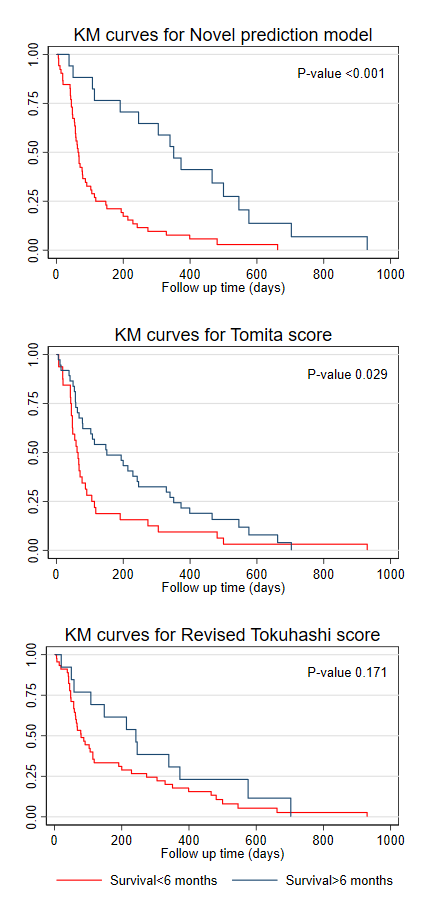
We performed a comparative validation of the HCC-SM model with classical scoring systems such as the Tomita score and the revised Tokuhashi score. This analysis could be done in 58 (84.1%) patients within the cohort, due to incomplete data on the component of the revised Tokuhashi score in 11 patients. By deciding to perform surgical management only in patients whose predicted survival probability at six months was more than 80% (only the green risk group), the HCC-SM CMU model would provide clinicians with 100% specificity or absence of false positive cases (predicted to be alive at six months, but actually died before the time). However, this approach would result in higher false negative rates where patients who survived beyond six months were predicted to be dead before six months and thus missed the opportunity to undergo surgery. In contrast, if patients whose predicted risk fell within either the green or yellow group at six months were chosen for surgical treatment, the HCC-SM CMU model would provide higher sensitivity at 56.5% and 88.6% specificity. In this case, a smaller number of patients would be misclassified, and more patients would be appropriately managed. We estimated the sensitivity, specificity, positive predictive value, negative predictive value, and AuROC of the Tomita score and the revised Tokuhashi score assumed that they had been used to categorize patients for operation in this cohort of patients (Table 4). The Kaplan–Meier curves showing the difference in survival distribution of each score in differentiation of patients who would survive more or less than six months are depicted, see Supplementary Figure 1, Additional file 1.
Table 4. Comparative validation of the HCC-SM CMU survival prediction model with conventional scoring systems
|
|
Status at 6 months
|
Sensitivity % (95% CI)
|
Specificity % (95% CI)
|
PPV %
(95% CI)
|
NPV % (95% CI)
|
AuROC (95% CI)
|
|
Survived
|
Died
|
Total
|
|
HCC-SM CMU prediction model (only green group at 6 months)
|
|
Alive
|
2
|
0
|
2
|
8.7
(1.1–28.0)
|
100.0
(90.0–100.0)
|
100.0
(15.8–100.0)
|
62.5
(48.5–75.1)
|
0.54
(0.48–0.60)
|
|
Not alive
|
21
|
35
|
56
|
|
|
23
|
35
|
58
|
|
|
|
|
|
|
HCC-SM CMU prediction model (green and yellow group at 6 months)
|
|
Alive
|
13
|
4
|
17
|
56.5
(34.5–76.8)
|
88.6
(73.3–96.8)
|
76.5
(50.1–93.2)
|
75.6
(59.7–87.6)
|
0.73
(0.61–0.84)
|
|
Not alive
|
10
|
31
|
41
|
|
|
23
|
35
|
58
|
|
|
|
|
|
|
Tomita score§
|
|
Alive
|
17
|
15
|
32
|
73.9
(51.6–89.8)
|
57.1
(39.4–73.7)
|
53.1
(34.7–70.9)
|
76.9
(56.4–91.0)
|
0.66
(0.53–0.78)
|
|
Not alive
|
6
|
20
|
26
|
|
|
23
|
35
|
58
|
|
|
|
|
|
|
Revised Tokuhashi score†
|
|
Alive
|
8
|
5
|
13
|
34.8
(16.4–57.3)
|
85.7
(69.7–95.2)
|
61.5
(31.6–86.1)
|
66.7
(51.0–80.0)
|
0.60
(0.49–0.72)
|
|
Not alive
|
15
|
30
|
45
|
|
|
23
|
35
|
58
|
|
|
|
|
|
§The Tomita score predicts the patients to be alive at 6 months if the score is 2–7 points. Patients with a Tomita score of > 8 points are predicted not to be alive at 6 months. † The Revised Tokuhashi score predicts for the patient to be alive at 6 months if the score is 9–15 points. Patients with a Tomita score of < 9 points are predicted not to be alive at 6 months.
Abbreviations: AuROC, area under receiver operating characteristics curve; CI, confidence interval; PPV, positive predictive value; NPV, negative predictive value