Materials and Chemicals
Vilazodone (VIL), and Vilazodone D8 were arranged from BioOrganics Pvt. Ltd. Bangalore. Acetonitrile (super gradient grade), Methanol, Methyl-t-butyl ether and Dichloromethane were obtained from RCI labscan, Thailand. Formic acid, Sodium hydrogen carbonate were used of Merck, Germany. Milli -Q-Water was used for the preparation of buffer solutions. Human frozen plasma (K2-EDTA) was received from blood bank “Jensys laboratoris”, Hyderabad, India. Analytical column, Betabasic C8 was procured from Thermo Scientific, USA.
Instrument’s, equipment’s and software’s
Quantitative analysis was performed by using triple quadrupole mass spectrometer of TSQ Quantum Ultra (Thermo scientific, USA) and Shimadzu UPLC, Japan (Prominence model) equipped with binary pump, autosampler, degasser and column oven. For working standards and buffers weighing purpose, sartorius microbalance and analytical balance were used respectively. For sample extraction purpose, refrigerated centrifuge of Thermo scientific, USA, and Multi tube vortexer used of MR scientific, India was used. Plasma samples were stored in deep freezers (Thermo electron corporation, USA) at -20+/-5°c and − 70+/- 10°c. Validation data were generated by TSQ Quantum LC Quan software version 2.5.6.
Preparation of solutions
Different solutions were prepared according to defined procedure as and when required such as Diluent [Water: Methanol (60:40%v/v)], Extraction solution [Methyl-t-Butyl Ether: Dichloromethane (70:30%v/v)], Buffering agent [50mM Sodium hydrogen carbonate], Buffer for Mobile Phase [0.1%v/v Formic acid in water], Reconstitution solution [Acetonitrile: 0.1%v/v Formic acid in water (60:40%v/v)], and Rinsing solution [Methanol: Water (90:10%v/v)].
Preparation of main stock solutions and working dilutions
About 1mg of vilazodone working standard was weighed accurately and transferred in 5ml of volumetric flasks, added 2ml of methanol and sonicated to dissolve then finally diluted up to the mark with the same to obtain individual main stock concentration of about 0.200mg/mL. Further intermediate stock solution and working dilutions were prepared from main stocks by using diluent solution for spiking in plasma to obtain CC standards and QC samples. CC and QC dilutions was prepared in low light and room temperature condition. Calibration range was established from 0.300 to 300ng/mL for vilazodone.
Preparation of main stock solutions of Internal Standards and Mixed ISTD working solution
About 1mg of vilazodone D8 was weighed accurately and dissolved in 10mL of methanol to obtain main stock concentration of about 0.1mg/mL. Afterwards ISTD working solution was prepared from main stock solutions using diluent to achieve final concentration of about 1000ng/mL of Vilazodone D8.
Preparation of spiked plasma calibration curve standards and quality control samples
Calibration curve standards consisted of a set of nine non-zero concentration levels (STD-1 to STD-9) were prepared by spiking the working solutions of analyte in human K2EDTA plasma to achieve concentration of 0.300ng/mL, 0.600ng/mL, 15.000ng/mL, 30.000ng/mL, 60.000ng/mL, 120.000ng/mL, 180.000ng/mL, 240.000ng/mL and 300.000ng/mL. In order to bracket the linearity range and for reliable quantitation, Quality Control samples were prepared at four different concentration levels as lower limit of quantification (LLOQ-0.300ng/mL), low quality control (LQC-0.750ng/mL), middle quality control (MQC-150.000ng/mL) and high-quality control (HQC-270.000ng/mL). 2%v/v of respective CC/QC dilutions was spiked in screened K2EDTA pooled plasma to achieve the desired nominal concentration of CC/QC samples. CC/QC dilutions and spiked samples were protected from light during preparation and usage. Bulk spiked CC/QC samples was stored in an ultra-low temperature deep freezer (-70°C ± 10°C) until analysis.
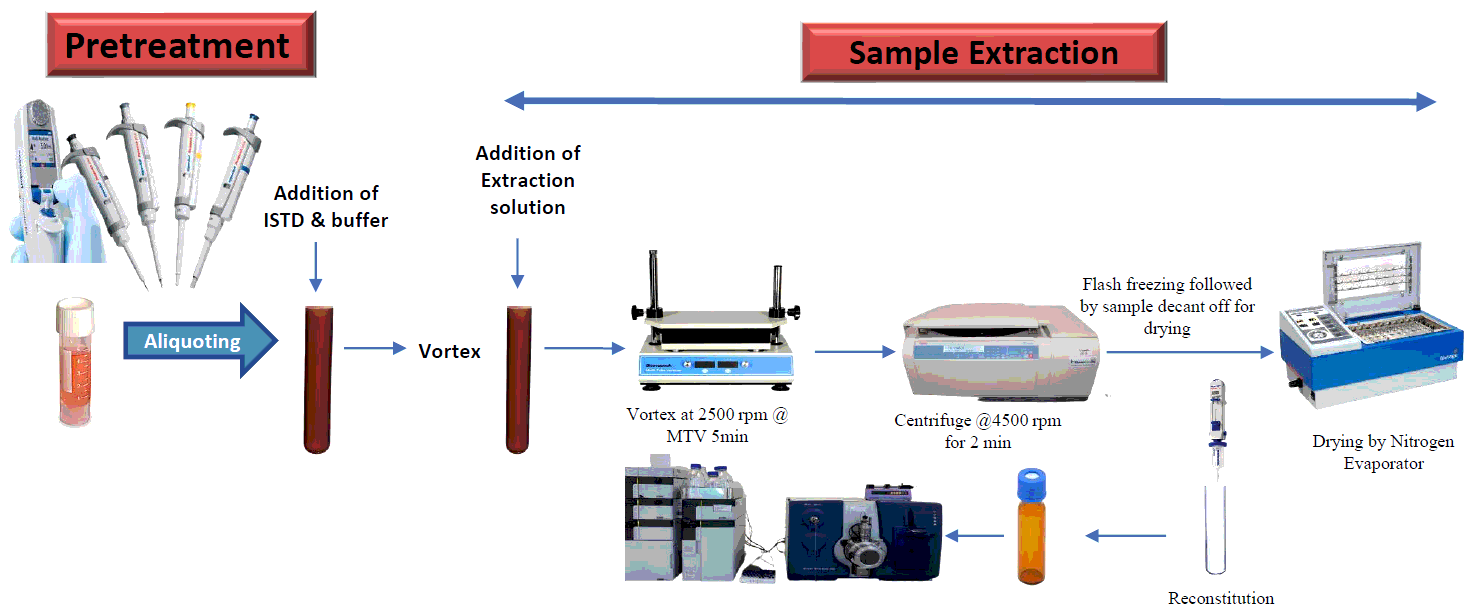
Sample extraction procedure
Sample processing was carried out as per standard test procedure following liquid liquid extraction technique. Required frozen plasma samples were retrieved from the deep freezer and allowed to thaw at room temperature followed by adequately vortexing. Added 0.300mL of plasma sample into a prelabelled polypropylene tube and 0.015mL internal standard working solution followed by vortex to mix uniformly. 0.400mL of buffering solution was added to each tube and vortex to mix. For extraction purpose, 3mL of extraction solution was added followed by capping of tubes and vortexing for 5min using multi tube vortexer at 2500rpm. Samples were allowed to centrifuge for 5min at 4500rpm at 4°C. Supernatant organic phase was transferred into another prelabelled tube using flash freezing bath and samples were kept for drying with stream of nitrogen evaporation at 40°C. Then dried samples were reconstituted with 0.400mL of reconstitution solution and transferred to autosampler vials. Lastly, for analysis purpose, 10µL of sample was injected into UHPLC-MS/MS system.
Mass spectrometry and chromatographic conditions
Analytical separation was performed with Shimadzu prominence UPLC (Shimadzu, Japan) comprising of solvent delivery module SIL-20AT, an autoinjector SIL 20AC, a column oven CTO-20AC. Chromatography separation of analytes and internal standard was accomplished within 2.500 min using a Betabasic C8, (100*4.6mm, 5µ; Thermo Scientific, USA) column and a mobile phase consisting of Acetonitrile: 0.1% v/v formic acid in water (60:40, v/v) by binary pump at a total flow rate of 0.700 mL/min. The column and autoinjector temperature were set at 40°C and 5°C respectively. Mass spectrometer used for this work was triple quadrupole TSQ Quantum Ultra (Thermo Scientific, USA) which consisted of a heated electro spray ionization (HESI) source in positive ion mode. Multiple reaction monitoring (MRM) transitions used with dwell time set at 200 milli sec. per transition. Inert gas Nitrogen was used as the zero air for nebulizer, curtain, auxiliary, and collision gases. UPLC-MS/MS parameters are shown in table:1. Calibration standard curves were plotted by calculating the analyte to internal standard peak area ratio (y) versus analyte nominal concentrations (x). Data acquisition, processing and quantification were performed using Xcalibur version 2.2 and LC Quan version 2.7.0 software (Thermo Scientific, USA).
Table 1
| Table 1A Source dependent parameters | | | | | | | | |
| Ion Source | : HESI (Positive polarity) | | | | | | | | |
| Spray voltage | : 4500 v | | | | | | | | |
| Vaporizer temperature | : 350°C | | | | | | | | |
| Sheath gas pressure | : 40 (arb) | | | | | | | | |
| Auxiliary gas pressure | : 20 (arb) | | | | | | | | |
| Ion Sweep gas pressure | : 0 (arb) | | | | | | | | |
| Capillary Temperature | : 350°C | | | | | | | | |
| Capillary Offset | : 35 | | | | | | | | |
| Collision gas Pressure | : 1.5mTorr | | | | | | | | |
| Chrom filter | : 10 | | | | | | | | |
| Table 1B Compound dependent parameters |
| Name | Parent/Product mass, m/z (Q1/Q3) | Collision energy (CE) | TUBE LENSE | Skimmer Offset | Time | Width | Q1PW | Q3PW | Retention time (min.) |
| VIL | 442.022/155.000 | 41 | 114 | 8 | 0.200 | 0.500 | 0.70 | 0.70 | 1.47 |
| 442.022/197.000 | 28 | 114 | 8 | 0.200 | 0.500 | 0.70 | 0.70 |
| VIL D8 | 450.093/157.000 | 43 | 118 | 8 | 0.200 | 0.500 | 0.70 | 0.70 | 1.48 |
| 450.093/205.000 | 29 | 118 | 8 | 0.200 | 0.500 | 0.70 | 0.70 |
Method Validation
Method validation was completed according to USFDA guidelines [25] and in compliance with principles of Good Laboratory Practice [26].
Carryover Check
To confirm that there has been no considerable carryover of analyte from a prior injection, a carryover check experiment was conducted. At ULOQ level, this experiment was conducted. By injecting the ULOQ, blank solution, blank sample, and comparing with LLOQ samples, carryover check of the sample was performed. After each ULOQ injection, the percentage of carryover in the blank solution and blank sample was determined. Blank solution and blank sample for VIL and VIL D8 showed no carryover.
Selectivity
Twelve normal lots of K2EDTA plasma, including two lipemic and two homolytic plasma with the same anticoagulant, were used to evaluate the method's selectivity (K2EDTA). Each plasma lot was processed for blank samples and LLOQ samples in order to assess interference at the RT of the analyte and the ISTD. Fresh linearity and four sets of QC samples at LQC, MQC, and HQC levels were used for the selectivity test. The following batch-specific acceptance criteria were considered when evaluating this test: If any interfering peaks are present in the blank sample at the retention time of the analyte, their response should be less than 20% of the area of the corresponding lot LLOQ response. Any peak in the Blank sample that is present at the ISTD retention time must have the response that is less than 5% of the ISTD response average of acceptable CC/QC samples. The LLOQ samples back computed concentration should fall within 20% of the nominal value.
Matrix Effect
It is carried out to evaluate the degree to which the biological matrix or any of its constituent parts affects the measurement of the analyte. To make sure that the Precision, Accuracy, and Sensitivity are not hindered by varying lots of matrix usage, matrix effect was measured in eight different lots of K2EDTA plasma, including at least one lipemic and homolytic lot plasma. At LQC and HQC, the matrix effect was assessed in triplicate. Blank samples from each lot were processed for the evaluation of the matrix effect, and after drying, the samples were reconstituted with a reconstitution solution containing the mixed analyte and ISTD to produce aqueous equivalent LQC and HQC samples.
Matrix factor (MF) for the analyte and ISTD was calculated as follows-
MF of Analyte: Mean peak analyte area in presence of Matrix samples/ Mean peak analyte area in neat aqueous sample.
MF of ISTD: Mean peak area of ISTD in presence of Matrix samples/ Mean peak area of ISTD in neat aqueous sample.
ISTD normalised M.F.- MF of Analyte/ M.F. of ISTD
MF of 1 signifies no matrix effect.
A value of less than 1 suggests ionization suppression.
A value of greater than 1 suggests ionization enhancement.
Acceptance criteria:
% CV of Matrix factor of different lots at each level for analyte and ISTD should be ≤ 15%.
% CV of ISTD normalised MF across different lots should be ≤ 15%.
Sensitivity
The sensitivity of the method that may be measured within an acceptable range of accuracy and precision is represented by the calibration curve's lowest non-zero standard (LLOQ). In this study, precision and accuracy batches were used to process six replicates of LLOQ samples. For the experiment to be considered acceptable, the LLOQ samples' accuracy must be 20% or less and their signal-to-noise ratio must be five.
Calibration Curve
It shows the relationship between the analytical concentrations and the experimental response values. Four precision and accuracy batches were used to assess the method's linearity. The concentration of analyte was calculated using a weighted 1/X2 linear regression. “To meet the acceptability of calibration curve, it is desirable that coefficient of determination (r2) should be ≥ 0.9800. The percent nominal of LLOQ samples must be ± 20% of the nominal value. The percent nominal for other than LLOQ must be ± 15% of their nominal value and at least 75% of calibration curve standards including LLOQ and ULOQ must meet the above criteria” [25].
Precision And Accuracy
The reproducibility of a bioanalytical process is considered in terms of precision. It delivers an estimate that if the same sample is analysed more than once, the outcomes will be relatively close enough. Precision is assessed at different concentration levels during method validation utilising quality control samples such LLOQQC, LQC, MQC, and HQC. This accuracy is verified for inter-assay and intra-assay estimation [25]. The accuracy of the method is a measurement of how closely the concentration obtained during analysis resembles the actual concentration of the analyte. “Freshly spiked quality control samples i.e., LLOQC, LQC MQC and HQC and Calibration curve standard samples were processed and used for the evaluation of within batches and between batches Precision and Accuracy of the method. Percent coefficient of variation (%CV) should be within ± 15 for LQC, MQC and HQC whereas for LLOQC %CV should be within ± 20. Accuracy should be ± 15% for LQC, MQC and HQC whereas for LLOQC, accuracy should be within ± 20% [25].
Recovery
Recovery was calculated at three distinct levels at LQC, MQC, and HQC by comparing the mean peak area response obtained from extracted QC samples with identical post-spiked QC samples to represent 100% recovery. The recoveries of D8-ISTDs were assessed similarly using the respective medium QC samples as a reference.
% Recovery = Extracted peak area / Unextracted peak area*100.
It is desirable that recovery of the method should be precise and consistent. % CV of the mean recovery across different QC levels should be ≤ 15.
Stability
During quantitative bioanalysis by LC-MS/MS, drug stability is very important pre-analytical consideration. If appropriate preventive measures are not taken, drug instability at different stage of clinical sample handling, including collection, storage, extraction, processing and LC-MS/MS analysis, may lead to suppression or enhancement of estimation. Freshly prepared CC and QC samples at LQC and HQC levels were used for the evaluation of all matrix stability. Analyte and ISTD stock solution stability were evaluated at LLOQ and ULOQ level at room temperature. Stability experiments will be considered to be acceptable if experiment values are within ± 15 for accuracy and precision.