Differentially expressed Immune-related genes in breast cancer
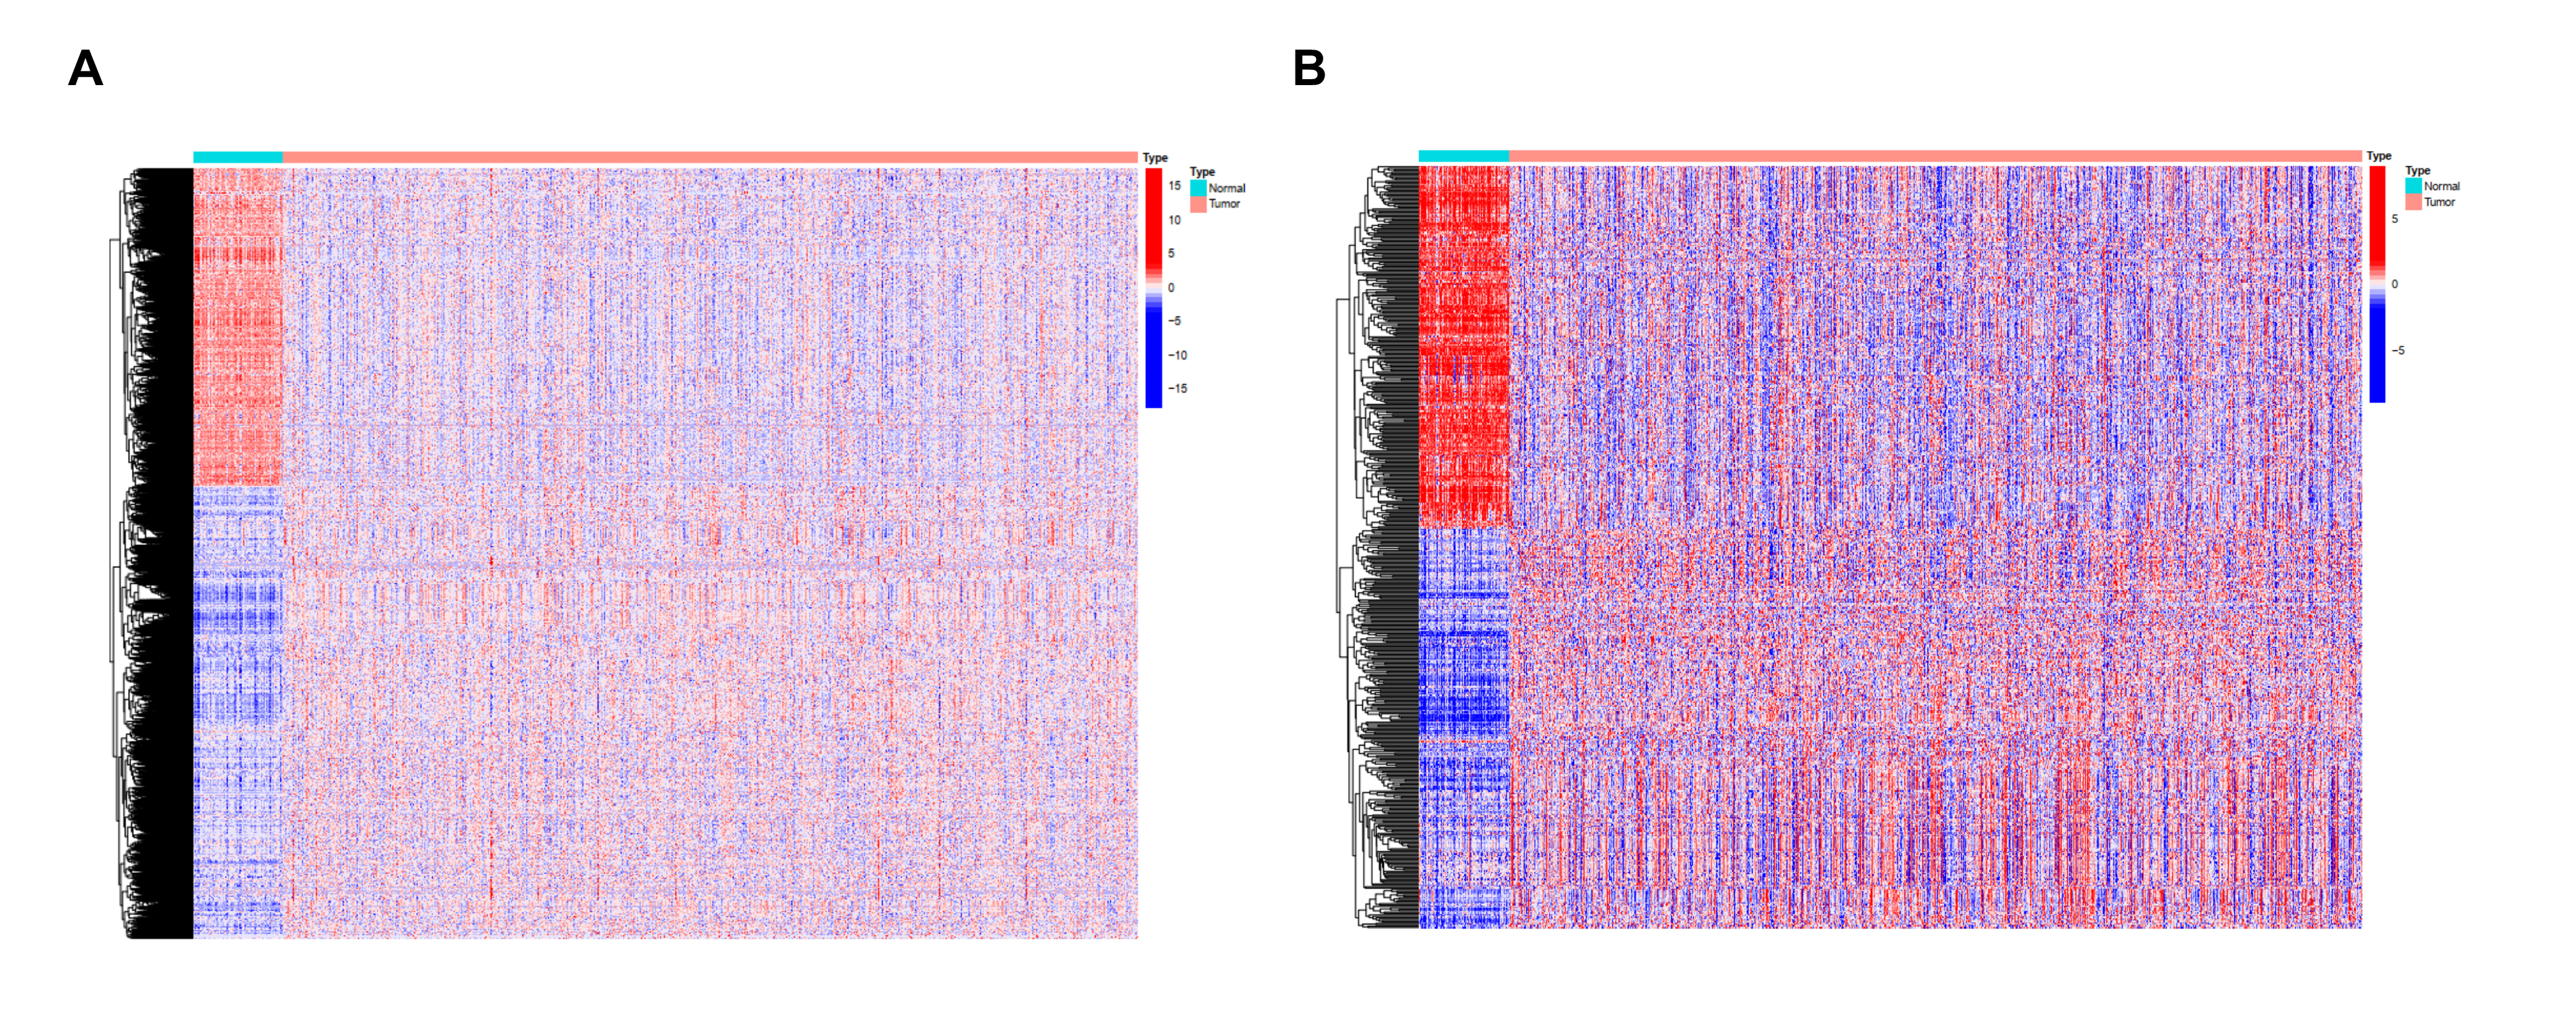
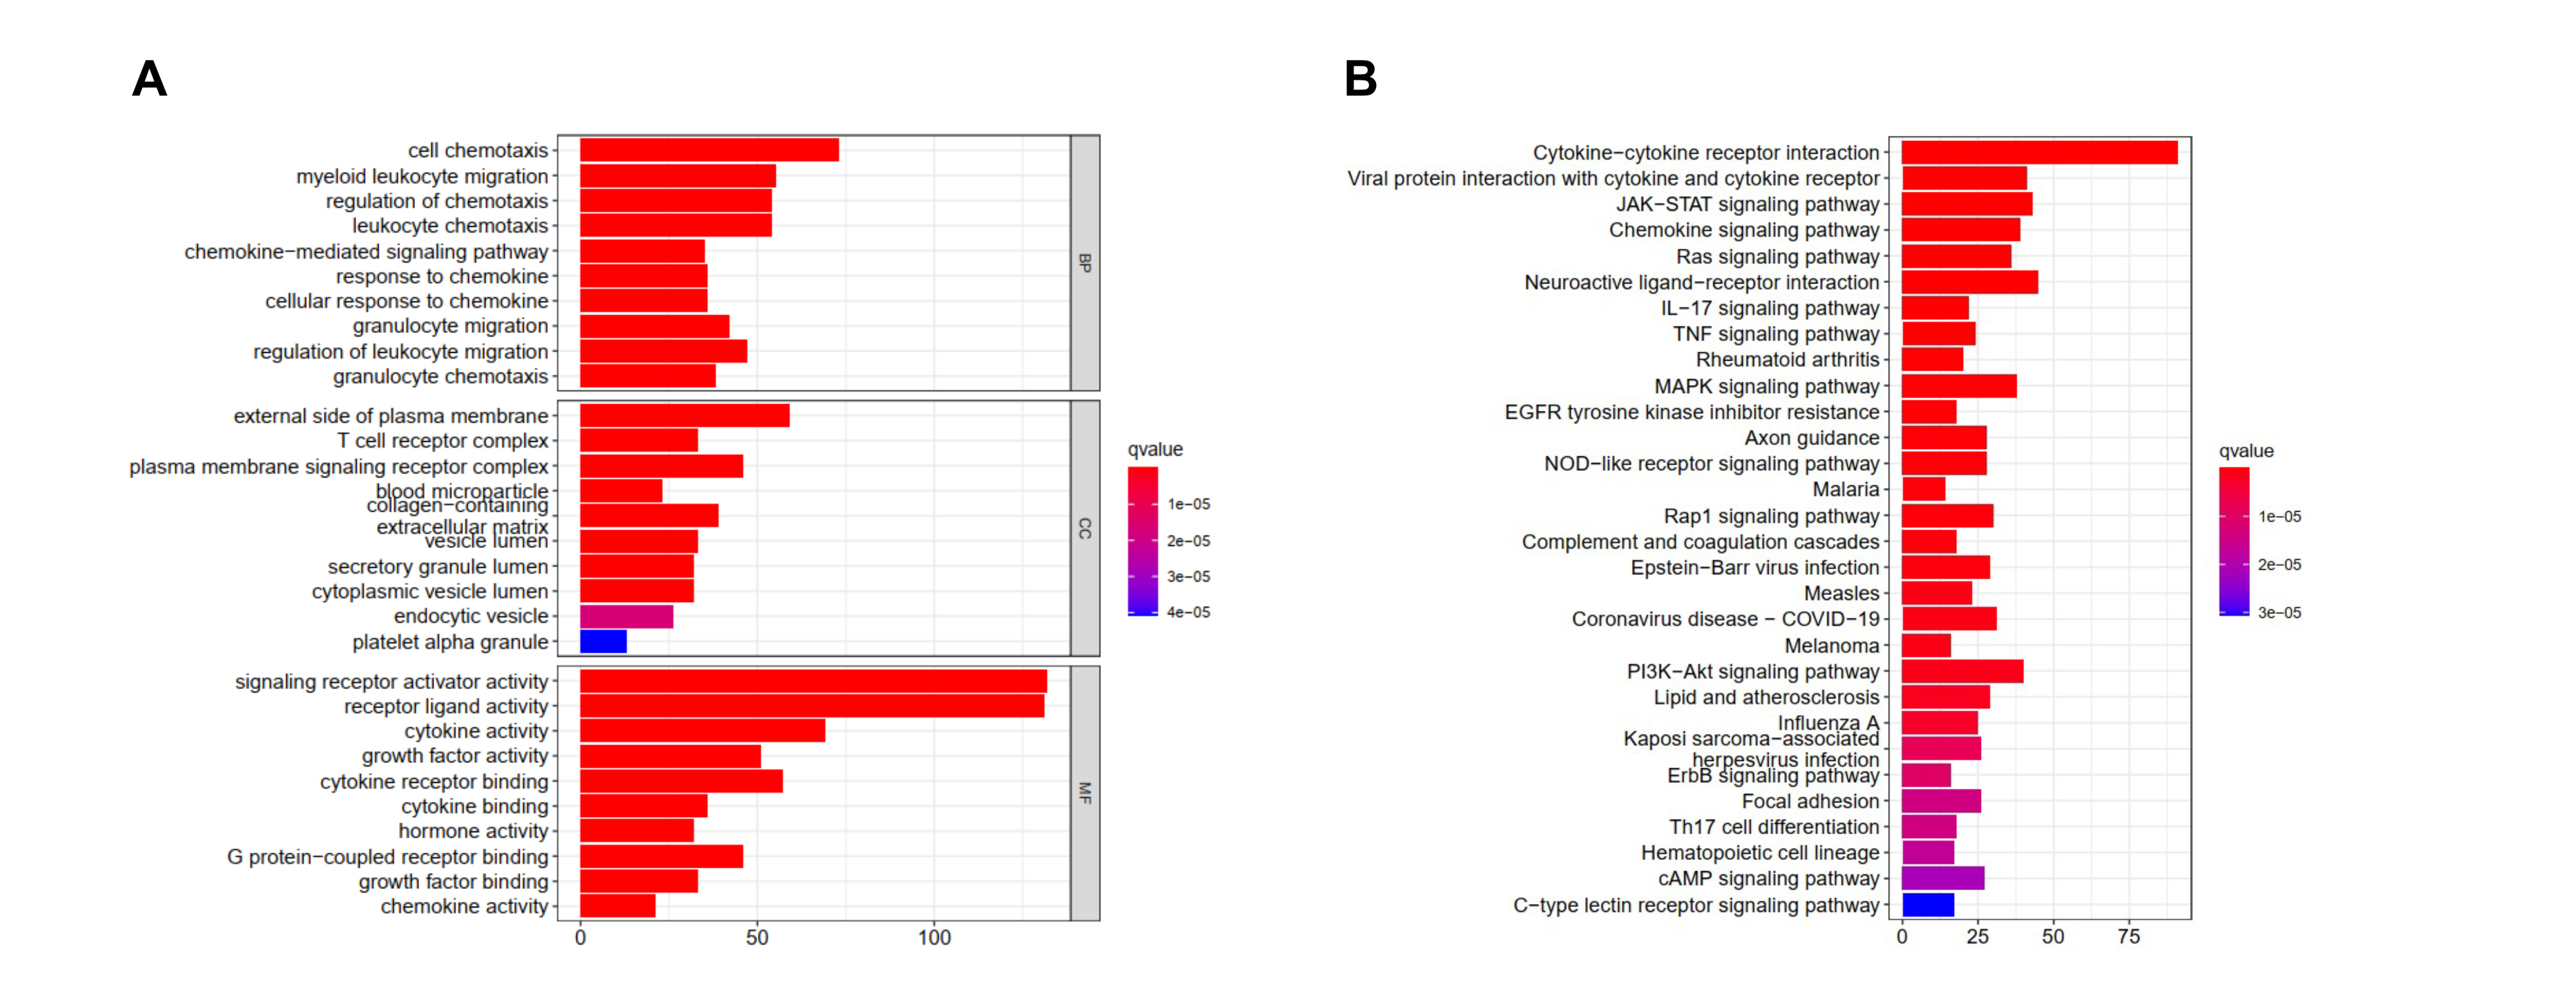
A total of 5443 differentially expressed genes were obtained by differential expression analysis of 1053 tumor samples and 111 normal samples in TCGA database. Among them, 2265 genes were up-regulated and 3178 genes were down-regulated in the tumor samples (Fig S1A.). These differentially expressed genes were further intersected with the list of immune-related genes obtained from the ImmPort and InnateDB databases, and 542 immune-related differentially expressed genes were obtained. Among them, 283 and 259 immune-related genes from the tumor samples were up-regulated and down-regulated, respectively (Fig S1B). Functional enrichment analysis showed that these 542 immune-related differentially expressed genes were significantly associated with 2335 Gene Ontology analyses and 108 KEGG pathways. The top 10 most significantly associated biological processes, molecular function, cellular component, and signaling pathways were demonstrated. The biological process was mainly enriched in cell tropism, myeloid migration, regulation of chemotaxis, and granulocyte migration; however, the signaling pathways were mainly enriched in cytokine-cytokine receptor interaction, JAK-STAT signaling, chemokine signaling, Ras signaling, neuroactive ligand-receptor interaction, IL-17 signaling, and tumor necrosis factor signaling (Fig S2A, S2B).
Immune-related Hub Genes In Breast Cancer
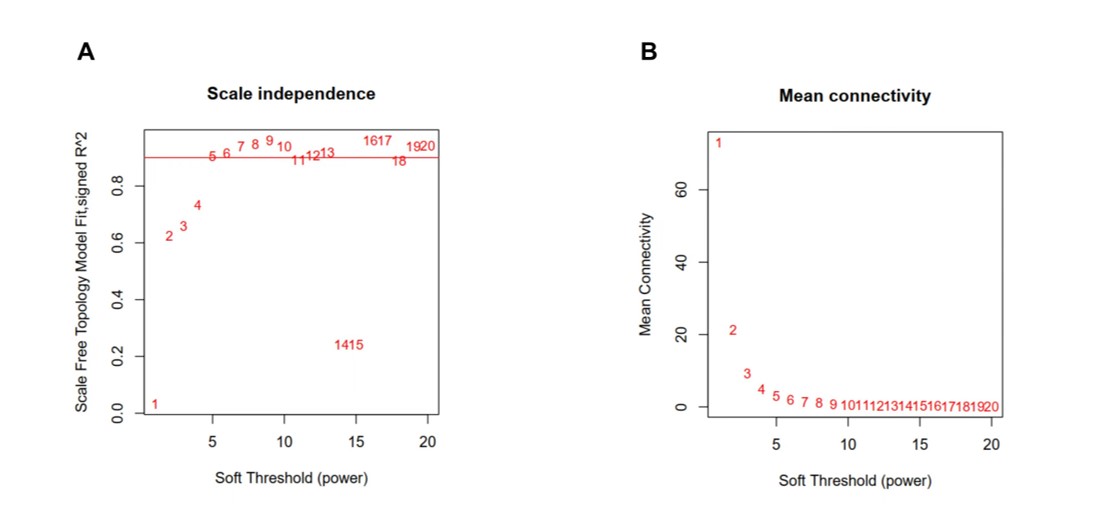
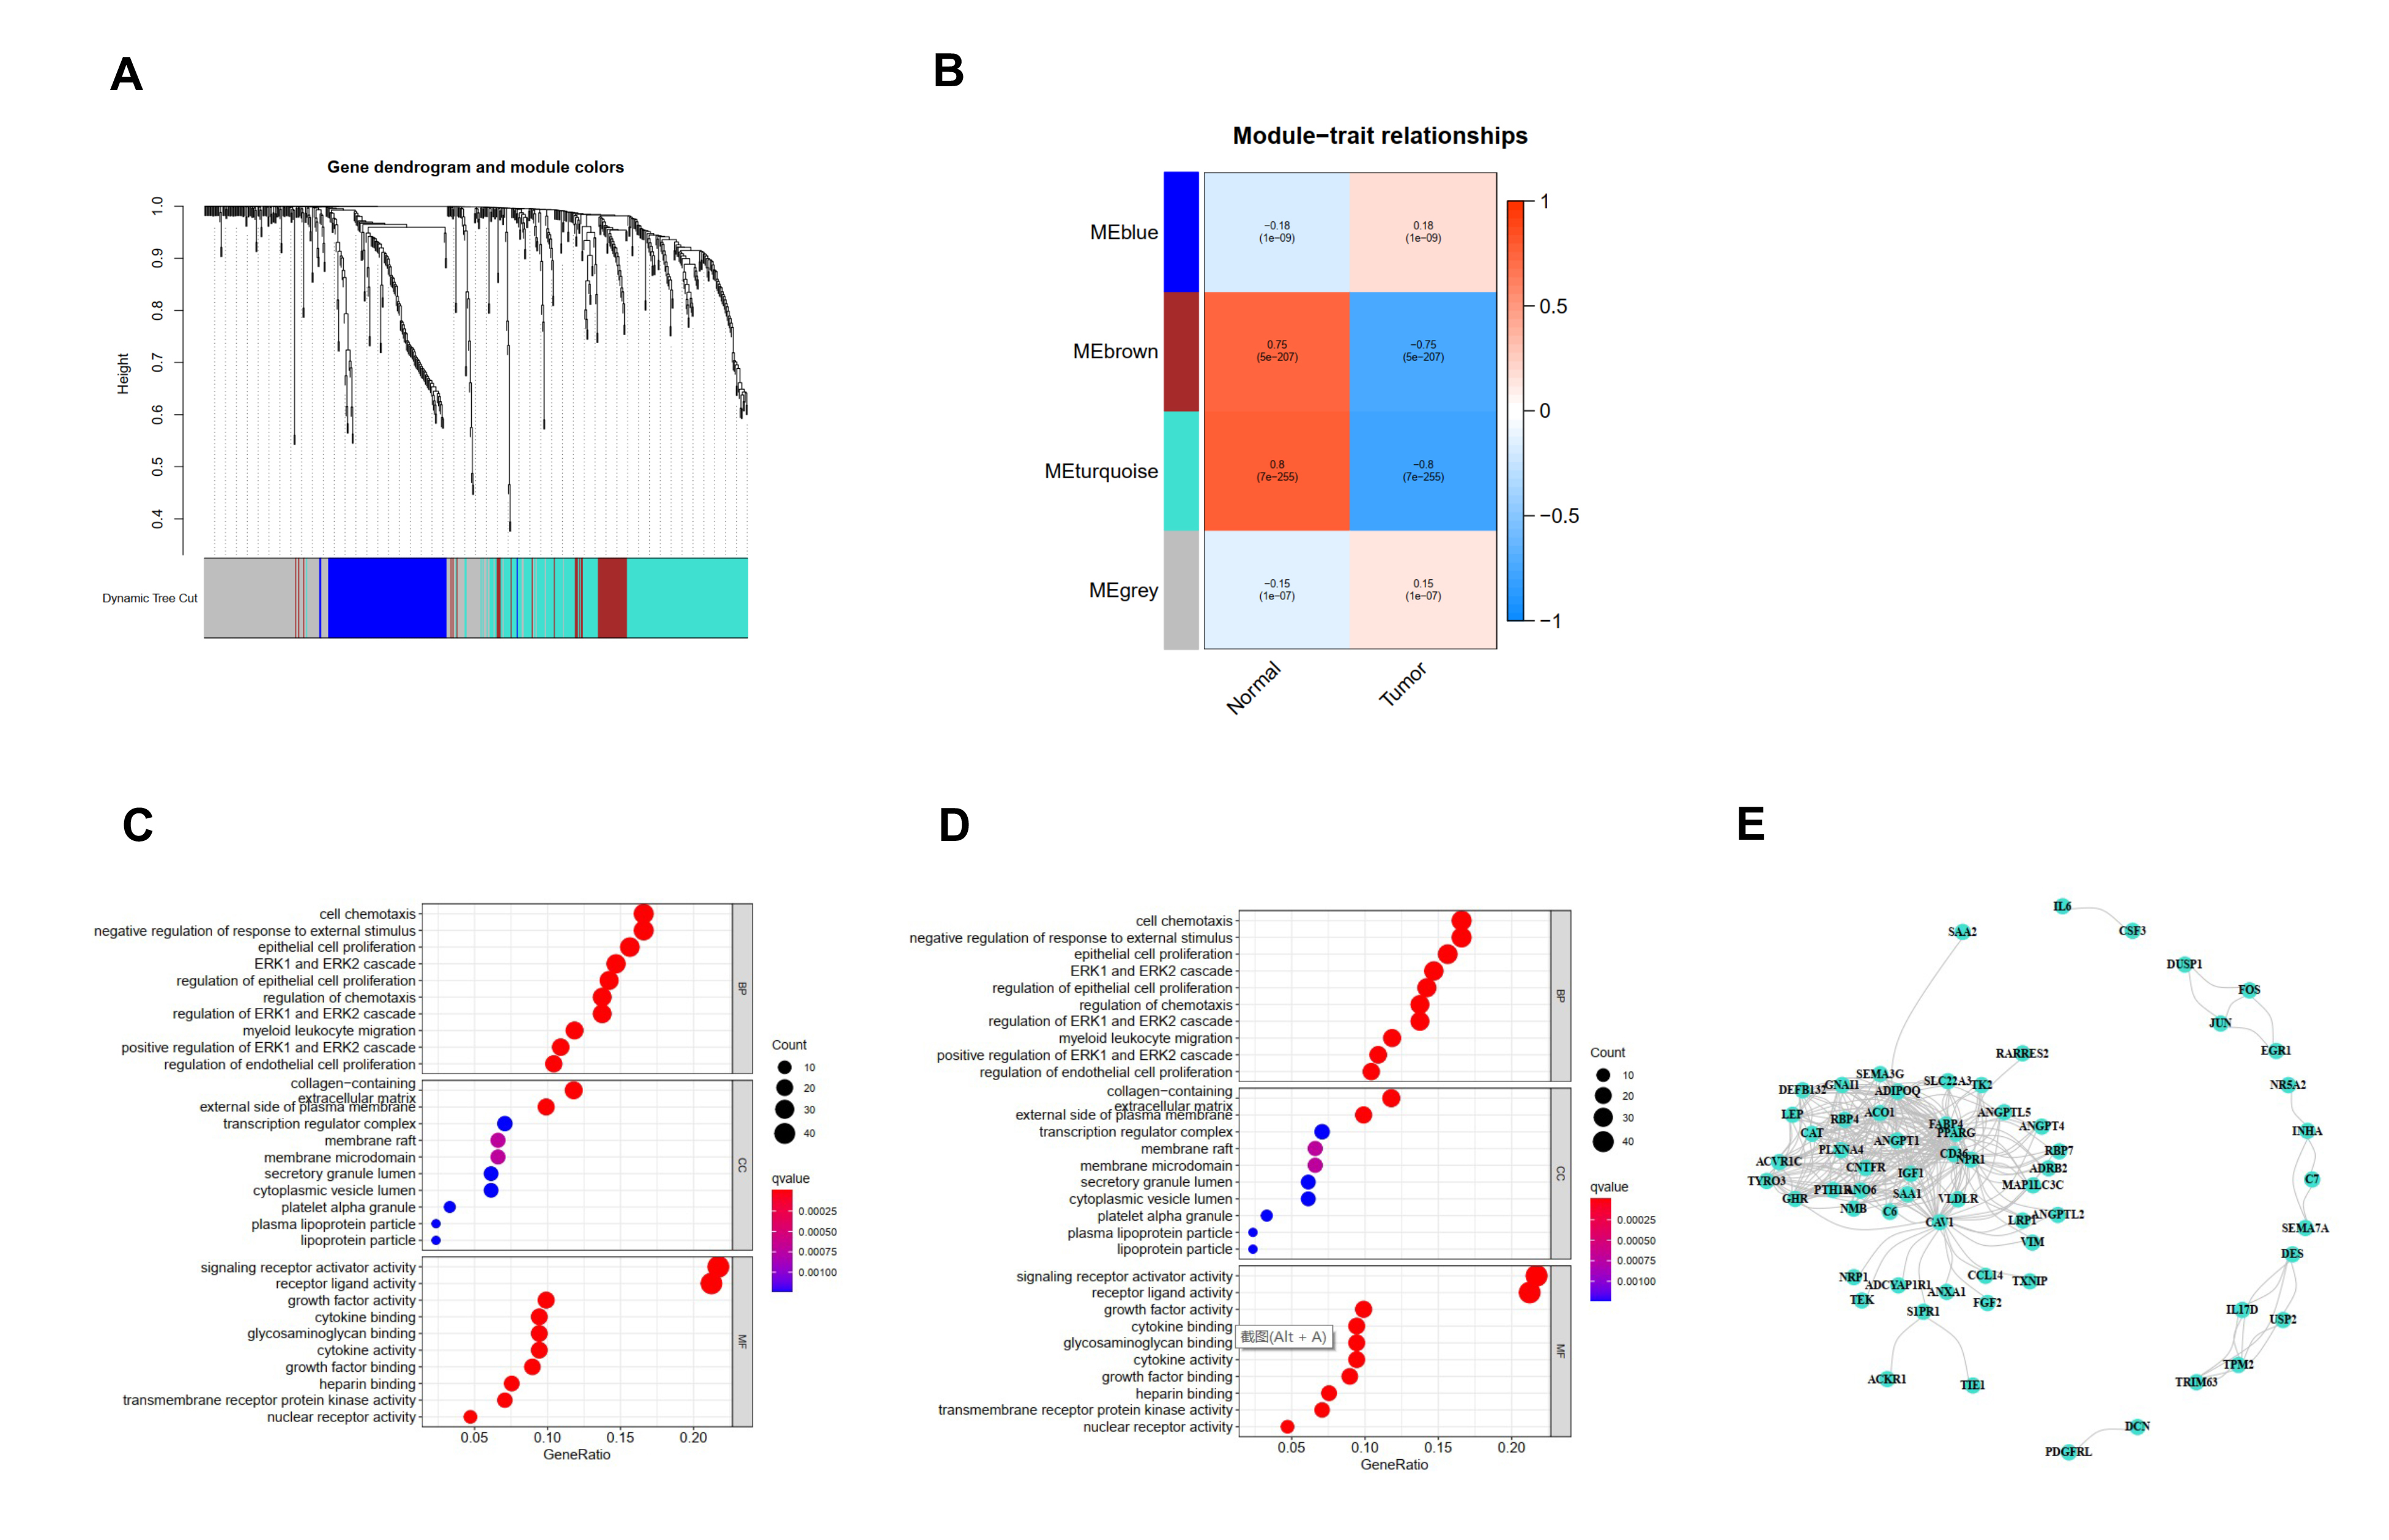
We acquired 542 immune-related differentially expressed genes and constructed the co-expression network using the WGCNA package in R software (the threshold value was 0.9, the optimal soft-thresholding power was 5) (Fig S3). Four modules were identified based on hierarchical clustering and the optimal threshold value (Fig S4A, S4B); the 542 genes were assigned to the 4 modules. According to the Pearson correlation coefficients obtained between each module and the sample features, it was found the brown and turquoise modules were strongly associated with breast cancer; the genes with the highest significance in the turquoise module were selected for subsequent analysis (this module had 213 genes and 292 edges). The top 10 significantly enriched Gene Ontology terms and KEGG pathways in the module genes were identified. Biological processes were mainly enriched for signaling receptor activator activity, receptor ligand activity, cellular chemotaxis, regulation of chemotaxis, negative regulation of response to external stimuli, ERK1 and ERK2 cascade and regulation, epithelial cell proliferation, migration of myeloid leukocytes, and regulation of epithelial cell proliferation (Fig S4C). Signaling pathways were mainly enriched in cytokine-cytokine receptor interaction, PI3K-Akt signaling, neuroactive ligand‒receptor interaction, MAPK signaling, and JAK-STAT signaling (Rap1 signaling pathway, chemokine signaling pathway, axon guidance, Ras signaling pathway, and calcium signaling pathway) (Fig S4D). There were 65 genes and 292 edges of the turquoise module in the network with a threshold weight > 0.2 (Fig S4E).
Univariate Cox Regression Analysis And Identification Of Prognostic Factors
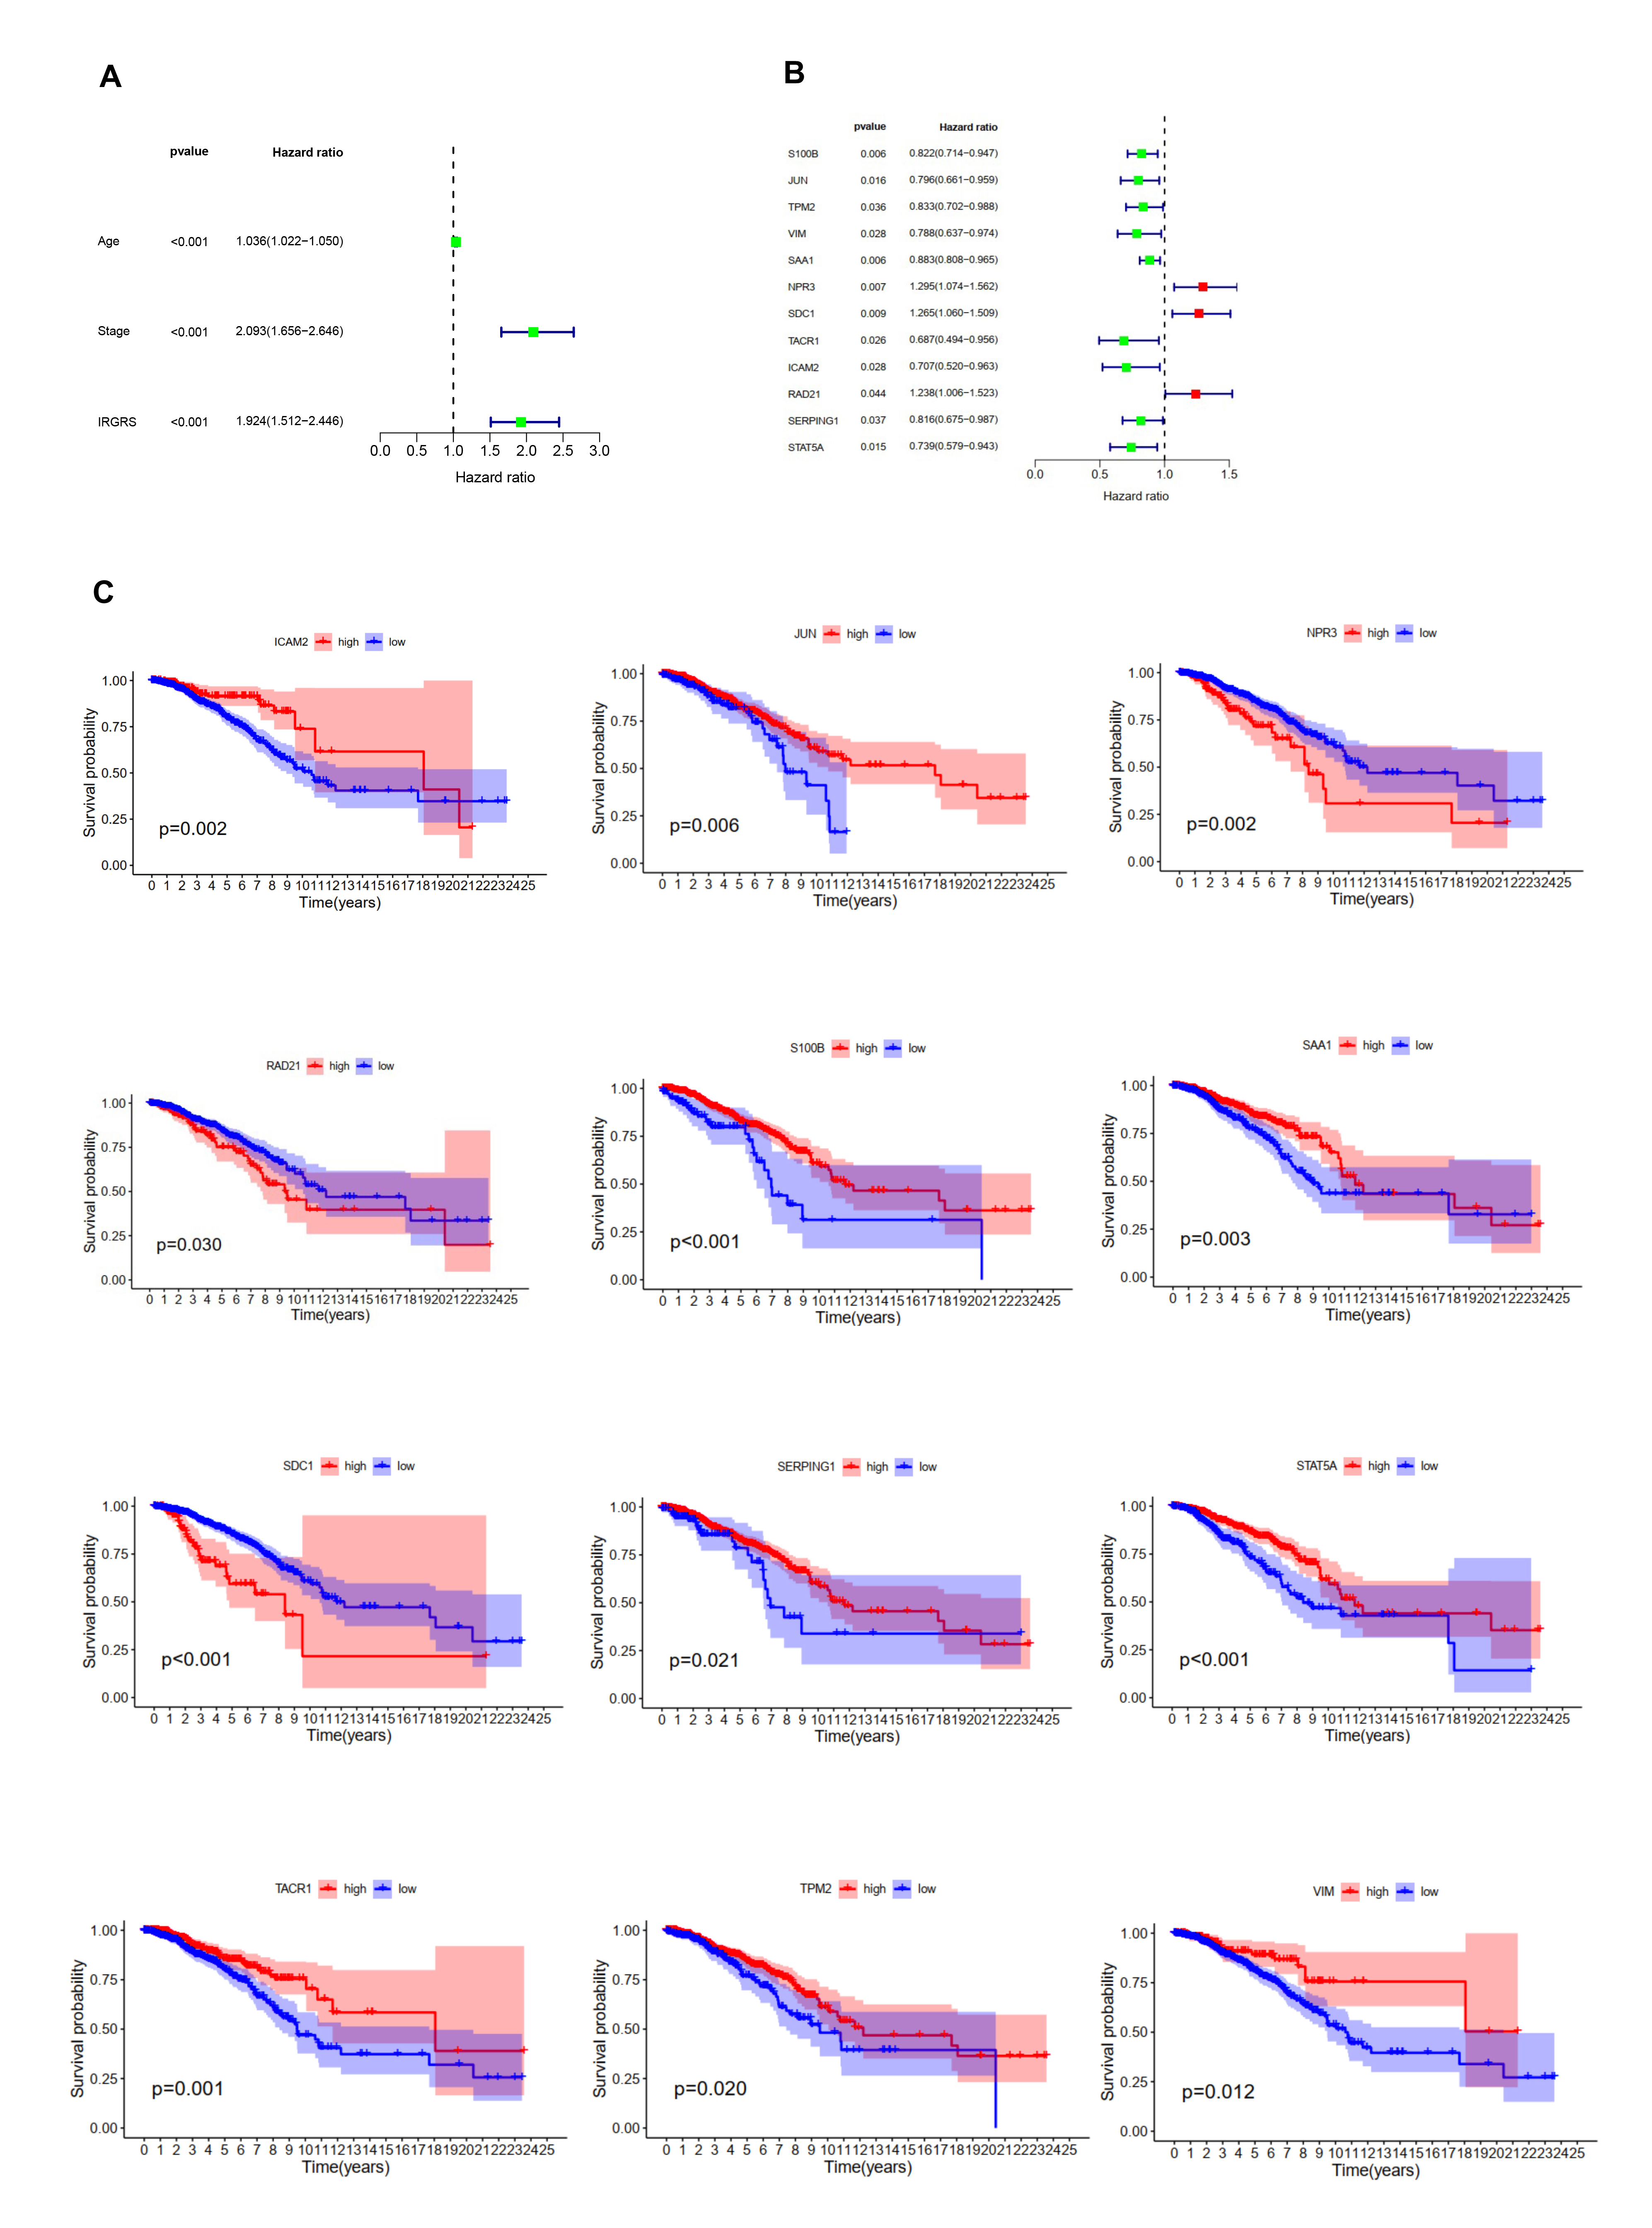
To identify prognostic features among these 213 genes in the turquoise module, univariate cox regression models and Kaplan-Meier curves were constructed accordingly. Univariate cox regression analysis showed that age, risk score, and stage were significantly associated with breast cancer prognosis (Fig S5A). As seen from the K-M curves, the 12 immune-related hub genes (S100B, JUN, TPM2, VIM, SAA1, NRP3, SDC1, TACRA, ICAM2, RAD21, SERPING1, and STAT5A) correlated strongly with the prognosis of breast cancer patients (P ≤ 0.05), (Fig S5B, S5C).
Multivariate Cox Regression Analysis And Establishment Of Prognostic Risk Model
Multifactorial cox regression analysis were performed to identify independent prognostic genes and to confirm that the risk score remained an independent prognostic factor after adjustment for other clinicopathological factors (Fig. 1A, 1B); only three genes (S100B, NPR3, and SDC1) were found to significantly affect OS in breast cancer patients (Fig. 1C, 1D, 1E). The following formula was used to calculate the IRGRS prognostic model formula: risk score = expression level of S100B*(-0.16) + expression level of NPR3*(0.24) + expression level of SDC1*(0.24). Taking the median risk score as the cut-off value, patients with low-risk scores had a better prognosis (Fig. 2A). The prognostic ability of the risk score was verified using four GEO breast cancer datasets (GSE17705, GSE58812, GSE22219, and GSE21653). The results of the four GEO datasets were consistent and in agreement with those of the TCGA dataset (Fig. 2B, 2C, 2D, 2E). Finally, the Human Protein Atlas (https://www.proteinatlas.org/) database also showed increased protein expression of these two genes(SDC1, S100B)in breast cancer tissues (Fig. 2F).
Heatmap were plotted to evaluate the predictive significance of the clinical prognosis factor, combining the results of multivariate cox regression analysis. As shown in Fig. 3, there was no significant difference in age and stage between the high-risk-score and low-risk-score groups. As shown in Fig. 4, the area under the curve (AUC) values of 1-year, 2-year, and 3-year of the risk score prognostic model were 0.661, 0.675 and 0.665, respectively.
Relationship Between Different Irgrs Subgroups And Other Immune Subtypes
Thorsson et al. performed a large-scale immunogenomic analysis of over 10,000 tumor samples from TCGA, including 33 different cancer types. In a cross-tumor category study, researchers identified six immune subtypes: wound healing (C1), interferon (IFN)-γ dominant (C2), inflammatory (C3), lymphocyte depleted (C4), immunologically quiet (C5), and TGF-ß dominant (C6) (Thorsson et al. 2018). We used the R package Immune Subtype Classifier to classify the samples according to the gene expression matrix for each immunotype. As shown in Fig. 5, the low-IRGRS group consisted of 28% C1, 39% C2, 25% C3, 3% C4 and 4% C6, while the high-IRGRS group consisted of 40% C1, 35% C2, 10% C3, 12% C4 and 3% C6. C2 and C6 subtypes were almost evenly distributed between the two groups. C3 subtype was more frequent in the low- IRGRS group and C1 and C4 subtypes were more frequent in the high-IRGRS group (P < 0.001, χ2 test).
Immunotherapy And Chemotherapy Of Different Irgrs Subgroups
To identify the prognostic value of the proportions of immune and stromal cells in different IRGRS subgroups, we used the ESTIMATE algorithm to estimate the proportions of immune and stromal components in the TME for each sample. The results showed that the Immune Score and Estimate Score of patients in the high-IRGRS group were lower than those in the low-IRGRS group, suggesting that patients in the low-IRGRS group were more likely to benefit from immunotherapy(Fig. 6A). There were no significant differences between the high-IRGRS and low-IRGRS groups in terms of the Stromal Score. We evaluated the associations of the Immune Score and Estimate Score with overall survival. The median of Immune Score and Estimate Score was used as the cut-off values to divide breast cancer patients into high and low cut-off groups. As shown in Fig. 6, a high Immune Score was associated with prolonged survival, while the Estimate Score did not contribute to the overall survival rate (Fig. 6B, 6C).
In addition, we also examined the IC50 values of four chemotherapeutics (Bleomycin, Gemcitabine, Lapatinib, and Paclitaxel) between the high- and low-risk score groups. The results showed that patients in the low-IRGRS group had lower IC50 values than those in the high- IRGRS group, suggesting that patients in the low-IRGRS group were more likely to benefit from these four drugs (Fig. 6D).