Subjects
A total number of 73 patients (33 males and 40 females), aging from 32 to 68 (43.63 ± 0.91) years old with pathological diagnosis of GBM were enrolled in our project. All the enrolled GBM patients should have KPS score higher than 70. This study was approved by the local Ethics Committee and was conformed to the principles outlined in Declaration of Helsinki. Written informed consent was provided by all patients.
Instruments
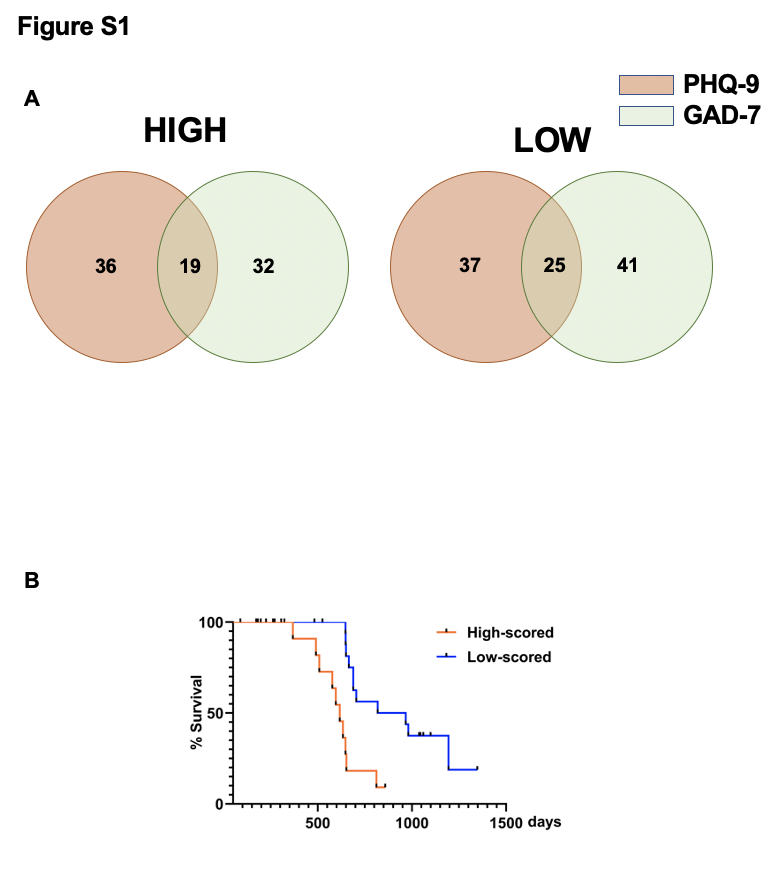
In order to meet the different education background of all ages, Patient Health Questionnaire 9 items (PHQ-9) and Generalized Anxiety Disorder 7-item (GAD-7) scale were chosen as our measurement for major depressive disorder and anxiety disorder, both of which are widely used as a reliable measurement to evaluate one’s depressive or anxiety condition. All the patients were asked to complete the two questionnaires after they were diagnosed with glioma (even though not yet with a certain diagnosis of glioblastoma before verified with pathology methods). Scored with higher and lower than median were divided into high and low PHQ-9 and GAD-7 group. The detail items of PHQ-9 and GAD-7 were presented as Table S1 and Table S2.
Database
RNA expression for Glioblastoma Multiforme using TCGA-GBM-HTseq (07-19-2019) was obtained from the GDC TCGA data portal (https://docs.gdc.cancer.gov), Clinical data such as gender, age, histological type, survival and outcome were also downloaded from TCGA data portal. Depressive and anxiety disorder related genes were retrieved from PubMed Gene (https://www.ncbi.nlm.nih.gov/gene/) using key words ‘depression’, ‘depressive disorder’, ‘major depressive disorder’, ‘anxiety’ and ‘anxiety disorder’. For validation, mRNA sequencing data (mRNAseq_693) for GBM patients were obtained from the Chinese Glioma Genome Atlas (CGGA) data portal (http://www.cgga.org.cn/). Clinical data of survival and outcome were also downloaded from the CGGA data portal.
Differentially expressed genes
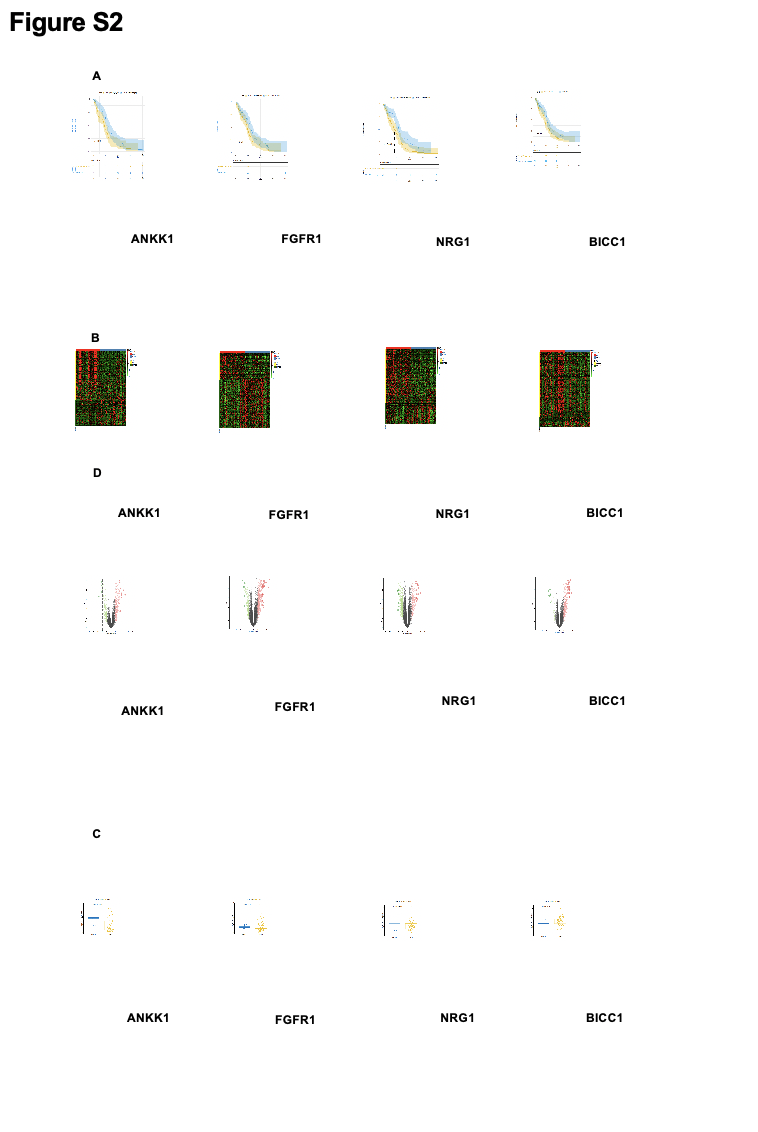
The FPKM data downloaded from GDC data portal (HTseq-FPKM) was used to mining the differentially expressed genes between high and low expression of LTBP1. Differential expression analysis of two conditions was performed using the edgeR R package (3.9.1); Corrected P-value of 0.05 and absolute fold change of 2 were set as the threshold for significantly differential expression. Samples were divided into high and low LTBP1 by median level of expression.
Culture of primary glioblastoma cells
Briefly, jelly-like tumor tissue was obtained during surgery, and removed into a sterilized 50mL centrifuge tube with ice-cold PBS in it. Then the tumor tissue was carefully transported from operating room to laboratory in an icebox. Discard the supernatant, place the tissue sample in a sterile dish, and cut it into 1mm3 pieces with sterilize scissors and tweezers. Then collect the cut sample into a 15ml centrifuge tube, add PBS with 1% penicillin-streptomycin, mix and shake up and down for three times in order to remove the remaining red blood cells as thoroughly as possible. After the upper layer of liquid is clear, carefully remove the supernatant, add about 3ml trypsin for every 2cm3 tissue, incubate at 37 ℃ for 10 min, and shake it every 2 min to make the tissue fully digested. After the digestion, the upper fluid would be turbid, let the tube stand for 2 minutes, then move the supernatant into an Eppendorf (EP) tube. Centrifuge the EP tub for 5min with 1000 rpm, and put it in a culture disk with Dulbecco's Modified Eagle Medium with 10% fetal bovine serum. Incubate under a temperature of 37 °C and 5% CO2. Medium was changed every two days. Primary GBM cells were irregular spindle-like cell under microscope. Primary GBM stem cells were cultured in stem cell culture media DMEM or neurobasal media (Life Technologies Corporation) supplemented with 20 ng/mL FGF-2 (PeproTech), 20ng/mL EGF (PeproTech), B27 and N2 supplemental factors (Gibco) and antibiotics (penicillin and streptomycin). Isolated GSCs grew as sphere after 1 to 2 months of continuous culturing. GSCs were tested for their capability to self-renew using the sphere-formation assay described below.
Sphere formation assay
In summary, GBM spheres were harvested and dissociated with 0.25% trypsin. After centrifugation, the cell suspensions of expanded glioblastoma cells were seeded in a 96-well plate with 3-4 cells in each well. After incubation for 3, 5 and 7 days in GSC proliferation medium, the long diameter and shape of spheres were measured. The number of GSC spheres were counted. The fixed area (10 mm2) at the center of each well was converted into a digital image using a digital still camera (Axio Observer A1), and the number of spheres was counted by Image-Pro Plus 6.0 (Media Cybernetics)
Immunofluorescence
In short, the cells were plated in 12-well culture plates with cover glass pre-coated with 10% polylysine. Cells were cultured for three days then fixed with 4% paraformaldehyde (PFA) in PBS, permeabilized with 0.1% Triton-X100 and blocked with 5% normal goat serum in PBS. Then, they were incubated overnight at 4 °C with: Rabbit anti-Ki-67, 1:200 (Abcam). After washing with PBS, cells were incubated with Alexa Fluor®555 anti-Rabbit IgG, 1:4000 (Abcam) for 1 h at room temperature. Cells were then counter-stained with DAPI (Southern Biotechs). The images were captured using FLUOVIEW FV 10i (OLIMPUS).
Flow cytometry analysis for cell cycle
1 x 10⁶ cells were seeded into 6-well plates. After 36 hours, cells were collected and fixed in chilled 70% ethanol at -20 °C for 2 h, followed by washing with ice-cold phosphate-buffered saline (PBS), and the fixed cells were stained with 50 g/ml propidium iodide (PI) in darkness at room temperature for 30 min before analysis. The samples were then analyzed with BD LSR Fortessa (BD Biosciences).
Cell migration and invasion assay
The migration assay was performed with transwell insert chambers (8 μm pore size, Corning, USA). In short, about 2 x 10⁴ cells were seeded into the upper chamber in serum free medium in triplicate. The lower chamber was filled with 600 μl DMEM medium containing 10% FBS (chemo-attractant). After incubation for 24 h, cells in upper chambers (namely non-migrating cells) were removed by cotton swab, and cells migrating to the lower surface of membrane were fixed using methanol and stained with 0.1% crystal violet. The migrating cells were counted at least 10 visual fields per membrane under the light microscope.
Functional and pathway enrichment analysis
The Database for Annotation, Visualization, and Integrated Discovery (DAVID, https://david.ncifcrf.gov/) was used to perform Gene Ontology (GO) enrichment analysis. DAVID is an online tool for systematic and integrative annotation and enrichment analysis that can be used to reveal biological meaning related to large gene lists. GO analysis for the cellular component, biological process (BP), and molecular function (MF) categories and Kyoto Encyclopedia of Genes and Genomes (KEGG) pathway enrichment analysis were performed for the selected genes using the DAVID. A p value < 0.01 was considered statistically significant. BinGO app from Cytoscape were using to visualize the functional enrichment of differentially expressed genes.
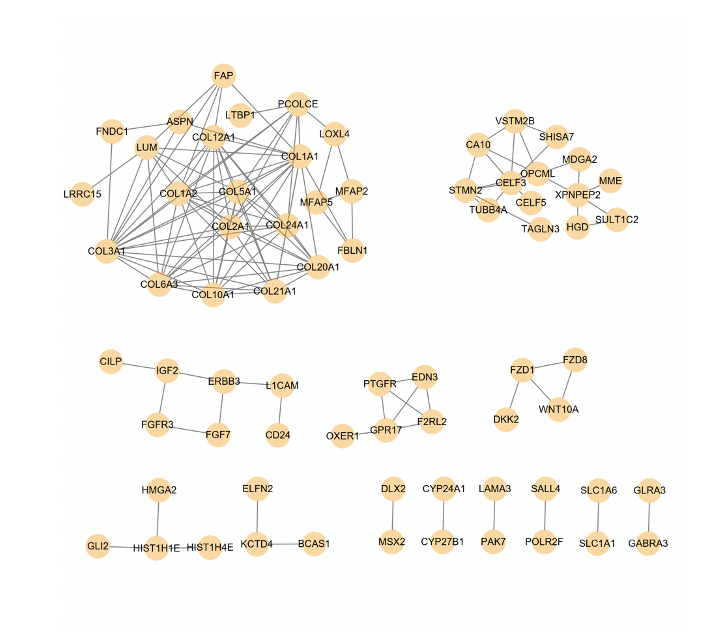
Protein–protein interaction (PPI) network generation and hub gene analysis
The Search Tool for the Retrieval of Interacting Genes (STRING) is an online database used to predict PPIs, which are essential for interpreting the molecular mechanisms of key cellular activities in carcinogenesis. In this study, we used the STRING database to build a PPI network of differentially expressed genes between high and low LTBP1 group. The cut-off standard was defined as an interaction score of 0.4 (medium). The target hub genes used for further analysis they were in the top 20 genes according to 5 cytoHubba ranking methods using Cytoscape software. The cytoHubba plug-in explore important nodes/hubs and fragile motifs in an interactome network by several topological algorithms including Degree, Edge Percolated Component (EPC), Maximum Neighborhood Component (MNC), Density of Maximum Neighborhood Component (DMNC), Maximal Clique Centrality (MCC) and centralities based on shortest paths, such as Bottleneck (BN), EcCentricity, Closeness, Radiality[67]. In general, proteins with a high “degree” are more likely to be key proteins, and MCC has better predictions for key proteins in the yeast interaction network. The protein nodes are ranked in order of importance. The darker the color, the more important the protein is in the interaction network. The hub genes were then screened out with the intersection of these different methods.
Western blot
Western blot assay was performed using primary GBM cells. 50 mg of total protein in each group were separated on 10% SDS-PAGE, then transferred to a 0.22 mm PVDF membrane (Millipore). The membranes were blocked with 5% skimmed milk at room temperature for 2 h, and then incubated with specific primary antibodies at 4 °C overnight. The membranes were incubated with appropriate HRP-conjugated secondary antibodies diluted at 1:5000 (Boster) at 37 °C for 1 h. Protein bands on the membrane were visualized with ECL Kit (Millipore) using FluorChem FC system (Alpha Innotech Corporation).
Wound healing assay
In short, a marker pen was used to draw a straight line on the back of the 6-well plate with a ruler, and evenly draw a horizontal line, about every 0.5 ~ 1cm, across the hole. Each hole crosses at least 5 lines. Add about 5 x10⁵ cells in each well, cultured overnight. On the second day, scratch straight horizontal lines on the surface of the cultured cells with 200μL pipette head. Wash the cells 3 times with PBS, remove the scratched cells, and add serum-free medium. Take pictures of the 6-well plates as baseline. Cultured the plates in incubator with 37°C and 5% CO2. 12 and 24 hours later, take out the plates and take pictures. The gap among different groups were measured.
Statistical Tests
All variables of interest are presented as the mean ± standard error and analyzed through Student’s t-test, since variables had normal distribution; and one-way ANOVA using GraphPad Prism software (Version 5.01; GraphPad Software, Inc). P < 0.05 was considered as a standard of statistically significant.