Materials
A54 was purchased from Guangzhou Sinoasis Pharmaceuticals Inc. (Guangzhou, China). Di-tert-butyl dicarbonate ((Boc)2O), N-Hydroxysuccinimide (NHS) and 1-Ethyl-3-(3-dimethylaminopropyl) carbo-diimide (EDC) were purchased from Shanghai Medpep Co., Ltd. (Shanghai, China). SA was purchased from Shanghai Chemical Reagent Co.,Ltd. (Shanghai, China). Superparamagnetic iron oxide (II, III) (SPIO, 5 nm), octadecylamine, 3-(4,5-dimethylthiazol-2-yl)-2,5-diphenyltetrazolium bromide (MTT), hoechst 33342 and fluorescein isothiocyanate (FITC) were purchased from Sigma-Aldrich Chemical. Amino-terminated polyethylene glycol (NH2-PEG-NH2, MW = 2000) was purchased from Yare Biotech, Inc. (Shanghai, China). Poloxamer 188 was from Shenyang Jiqi Pharmaceutical Co, Ltd. (Shenyang, China). Oleic acid was obtained from Hangzhou Shuanglin Chemical Industry Co. Ltd. (Hangzhou, China). Indocyanine green (ICG) was obtained from Tokyo Chemical Industry Co., Ltd. (Tokyo, Japan). Otcadecylamine (ODA, 95%) was purchased from Fluka, USA. All other chemicals were of analytical reagent grade.
The human hepatocellular carcinoma cell line (Bel-7402 cells), human hepatocellular cell line (HepG2 cells) and normal liver cell line (LO2) were purchased from the Institute of Biochemistry and Cell Biology of the China Academy of Sciences. These cells were cultured in DMEM medium containing 10% fetal bovine serum and penicillin/streptomycin (100 U⋅mL− 1, 100 U⋅mL− 1) at 37oC with a humidified atmosphere of 5% CO2.
Female BALB/c nude mice (4–5 weeks, body weight: 18 ± 2 g) were purchased from the Shanghai Silaike Laboratory Animal Limited Liability Company. All the animal studies were in accordance with the guidelines of Ethical Committee of Zhejiang University. The experiment protocols were approved by the Committee for Animal Care of Zhejiang University.
Preparation of SPIONs loaded A54-NLC (A54-MNLC)
A54-PEG-SA was firstly synthesized according to the previous study [22]. A54-MNLC was prepared by emulsion-diffusion method. Briefly, 100 µl Fe3O4 dispersion was added into 4.7 mL Poloxamer 188 (0.1%) and then dispersed in DI water by a probe sonicator (Sonicator JY92-II DN, China) for 30 minutes to obtain a water dispersed magnetic nanoparticles.100 µl of OA in ethanol solution (10 mg/mL) was further added and followed by ultrasound waterbath for 10 minutes (solution A). Subsequently, monostearin (32 mg) and A54-PEG-SA (3 mg) were dissolved in 2 mL ethanol solution at 70 °C (solution B), 200 µl of the mixture was then immediately injected into the solution A and followed by ultrasound waterbath for 10 minutes to yield the SPIONs loaded NLC nanoparticles. MNLC as a control was also fabricated using the same method as described above.
Characterization
The 1H NMR spectra of the synthesized A54- PEG-SA was obtained by NMR spectrometer (AC-80; Bruker Biospin, Germany). The average particle size, polydispersity, and zeta potential of the MNLC, A54-MNLC were determined by dynamic laser scattering (DLS) measurement using a Zetasizer (3000HS, Malvern Instruments Ltd, UK). The morphology of the nanoparticles was examined by transmission electron microscopy (TEM, JEM-1200EX, JEOL, Ltd., Tokyo, Japan).
Magnetic properties of A54-MNLC
Saturated magnetic intensity was also performed to evaluate the magnetic properties of A54-MNLC. The solutions of free SPIO, MNLC and A54-MNLC were lyophilized, then the magnetic properties of the nanoparticles were measured by a vibrating sample magnetometer (PPMS, Quantum Design, MPMS-XL-5, CA, USA) at room temperature.
In addition,the relaxivity properties were performed using a 3.0 T MRI scanner (GE, Discovery MR 750, USA). The T2-weighted MR images of naked SPIONs, MNLC and A54-MNLC solutions with different Fe3O4 concentrations (0, 1, 10, 15, 25, 50, 100 µg/mL) were acquired. The R2 relaxation times of the free SPIONs, MNLC and A54-MNLC were measured with the following parameters: Field of View, 180 × 180 mm; TR, 2000 ms; TE, 12 ms; slice thickness, 3.0 mm; number of slices, 8.
In vitro cytotoxicity
In vitro cytotoxicities of MNLC and A54-MNLC were performed on LO2 and Bel-7402 cells by MTT assay. Briefly, LO2 cells and Bel-7402 cells were seeded in 96-well plates and cultured for 24 h. Then, the medium was replaced by MNLC and A54-MNLC solution with different concentrations. The cells were incubated for another 48 h afterwards. Then the cell viability of each groups was measured by MTT assay: 20 µL of MTT solution (5 mg/mL) was added to each well and the plates were cultured for an additional 4 h. Then, the medium containing MTT solution was removed and the insoluble formazan-containing crystal was dissolved after addition of DMSO, the absorbance was recorded at 570 nm using an automatic microplate reader (Bio-Rad, model 680, USA). The untreated cells were taken as a control group with 100% cell viability. The relative cell viability was measured by the absorbance values of the treatment group divided by the absorbance values of the control group. All experiments were performed in triplicate.
In vitro Cellular uptake
The cellular uptake studies of A54-MNLC and MNLC nanoparticles were conducted on Bel-7402 and LO2 cells. Fluorescence microscopy was used to observe the time dependent cellular uptake behavior, FITC was used as a fluorescent probe. ODA-FITC was synthesized according to our previous study [24]. The FITC labeled A54-MNLC and MNLC nanoparticles were fabricated by the method as mentioned above. LO2 and Bel-7402 cells were cultured on six-well plates at a density of 3 × 10⁴ cells per well and incubated overnight afterwards. The FITC labeled A54-MNLC and MNLC nanoparticles were added and incubated with cells for 1,3, 6 and 12 h. To study the competitive inhibition, free A54 peptide (20 µg) was added to the Bel-7402 cells for 1 h before adding FITC labeled A54-MNLC nanoparticles. Then, 20 µL of Hoechst was added to stain the cell nuclei for 30 min. After incubation, the cells were washed with PBS for three times and the fixed cells were examined under a fluorescence microscopy. The quantitative analysis of the above cellular uptake was further evaluated using a flow cytometry (FC 500 MCL; Beckman Coulter, USA). All experiments were repeated three times.
In vivo distribution of A54-MNLC in extopic tumor model
The xenogafted tumor models were built by subcutaneous injection of Bel-7402 cells or HepG2 cells into the hind legs of female BALB/c nude mices (4–5 weeks, 18 ± 2 g). Two weeks after the xenogafted hepatoma models of nude mice were constructed, the real-time biodistribution of A54-MNLC was investigated by the Maestro system (Cambridge Research & Instrumentation, Inc., Woburn, MA, USA). Xenogafted Bel-7402 and HepG2 tumor bearing mice were injected intravenously with 0.2 mL ICG labeled A54-MNLC (SPIONs content was 100 µg/mL) at a dose of 5.0 mg/kg. Biodistribution of the nanoparticles in the tumor bearing mice were visualized at the predetermined time (1, 3, 6, 12, 24, 48 h). At 48 h, the major tissues of sacrificed mice were collected and imaged to observe the fluorescence signals. Fluorescence intensity associated with the amounts of A54-MNLC nanoparticles in various organs and tumors was semi-quantified using the imaging system. The distribution and accumulation of A54-MNLC in various tissues were calculated as %ID/g.
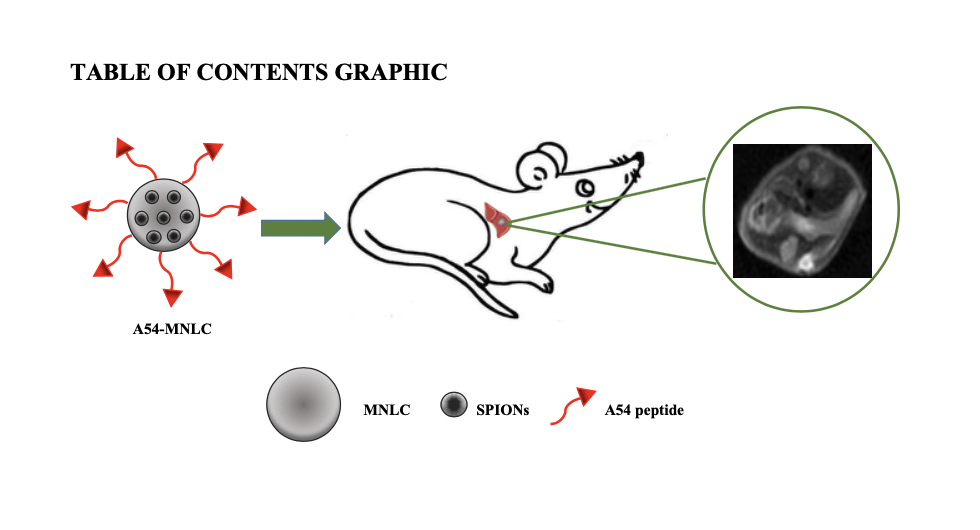
In vivo MR imaging of A54-MNLC in orthotopic tumor model
The orthotopic hepatoma tumor models were established by transplanting with Bel-7402 tumors into the liver of female BALB/c nude mice (4–5 weeks, 18 ± 2 g). The normal liver tissues were exposed by cutting longitudinally to the abdominal cavity, then the abdominal wall and skin were sutured using biodegradable stitches after implanting 1 mm3 tumor tissue into the liver parenchyma.
After 2 weeks of transplantation, the tumor bearing mice were imaged by 3.0 T MRI. For T2-weighted MR imaging, Bel-7402 tumor-bearing mics were divided into two groups (n = 5 per group). 0.2 mL A54-MNLC and MNLC nanoparticles solution at an equivalent SPIONs dose (SPIONs, 100 µg/mL) were injected into the mice through tail vein, respectively. Mice were imaged both before and after injection at the predetermined time (1, 2, 3, 6, 12, 24 h) by 3.0 T MRI. The parameters were as follows: FOV = 60 × 60 mm; TR = 3000 ms; TE = 78.6 ms; slice thickness = 2.0 mm; number of slice = 10.
Histological analysis
The orthotopic hepatoma tumor bearing mice were sacrificed to obtain the liver, washed with PBS, fixed with 4% formaldehyde, then embedded in paraffin. The sections were stained using haematoxylin-eosin (H&E) and immunohistochemistry based on the standard procedures. The microscopic images were observed under Leica fluorescence microscope.
Statistical analysis.
All the results were calculated by Student’s t test and one-way analysis of variance (ANOVA) and p-value < 0.05 was considered statistically significant. All the data were reported as the mean ± standard deviation (SD) of three separate experiments.