Subjects, Material and Methods
Ethics statement
We hereby declare that this study was approved by the Ethics Committee of the Universidade Vale do Rio Doce (UNIVALE), filed under N˚ PQ 022/09-009. All participants signed a free and informed consent (IC) at the first evaluation. Parents/guardians provided consent on behalf of participants who were minors.
Study Design and Participants
The present study was carried out in Governador Valadares, eastern of Minas Gerais State, Brazil, that is considered a hyper endemic area for leprosy with approximately 1.9 cases/10,000 inhabitants compared to Minas Gerais (0.5/10,000) and Brazil (1.2/10,000) [1]. The study comprises a cross-sectional investigation that enrolled 49 participants of both genders, age ranging from 11 to 77 years old, including 19 patients (Leprosy, 12 males and 07 females, median age = 37 years old, ranging from 11 to 77 years old) and 30 healthy controls (15 males and 15 females, median age = 32 years old, ranging from 13 to 58 years old). According to the Brazilian Guidelines [12] the patients were further categorized into two subgroups referred as: L(PB), (n=9) – patients with tuberculoid-tuberculoid (n=8); borderline-tuberculoid clinical form (n=1), including 5 males and 4 females, median age = 31 years old, ranging from 11 to 64 years old and L(MB), (n=10) – patients presenting borderline-borderline (n=3); borderline-lepromatous (n=2); lepromatous-lepromatous clinical forms (n=5), including 7 males and 3 females, median age = 42 years old, ranging from 21 to 77 years old. The group of household contacts (HHC) comprised individuals who lives or has lived with a Leprosy patient. The HHC group was further categorized into two subgroups as they were exposed to L(PB) or L(MB) patients, and referred as: HHC(PB), (n=11), including 4 males and 7 females, median age = 32 years old, ranging from 13 to 54 years old) and HHC(MB), (n=10), comprising 5 males and 5 females, median age = 30 years old, ranging from 13 to 53 years old). Heparinized whole blood sample was collected from all patients before treatment and from healthy controls and used to quantify the intracytoplasmic cytokine profile of circulating lymphocytes upon short-term in vitro culture. The study was submitted and approved by the Ethics Committee at the Universidade Vale do Rio Doce – Univale (PQ 022/09–009). All participants have read and signed the informed consent form prior to the inclusion in the study.
Short-term culture in vitro of peripheral blood mononuclear cells
Peripheral blood mononuclear cells (PBMC) were isolated from heparinized whole blood samples by Ficoll-Hypaque gradient centrifugation (Pharmacia Fine Chemicals, Piscataway, NJ, USA) and cultured as described previously by Antas [13]. Briefly, three aliquots of 1.0x10⁶ PBMC/well were incubated in 24-well flat-bottom plates (Costar Corp., Cambridge, MA, USA) with 1mL of culture medium (RPMI1640 supplemented with 20% fetal calf serum, 2mM L-glutamine, 100IU/mL penicillin and 100μg/mL streptomycin) at 37ºC, 5% CO2 in a humidified incubator. In parallel batches, triplicates of 1.0x10⁶ PBMC/well were incubated in the presence of sonicated fraction of irradiated M. leprae bacilli (10 bacilli/PBMC). M. leprae-stimulated and non-stimulated cultures were pre-incubated prior the addition of 3µg/mL of purified anti-human CD28 antibody (Pharmingen Inc., San Diego, CA, USA) for 1h and the addition of 10µg/mL of Brefeldin A (Sigma Immunochemical, St. Louis, MO, USA) 4h before the end of incubation achieved at 16, 20 and 24h. Positive control cultures were carried out using 50ng/mL PMA plus 1µg/mL ionomycin (Sigma Immunochemical, St. Louis, MO, USA) to confirm cell viability. After incubation, cells were harvested and prepared for surface and intracytoplasmic cytokine staining according to Teixeira-Carvalho [14], modified as follows: cultured PBMC suspensions were adjusted to 5.0x 10⁵ cells/mL and incubated with anti-CD4/PercP and anti-CD8/PercP-Cy5.5 (BD Bioscience, San Diego, CA, USA) for 30 min at 4ºC in the dark. Following, cells were washed with phosphate buffered saline supplemented with 0.5% bovine serum albumin (PBS-FACS), fixed in 4% paraformaldehyde (PFA) for 10min at room temperature, washed twice with PBS-FACS and once with PBS supplemented with 0.3% saponin. After fix/perm procedures the cells cultured by 16, 20 and 24h were stained, respectively with anti-IFN-γ, anti-IL-4 or anti-IL-10, labeled with PE (Pharmingen Inc., San Diego, CA, USA) for 30 min at room temperature. After two wash steps with saponin and one wash with PBS, stained cells were suspended with 1% PFA and immediately analyzed in a EPICS MCL® flow cytometer (BD Bioscience, San Jose, CA, USA) equipped with the CellQuest® software. A total of 50,000 events gated on lymphocyte regions were collected per sample. Distinct gating strategies were employed to quantify the percentages of cytokine+ cells within CD4+ and CD8+ T-cells. The percentages of cytokine+ T-cells were estimated as the sum of cytokine-producing CD4+ and CD8+ cells. The results were expressed as mean frequency (‰) ± standard error of cytokine+ cells amongst gated lymphocyte subsets upon in vitro culture in the absence/presence of M. leprae antigen.
Data analysis
Multiple comparisons amongst groups were carried out by ANOVA and Kruskal-Wallis test followed by Tuckey or Dunn’s post-test for sequential pairwise comparisons. Additionally, Student T or Mann-Whitney Test were also employed for pairwise comparative analysis. Comparative analysis of categorical variables was carried out by Chi-square. In all cases, significant differences were considered at p<0.05. The Graph Pad Prism software, Version 5.0 (San Diego, CA, USA) was employed to perform all statistical analyses and graphical arts.
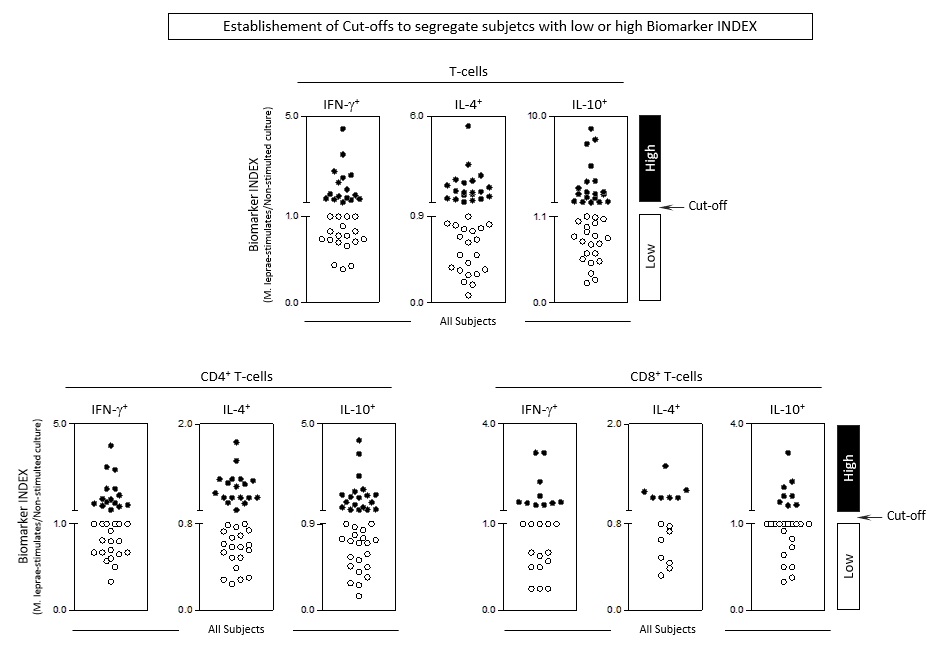
Functional biomarker signature analysis was carried out as previously reported by Vitelli-Avelar et al [15]; Silva et al [16] and Mota et al [17], modified as follow. The global median values were used for each biomarker index (M. leprae-stimulated/non-stimulated culture) as the cut-off edge to identify the proportion of subjects with high biomarker levels, i.e. above the global median cut-off. The descriptive establishment of cut-offs are provided in the Supplementary Figure 1. The cut-off values employed comprised: [IFN-g+ T-cells = 1.0, IL-4+ T-cells = 0.9 and IL10+ T-cells = 1.1; IFN-g+ CD4+ = 1.0, IL-4+ CD8+ -4 = 0.8 and IL-10+ CD4+ = 0.9; IFN-g+ CD8+ = 1.0, IL-4+ CD8+ = 0.8 and IL-10+ CD8+ = 1.0] Those biomarkers with more than 50% of subjects above the cut-off were underscored and considered for comparative analysis amongst groups. Overlaid ascendant biomarker signatures were employed for comparative analysis amongst groups. The major advantages of using this approach to describe the the cytokine signature is its ability to detect, with higher sensibility, putative minor changes not detectable by conventional statistical methods. Venn diagram analysis (http://bioinformatics.psb.ugent.be/webtools/Venn/) was employed to identify biomarkers selectively observed in Leprosy patients as compared to Healthy Controls as well as in Household Contacts and Leprosy subgroups.