The hydrothermal technique was used to make nickel telluride nanorods (NiTe NRs) utilising ascorbic acid and cetrimonium bromide (CTAB) as reducing agents. Temperature dependent magnetic study for NiTe NRs shows a ferromagnetism behavior. Under 532 nm laser excitation, the obtained materials had a better optical limiting property, with a two photon absorption coefficient of 6.6 ⋅ 10− 10 m/W and an optical limiting of 2.44 J/cm2 at 200 µJ. NiTe NRs modified electrode shows a excellent hydrogen peroxide electrocatalytic activity with reproducibility, repeatability and durability. It displays an outstanding sensitivity of 6.35 µAµM− 1 cm− 2 and a detection limit of 6 nM. In the presence of interfering species such as dopamine, uric acid, ascorbic acid, glucose, and folic acid, the electrode has a high level of selectivity. A real sample analysis for NiTe NRs sensor has been established in human serum and rat brain serum showed good recoveries.
Research Article
NiTe Magnetic Semiconductor Nanorods for Optical Limiting and Hydrogen peroxide sensor
https://doi.org/10.21203/rs.3.rs-2372403/v1
This work is licensed under a CC BY 4.0 License
Journal Publication
published 11 Feb, 2023
Read the published version in Journal of Inorganic and Organometallic Polymers and Materials →
You are reading this latest preprint version
NiTe Nanorods
Ferromagnetism
Optical limiter
Hydrogen peroxide
Human serum
Rat serum
Hydrogen peroxide (H2O2) is a key intermediate biomolecule in biological systems, as well as in the industrial, pharmacological, and clinical areas [1]. Reactive oxygen species (ROS) such as H2O2 are involved in a variety of disorders including Parkinson's disease, Alzheimer's disease, cardiovascular disease, and cancer [2, 3]. The detection of H2O2 is unable to avoid in industrial and biological system. Several analytical approach have been making use of the fast and exact determination of H2O2 such as spectrophotometry, photometry, fluorimerty, fluorescence, chemiluminescence, electrochemical [4, 5]. Electrochemical methods are higher advantages such as low cost, portable, easy to use, fast response, high selectivity, reliability, portability and consume less power [6]. The electron transfer between H2O2 and the electrode can be enhanced by enzymes. The immobilised enzymes changed the electrode as a result of denaturation, resulting in poor bioactivity, stability, and reproducibility [7, 8]. The non-enzymatic detection of H2O2 is still important, and several reactive substances have been suggested for the generation of inexpensive, sensitive, and selective catalysts.
The oxidation/reduction of H2O2 was monitored using a variety of transition metal oxide and sulphide compounds placed on the surface of electrodes. Telluride-based materials have gotten a lot of interest as a possible candidate for electron transfer ability among transition metal chalcogenide materials. Wan et al. have synthesized NiTe nanowires with thorny nanostructure for the detection of H2O2 and glucose with a detection limit of 25 nM over a linear range of 0.1–0.5 µM and 0.42 µM over a linear range of 1–50 µM by a colorimetric detection system [9]. CdTe NRs shows a sensitivity of 1326 µA mM cm− 2 with a detection limit of 0.1 µM and a rapid response time of 5 s towards H2O2 [10]. Detection of dopamine has been reported for Pt doped CoTe nanoflake with sensitivity of 0.3422 µA/nM− 1 cm− 2 and the temperature-dependent magnetization peaked at 2% Pt doped CoTe and thereafter reduced as the Pt concentration was increased [11]. Ni3Te2 have been synthesized using hydrothermal and electrodeposition method by Amil et al. The prepared Ni3Te2 electrode shows the sensitivity of 41.615 mA mM− 1 cm− 2 with a low LOD of 0.43 µM in a range between 0.01 and 0.8 mM for electrodeposited method and for hydrothermal method, its displays high sensitivity of 35.213 mA mM− 1 cm− 2 from 0.01 µM to 0.8 mM with a LOD as low as 0.38 µM. The intrinsic features of Ni3Te2 for glucose sensing through direct electro-oxidation were confirmed by the electrode good selectivity, reproducibility of current response, and long-term functional stability [12]. Non-enzymatic sensor based on NiTe nanorods has been developed for the detection and quantification of haemoglobin (Hb) from anaemic pregnant patients using a single approach [13]. Seed mediated growth approach followed by TEOS polymerization leading to the formation of silica layer surrounding Au core displayed the excellent bioelectrocatalytic activity towards H2O2 with a linear range of 8⋅10− 7 to 6⋅10− 5 M and the limit of detection was 6⋅10− 8 M at 3σ [14]. Pd/SBA-15 modified electrode showed an excellent response to the reduction of H2O2 and the linear range of 1.8 to 119.3 µM with a LOD of 0.8 µM [15].
Because of its electric, magnetic, and thermodynamic properties, NiTe antiferromagnetic with nickel arsenide type (NiAs) crystal structure has received a lot of interest. Bhat et al. [16] fabricated NiTe nanostructures electrode displays onset potential of -422 mV towards hydrogen evolution reaction and over potential of 679 mV towards oxygen evolution reaction. The remarkable performance of NiTe nanosheets on nickel foam electrode for the oxygen evolution reaction activity with over potential of 262 mV to derive 10 mAcm− 2 in alkaline medium has been reported by Wang et al. [17]. NiTe and CoTe nanoparticles showed electrocatalytic oxidation towards uric acid with a limit of detection of 0.095 and 0.875 µM [18]. In the present work, hydrothermal process of NiTe nanostructures for non-enzymatic hydrogen peroxide biosensor have been developed. A highly sensitive, efficient and cost-effective enzymeless H2O2 sensing has been taken advantages using NiTe NRs. An amperometric H2O2 sensor has been fabricated using NiTe NRs modified electrode and its applicability has been demonstrated in pharmaceutical samples.
2.1 Synthesis of NiTe NRs
Sodium telluride (Na2TeO3), nickel acetate (Ni(CH3CO2)2.2H2O) (Sigma Aldrich) and ascorbic acid (C6H8O6), cetyltrimethylammonium bromide (CTAB) (Merck) and deionized water from a Milli-Q-ultra pure (18.2 MΩ cm− 1) were used as the starting materials. 14.2 mM C6H8O6 was dissolved in 40 ml deionized water in the hydrothermal technique. After then, 0.82 mM CTAB was added. The above solution was then treated with 1.88 mM Na2TeO3 and 1.88 mM (Ni(CH3CO)2.2H2O), producing a white TeO2 precipitate almost immediately. The resulting solution was then mixed with 40 mL deionized water and transferred to a 100 mL Teflon-lined stainless steel autoclave, which was sealed and kept at 180°C for 24 hours in an oven before being allowed to cool to room temperature in air. The resultant powder was collected by centrifugation, washed with deionized water and ethanol for several times and dried at room temperature [19].
2.2 Material characterization
Energy-dispersive X-ray (EDX) mapping was done using HORIBA EMAX X-ACT (Sensor + 24V = 1s6 W, resolution at 5.9 keV). Elemental analysis was carried out by XPS using a Shimadzu ESCA 3100. On a Lakeshore 7410S vibrating sample magnetometer, magnetic measurements were taken at a low temperature (VSM). The SQUID magnetometer was used to measure low-temperature magnetization in both zero-field-cooled (ZFC) and field-cooled (FC) protocols. After chilling the sample to 5 K at a constant field of 500 Oe, the FC M-H measurements were obtained. The Z-scan approach was used to investigate nonlinear optical properties using a Nd:YAG laser (532 nm, 9 ns, 10 Hz). Before laser excitation, CdTe nanopowder was stirred continuously for 1 hour and placed in a 1 mm quartz cuvette with a transmittance of 65%. Cyclic voltammetry, amperometric response and electrochemical impedance spectroscopy (EIS) studies were carried out using CHI 1205A workstation. Informed consent was obtained from all individual participants included in the study. Rat serum is collected from the sigma company.
2.3 Fabrication of electrodes
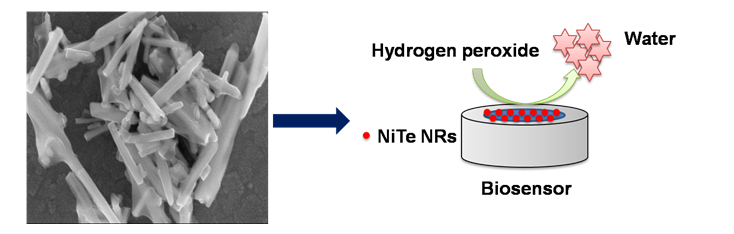
The electrochemical investigations were performed out in a three-electrode setup with a working electrode made of glassy carbon electrode (GCE), a reference electrode made of Ag/AgCl, and a counter electrode made of Pt wire. Drop casting was used to prepare the modified electrodes on the GCE surface. The GCE surface was first pre-cleaned by cycling between 1.0 and 1.2 V in 0.10 M PB (pH 7) for 10 cycles at a sweep rate of 50 mVs− 1. 7µl NiTe was then placed on the pre-cleaned GCE and dried at room temperature. Scheme 1 shows the schematic diagram of non-enzymatic H2O2 sensor application of NiTe NRs produced by green synthesized hydrothermal method.
3.1 Structural and morphological studies
Structural and morphological studies like XRD, BET, SEM and TEM for the prepared samples have been analyzed and discussed in our previous report [20]. The mapping of NiTe NRs revealed the distribution of each Ni and Te inside the composite (Fig. 1b, c and d), with corresponding FESEM image (Fig. 1a).
3.2 XPS spectra of NiTe NRs
Figure 2a shows the XPS of NiTe NRs. The binding energies of C1s and O1s are ascribed to the peak values of 284.9 and 532.0 eV, respectively. At 573.2 and 576.1 eV, Te's binding energy 3d5/2 levels are observed and it confirms the presence of Te2− and Te4+ [21]. Because Te is quickly oxidised in air, the creation of Te is a possibility (IV) [22]. Ni 2p is best suited with two spin-orbits and a satellite using Gaussian fit. The peak fitted at the binding energy of 856.1 eV in Ni 2p3/2 and 874.5 eV in Ni 2p1/2 is assigned to Ni2+ in the Ni 2p spectrum, as illustrated in Fig. 2c [23]. The satellite peaks appeared at 861.7 eV and the energy difference between the two peaks is 18.4 eV [21].
3.3 Magnetic Properties NiTe NRs
Figure 3a presents the magnetization versus applied field (M-H) curves recorded at temperature dependence VSM for NiTe sample in the field range of -10000 to + 10000 Oe under various isothermal magnetization temperatures (100 K to 300 K). The saturation magnetization (Ms) and coercivity (Hc) values of NiTe NRs measured at room temperature are 0.0008 emu g− 1 and 158 Oe. The magnetic responses of NiTe expose the paramagnetic behavior at high field and soft ferromagnetism at low magnetic field. NiTex nanorods exhibit between diamagnetism and paramagnetism based on the experimental study have been reported by Lie et al. [24].
Magnetization temperature (M-T) curves for zero-field-cooled (ZFC) and field-cooled (ZC) observations with temperature collected under a 500 Oe applied magnetic field. The solution was cooled to 2 K in the absence of a magnetic field, then a 500 Oe external field is introduced, and the behavior of the material is observed while heating from 2 K and 300 K. (Fig. 3b). The behavior is observed in the case of NiTe samples that demonstrate the paramagnetic nature. In both ZFC and FC curves, the magnetization increases with decreasing temperature. According to the literature the temperature dependence of magnetization illustrates the transition temperature at about 20 K for NiTe shows that the Curie temperature of the system is much higher than 400 K [25]. For the prepared NiTe sample the magnetic transformation occurs at 32 K. In the present work, there is no magnetic transition in the prepared samples due to the existence of paramagnetic nature. Room temperature ferromagnetism and superparamagnetic blocking behavior have been observed in NiTe [26].
3.4 Nonlinear properties of NiTe NRs
Third-order nonlinear behaviour was observed using the Z-scan approach. Z-scan is the most common method for identifying third-order nonlinear properties such nonlinear index of refraction and absorption coefficient since it is the simplest and uses the most accurate single beam approach. The polarisation of the material by the intense laser light falling on it causes nonlinear response in NiTe NRs. The material's third-order NLO performance is a critical physical trait for a variety of applications, involving optical switching and limiting. One of the most fundamental methods to determine third-order nonlinearity in a medium is the Z-scan method. An open-aperture Z-scan approach with a nanosecond pulse with a wavelength (λ) was used to calculate the nonlinear absorption coefficient (β) in the present work.
A NiTe dispersion media was placed between both the source and the detector to estimate the transparency for that specific area (z). The convex lens focused a laser source with varied energies of 100 µJ, 150 µJ, and 200 µJ on the specimen, and the sample was shifted to both sides of the focus. In Fig. 4a, the observations are plotted, and it can be shown that the material has reverse saturation absorption (RSA). When the materials are optically pumped at 532 nm, the electrons are stimulated to trapping levels of impurity or crystal defects with long lives (2.3 eV). Because intermediate trapping levels have longer durations, the likelihood of resonance two-photon transition increases.
Through numerically fitting the open aperture Z-scan curve with typical nonlinear equations, the origin of the nonlinearity was discovered. The experimental data rely on the two-photon absorption (2PA) equation

Where αo, I, Is and βeff are the linear absorption coefficient, input laser intensity, saturation intensity and two-photon absorption coefficient respectively. The corresponding propagation equation is given [10],

Genuine TPA in metal tellurides is uncommon, whereas nonlinearity is linked to free carrier absorption (FCA). There is a presence of TPA with FCA in the produced samples, which has a noticeable absorbance at 532 nm. Figure 4 has been used to calculate the optical limiting value (b). Nonlinear scattering, in addition to nonlinear absorption, plays a significant role in the optical limiting mechanism at ns laser excitation [27]. Cheng et al. revealed that the optical limiting property of graphene-PbS nanohybrids under 4 ns laser excitations is probably a combination of FCA and nonlinear scattering [28]. In this scenario, the repetition rate is 0.25 seconds, which allows bubbles to quickly develop and generate nonlinear scattering. The repetition rate in our case (9ns) is 0.11 sec, which is insufficient for forming nonlinear scattering centres. As a result, the 2PA induced free FCA for the prepared material is the source of nonlinearity. The value of and optical limiting thresholds is calculated from all of these computations and is displayed in Table 1. The positive value of indicates that this NiTe NRs absorbs all of the light at the focus and has effective two-photon absorption (2PA), making it useful in optical limiters.
|
Samples |
Energy (µJ) |
β (m/W) × 10− 10 |
OL (J/cm2) |
References |
|---|---|---|---|---|
|
Te Ag2Te3 |
- - |
0.38 1.5 |
- - |
[29] |
|
PbTe |
60 |
- |
5 |
[30] |
|
CdTe |
100 150 200 |
12 5.5 6.8 |
1.60 3.65 2.84 |
[10] |
|
NiTe |
100 150 200 |
5.2 6.2 6.6 |
3.13 2.56 2.44 |
Present work |
TPA cross-section (σTPA) is calculated using the relation [31],

The ground state absorption cross-section (σGS) is estimated,

The excited state lifetime (τ) is evaluated,

Where c denotes light speed, T0 denotes linear normalised transmittance and N denotes the total number density of active molecules (5.0181 ⋅ 1017 cm− 3) respectively. The calculated values of σTPA, σGS and τ for energies 100, 150 and 200 µJ are 3.0053, 3.5833 and 3.8145 ⋅ 10− 44 cm4 s; 1.9324, 2.0226 and 2.1129 ⋅ 10− 18 cm2; 12.23, 13.38 and 14.98 ns. A high value of τ demonstrates the attribution of ESA to the TPA. In the excited substates, the charge carriers went through many electronic transitions, resulting in a prolonged lifetime before returning to the ground states. These findings showed that CdTe had a stable nonlinear optical response and that it might be used in optical data storage applications.
3.5 Electrocatalysis of H2O2 reduction
Figure 5a displays the CV recorded for unmodified and NiTe NRs modified GCE measured at a scan rate of 50 mVs–1 in the potential range of 0 to − 0.8 V. In the supporting electrolyte comprised 50 µM H2O2, an enhanced electrocatalytic ability (24 folds higher) and fast electron transfer is found for NiTe NRs/GCE than unmodified GCE. Moreover, the over potential observed at NiTe NRs/GCE is lower (540 mV) than that of unmodified GCEs. The NiTe NRs improved electrocatalytic activity can be attributed to a strong synergetic effect and adequate tailoring. Furthermore, by a variety of interactions, the edge planes of NiTe NRs can provide additional sites for electrocatalysis. The influence of scan rate on H2O2 reduction is investigated by using different scan rates ranging from 10 to 100 mVs− 1, with oxidation increasing as the scan rate increases (Fig. 5b). The cathodic peak current increases linearly as H2O2 concentration rises. The linearity of the figure between cathodic peak current and the square root of the scan rate indicates that the reduction process is diffusion regulated (Fig. 5c). The CV achieved at NiTe NRs/GCE in 0.1 M PB (pH 7.0) having varied amounts of H2O2 ranging from 50 to 350 M is shown in Fig. 5d.
3.6 Amperometric Determination of H2O2
Figure 6a shows the amperometric response of a NiTe NRs modified electrode (rotation speed = 1200 RPM) to 50s intervals of H2O2 injections into PB (pH 7.0) (Eapp= − 0.56 V). The reactions were well-defined and rapid, and the steady-state current was attained in less than 5 s. The linear range is 35 nM–1950.12 µM (Fig. 6b) and limit of detection (LOD) is 6 nM. The sensitivity is calculated as 6.35 µAµM–1 cm–2. The previously reported H2O2 sensor and the LOD, pH and linear range are summarized in Table 2. The electrode exceptional sensing performance is demonstrated by a low limit of detection at the nanomolar level. The sensor properties are higher than the NiTe NRs integrated electrodes that are currently available.
|
Electrode |
LOD(µM) |
Linear range(µM) |
pH of PB solution |
Ref |
|---|---|---|---|---|
|
CoS/RGO |
0.042 |
0.12–2542.4 |
7 |
[5] |
|
CuS |
1.1 |
10-1900 |
7.4 |
[8] |
|
MoS2/GR-MWCNT |
0.83 |
5-145 |
7 |
[32] |
|
Te NPs |
0.3 |
0.67–8.04 |
7 |
[33] |
|
Pt/TeO2 |
0.6 |
0.2-16000 |
7 |
[34] |
|
Te NWs |
0.001 |
0.5-30000 |
7 |
[35] |
|
NiCoTe NRs |
0.02 |
0.002–1835 |
7 |
[36] |
|
NiTe NRs/GCE |
0.006 |
0.035-1950.12 |
7 |
Present work |
The interference experiment was used to test the sensor's selectivity in the presence of possible interfering substances. Figure 6c depicts the electrode's amperometric response to (a) 5 µM of H2O2, (b) 5 µM of dopamine, (c) 5 µM of uric acid, (d) 5 µM of ascorbic acid, (e) 5 µM of glucose and (f) 5 µM of folic acid, the electrode quickly responds to H2O2. However, because it is insensitive to other species, the electrode recognises and detects H2O2 in a pool of many other biological analytes.
3.7 EIS spectra for NiTe NRs
The EIS recorded at GCE (a) NiTe NRs and (b) in 0.1 M KCl adding 5 mM Fe(CN)63−/4− is shown in Fig. 8. The experimental data (inset to Fig. 8) was fitted using the Randles equivalent circuit model, in which Rs, Rct, Cdl, and Zw denote the electrolyte resistance, charge transfer resistance, double layer capacitance, and Warburg impedance, respectively. Semicircles indicate the parallel combination Rct and Cdl at electrode surface arising from electrode impedance in EIS measurements, which are depicted as Nyquist plots. The curve size (diameter of the semicircle part) obtained for GCE (621.2 Ω) is larger than that of NiTe NRs/GCE (12.4 Ω). NiTe NRs/GCE has a considerably lower Rct value than GCE, implying a reduced diffusion resistance and charge-transfer resistance.
3.8 Durability, Reproducibility and Repeatability
The sensor a of the NiTe NRs/GCE electrode material was measured every week in order to assess the sensor longevity and determine the electrode's storage stability. The electrode was maintained at 4°C while not in use. Even after 9 weeks of continuous usage, the electrode preserved 96.7% of its initial current, indicating excellent durability. Measurements at five separate electrodes in PB (pH 7.0) towards 10 M H2O2 yielded an RSD of 3.52% for the repeatability trials. Five repeated measurements at one modified electrode were used to calculate the repeatability; the RSD was 3.53%. As a result, the sensor's repeatability and reproducibility are within acceptable limits.
|
Real Samples |
Added (nM) |
Found (nM) |
Recovery (%) |
*RSD (%) |
|---|---|---|---|---|
|
Human blood Serum |
100 |
101.48 |
101.48 |
2.81 |
|
200 |
196.9 |
98.45 |
3.54 |
|
|
Rat brain Serum |
100 |
97.6 |
97.6 |
3.83 |
|
200 |
196.4 |
98.2 |
2.96 |
|
| * Related standard deviation (RSD) of 3 independent experiments | ||||
3.9 Real-Time Applicability
The fabricated sensor practical feasibility has been proved in human blood serum and rat brain serum. Before the analysis, the genuine materials were diluted in PBS (pH 7). For the optimal experimental circumstances, NiTe NRs were used in the amperometric tests. Table 3 lists the results of the recovery tests. The sensor's average recovery value is obtained to be 97.6-101.4%. The results show that the suggested NiTe NRs/GCE has a lot of potential for real-time H2O2 sensing.
To make NiTe NRs, a simple hydrothermal approach has been reported. XPS confirms the binding energy of Ni2+ and Te2-. The ferromagnetic character of NiTe NRs is revealed by the effect of temperature of magnetization, which suggests a transition temperature of roughly 32 K. The prepared materials show a better optical limiting threshold of 2.44 J/cm2 and two photon absorption coefficient of 6.6 x 10⁻¹⁰ m/W at 200 µJ. With a large working range (0.035–1950.12 µM) and a low detection limit, the NiTe NRs film modified electrode is a very sensitive non-enzymatic H2O2 amperometric sensing substrate (6 nM). The sensor's selectivity, repeatability, reproducibility, durability, and practical feasibility are other advantages. The manufacture of NiTe NRs included flexible sensor devices for H2O2 monitoring and measurement in living cells will be the focus of future research.
Associated Content
There are no associated contents
Author Information
Corresponding Authors
*E-mail: [email protected] (M. Manikandan)
Notes
The authors declare no competing financial interest.
Acknowledgment
This work was funded by the Researchers Supporting Project Number (RSP-2021/243) King Saud University, Riyadh, Saudi Arabia
- Y. Li, J.J. Zhang, J. Xuan, L.P. Jiang, J.J. Zhu, Fabrication of a novel nonenzymatic hydrogen peroxide sensor based on Se/Pt nanocomposites. Electrochem. commun. 12, 777–780 (2010). doi:10.1016/j.elecom.2010.03.031.
- K. Fang, Y. Yang, L. Fu, H. Zheng, J. Yuan, L. Niu, Highly selective H2O2 sensor based on 1-D nanoporous Pt@C hybrids with core-shell structure. Sensors Actuators, B Chem. 191, 401–407 (2014). doi:10.1016/j.snb.2013.09.090.
- S. Kogularasu, M. Govindasamy, S.M. Chen, M. Akilarasan, V. Mani, 3D graphene oxide-cobalt oxide polyhedrons for highly sensitive non-enzymatic electrochemical determination of hydrogen peroxide. Sensors Actuators, B Chem. 253, 773–783 (2017). doi:10.1016/j.snb.2017.06.172.
- S. Dong, J. Xi, Y. Wu, H. Liu, C. Fu, H. Liu, F. Xiao, High loading MnO2 nanowires on graphene paper: Facile electrochemical synthesis and use as flexible electrode for tracking hydrogen peroxide secretion in live cells. Anal. Chim. Acta 853, 200–206 (2015). doi:10.1016/j.aca.2014.08.004.
- S. Kubendhiran, B. Thirumalraj, S. Chen, C. Karuppiah, Journal of Colloid and Interface Science Electrochemical co-preparation of cobalt sulfide/reduced graphene oxide composite for electrocatalytic activity and determination of H2O2 in biological samples. J. Colloid Interface Sci. 509, 153–162 (2018). doi:10.1016/j.jcis.2017.08.087.
- K.J. Babu, A. Zahoor, K.S. Nahm, R. Ramachandran, M.A.J. Rajan, G. Gnana Kumar, The influences of shape and structure of MnO2 nanomaterials over the non-enzymatic sensing ability of hydrogen peroxide. J. Nanoparticle Res. 16, 2250 (2014). doi:10.1007/s11051-014-2250-4.
- T. Zheng, X. Lu, X. Bian, C. Zhang, Y. Xue, X. Jia, C. Wang, Fabrication of ternary CNT/PPy/K xMnO 2 composite nanowires for electrocatalytic applications. Talanta. 90, 51–56 (2012). doi:10.1016/j.talanta.2011.12.066.
- A.K. Dutta, S. Das, P.K. Samanta, S. Roy, B. Adhikary, P. Biswas, Non-enzymatic amperometric sensing of hydrogen peroxide at a CuS modified electrode for the determination of urine H2O2. Electrochim. Acta. 144, 282–287 (2014). doi:10.1016/j.electacta.2014.08.051.
- L. Wan, J. Liu, X.-J. Huang, Novel magnetic nickel telluride nanowires decorated with thorns: synthesis and their intrinsic peroxidase-like activity for detection of glucose. Chem. Commun 50, (2014) 13589-13591. doi:10.1039/c4cc06684g.
- M. Manikandan, P.N. Francis, S. Dhanuskodi, N. Maheswari, G. Muralidharan, High performance supercapacitor behavior of hydrothermally synthesized CdTe nanorods. J. Mater. Sci. Mater. Electron. 29, 17397–17404 (2018). doi:10.1007/s10854-018-9837-y.
- A. Padmanaban, N. Padmanathan, T. Dhanasekaran, R. Manigandan, S. Srinandhini, P. Sivaprakash, S. Arumugam, V. Narayanan, Hexagonal phase Pt-doped cobalt telluride magnetic semiconductor nanoflakes for electrochemical sensing of dopamine, J. Electroanal. Chem. 877, 114658 (2020). doi:10.1016/j.jelechem.2020.114658.
- B. Golrokh Amin, U. De Silva, J. Masud, M. Nath, Ultrasensitive and Highly Selective Ni3Te2 as a Nonenzymatic Glucose Sensor at Extremely Low Working Potential. ACS Omega. 4, 11152–11162 (2019). doi:10.1021/acsomega.9b01063.
- B. Fatima, U. Saeed, D. Hussain, S. e. Z. Jawad, H.S. Rafiq, S. Majeed, S. Manzoor, S.Y. Qadir, M.N. Ashiq, M. Najam-ul-Haq, Facile hydrothermal synthesis of NiTe nanorods for non-enzymatic electrochemical sensing of whole blood hemoglobin in pregnant anemic women. Anal. Chim. Acta. 1189, 339204. (2022). doi:10.1016/j.aca.2021.339204.
- J.J. Zhang, Y.G. Liu, L.P. Jiang, J.J. Zhu, Synthesis, characterizations of silica-coated gold nanorods and its applications in electroanalysis of hemoglobin. Electrochem.Commun. 10, 355–358 (2008). doi:10.1016/j.elecom.2007.12.017.
- Y. Liu, J. Zhang, W. Hou, J.J. Zhu, A Pd/SBA-15 composite: Synthesis, characterization and protein biosensing. Nanotechnology. 19, 135707 (2008). doi:10.1088/0957-4484/19/13/135707.
- K.S. Bhat, H.C. Barshilia, H.S. Nagaraja, Porous nickel telluride nanostructures as bifunctional electrocatalyst towards hydrogen and oxygen evolution reaction. Int. J. Hydrogen Energy. 42, 24645–24655 (2017). doi:10.1016/j.ijhydene.2017.08.098.
- Z. Wang, L. Zhang, In situ growth of NiTe nanosheet film on nickel foam as electrocatalyst for oxygen evolution reaction. Electrochem. commun. 88, 29–33 (2018). doi:10.1016/j.elecom.2018.01.014.
- S. Pradhan, R. Das, S. Biswas, D.K. Das, R. Bhar, R. Bandyopadhyay, P. Pramanik, Chemical synthesis of nanoparticles of nickel telluride and cobalt telluride and its electrochemical applications for determination of uric acid and adenine. Electrochim Acta. 238, 185–193 (2017). doi:10.1016/j.electacta.2017.04.023.
- S.M. Yong, P. Muralidharan, S.H. Jo, D.K. Kim, One-step hydrothermal synthesis of CdTe nanowires with amorphous carbon sheaths. Mater. Lett. 64, 1551–1554 (2010). doi:10.1016/j.matlet.2010.04.045.
- M. Manikandan, K. Subramani, M. Sathish, S. Dhanuskodi, NiTe Nanorods as Electrode Material for High Performance Supercapacitor Applications. ChemistrySelect. 3, 9034–9040 (2018). doi:10.1002/slct.201801421.
- M. Manikandan, K. Subramani, S. Dhanuskodi, M. Sathish, One-Pot Hydrothermal Synthesis of Nickel Cobalt Telluride Nanorods for Hybrid Energy Storage Systems. Energy and Fuels. 35, 12527–12537 (2021). doi:10.1021/acs.energyfuels.1c00351.
- J. Song, Y. Lin, Y. Zhan, Y. Tian, G. Liu, S. Yu, Superlong High-Quality Tellurium Nanotubes: Synthesis, Characterization and Optical Property. Cryst. Growth Des. 8, 1902-1908 (2008). doi:10.1021/cg701125k
- H. Chen, M. Fan, C. Li, G. Tian, C. Lv, D. Chen, K. Shu, J. Jiang, One-pot synthesis of hollow NiSe-CoSe nanoparticles with improved performance for hybrid supercapacitors. J. Power Sources. 329, 314–322 (2016). doi:10.1016/j.jpowsour.2016.08.097.
- Y. Lei, N. Miao, J. Zhou, Q.U. Hassan, J. Wang, Novel magnetic properties of CoTe nanorods and diversified CoTe2 nanostructures obtained at different NaOH concentrations. Sci. Technol. Adv. Mater. 18, 325–333 (2017). doi:10.1080/14686996.2017.1317218.
- N. Umeyama, M. Tokumoto, S. Yagi, M. Tomura, K. Tokiwa, T. Fujii, R. Toda, N. Miyakawa, S.I. Ikeda, Synthesis and magnetic properties of NiSe, NiTe, CoSe, and CoTe. Jpn. J. Appl. Phys. 51, 053001 (2012). doi:10.1143/JJAP.51.053001.
- M. Ragam, G. Kalaiselvan, S. Arumugam, N. Sankar, K. Ramachandran, Room temperature ferromagnetism in MnxZn1−xS (x=0.00–0.07) nanoparticles. J. Alloys Compd. 541, 222–226 (2012). doi:10.1016/j.jallcom.2012.07.024.
- A. Seetharaman, D. Sivasubramanian, V. Gandhiraj, V.R. Soma, Tunable Nanosecond and Femtosecond Nonlinear Optical Properties of C-N-S-Doped TiO2 Nanoparticles, J. Phys. Chem. C. 121, 24192–24205 (2017). doi:10.1021/acs.jpcc.7b08778.
- M. Zhao, R. Peng, Q. Zheng, Q. Wang, M.-J. Chang, Y. Liu, Y.-L. Song, H.-L. Zhang, Broadband optical limiting response of a graphene–PbS nanohybrid. Nanoscale. 7, 9268–9274 (2015). doi:10.1039/C5NR01088H.
- C.S. Suchand Sandeep, A.K. Samal, T. Pradeep, R. Philip, Optical limiting properties of Te and Ag2Te nanowires. Chem. Phys. Lett. 485, 326–330 (2010). doi:10.1016/j.cplett.2009.12.065.
- K. Sridharan, V. Tamilselvan, D. Yuvaraj, K. Narasimha Rao, R. Philip, Synthesis and nonlinear optical properties of Lead Telluride nanorods. Opt. Mater. 34, 639–645 (2012). doi:10.1016/j.optmat.2011.09.009.
- A. Das, S. Ratha, R. K. Yadav, A. Mondal, C.S. Rout, and K. V. Adarsh, Strong third-order nonlinear response and optical limiting of α-NiMoO4 nanoparticles. J Appl. Phys. 122, 013107 (2017). https://doi.org/10.1063/1.4992806
- M. Govindasamy, V. Mani, S.M. Chen, R. Karthik, K. Manibalan, R. Umamaheswari, MoS2 flowers grown on graphene/carbon nanotubes: A versatile substrate for electrochemical determination of hydrogen peroxide. Int. J. Electrochem. Sci. 11, 2954–2961 (2016). doi:10.20964/110402954.
- M. Manikandan, S. Dhanuskodi, N. Maheswari, G. Muralidharan, C. Revathi, R.T. Rajendra Kumar, G. Mohan Rao, High performance supercapacitor and non-enzymatic hydrogen peroxide sensor based on tellurium nanoparticles. Sens. Bio-Sensing Res. 13, 40–48 (2017). doi:10.1016/j.sbsr.2017.02.001.
- M.R. Guascito, D. Chirizzi, C. Malitesta, T. Siciliano, A. Tepore, Te oxide nanowires as advanced materials for amperometric nonenzymatic hydrogen peroxide sensing. Talanta. 115, 863–869 (2013). doi:10.1016/j.talanta.2013.06.032.
- M.R. Guascito, D. Chirizzi, C. Malitesta, E. Mazzotta, M. Siciliano, T. Siciliano, A. Tepore, A. Turco, Low-potential sensitive H2O2 detection based on composite micro tubular Te adsorbed on platinum electrode. Biosens. Bioelectron. 26, 3562–3569 (2011). doi:10.1016/j.bios.2011.02.002.
- M. Mayilmurugan, G. Rajamanickam, R. Perumalsamy, D. Sivasubramanian, Nickel Cobalt Telluride Nanorods for Sensing the Hydrogen Peroxide in Living Cells. ACS Omega. 7, 14556-14561 (2022). doi:10.1021/acsomega.1c06007.
Scheme 1 is available in Supplementary Files section.
No competing interests reported.
- Scheme1.png
Scheme 1 NiTe NRs for non-enzymatic H2O2 sensor