Production of rabbit anti-tiger IgG polyclonal antibody
Purified Bengal tiger IgG was obtained from a previous study [32]. New Zealand white rabbits were weekly subcutaneously immunized with purified tiger IgG formulated with Montanide™ ISA 206 VG (Seppic, Paris, France; 1:1 v/v, 100 µg/ml) for 4 weeks. Rabbit antisera were then purified using a Melon™ Gel IgG Purification Kit following the manufacturer’s instructions. Concentrations of purified rabbit anti-tiger IgG polyclonal antibody was measured using the bicinchoninic acid (BCA) protein assay (BCA protein assay kit; Pierce, Rockford, IL, USA) according to the manufacturer’s instructions and then stored at −20°C for further analysis.
Preparation of HRP-conjugated rabbit anti-tiger IgG antibody
The two-step glutaraldehyde method was used to couple HRP with rabbit anti-tiger IgG as has been previously described by Chansiw et al. (2008) [33]. Briefly, 2 mg of HRP (Sigma-Aldrich, St. Louis, Missouri, USA) were dissolved in 200 μl of 0.1 M potassium phosphate buffer (pH 6.8) in 1.25% glutaraldehyde 200 μl and incubated at 4°C for 18 hrs with an end-over-end rotator. Excess free glutaraldehyde was removed by 10K Vivaspin® 500 (Sartorius Stedim Biotech Gmbh, Goettingen, Germany) and the specimens were centrifuged at 10,000 rpm for 30 min. They were then resuspended with 200 μl of 0.1 M sodium carbonate-bicarbonate buffer (pH 9.5) with 30% sucrose and collected in a microcentrifuge tube. Micro Bio-Spin™ Chromatography Columns (Bio-Rad Laboratories, Hercules, CA, USA) were used for buffer exchange to the appropriate buffer for the antibody according to the manufacturer’s instructions. Subsequently, 500 μl of 0.15 M NaCl were added to the column, and the column was then centrifuged at 1,000 × g for 1 min and washed three times. Rabbit anti-tiger IgG 1 mg/100 μl was carefully added directly to the center of the column, and the column was then centrifuged at 1,000 × g for 4 min. Rabbit anti-tiger IgG (1 mg/100 μl) was mixed with HRP (2 mg/200 μl) and incubated overnight at 4°C using an end-over-end rotator. Additionally, 15 μl of 2 M glycine were added and the specimens were centrifuged by 50K Amicon® Ultra-15 (Merck Millipore Ltd, Cork, Ireland) at 3,400 rpm for 30 min to eliminate the excess HRP and other buffers. Subsequently, 100 μl of the phosphate-buffered saline (PBS, pH 7.2) was resuspended. Next, 500 μl of PBS buffer (pH 7.2) were added to the Micro Bio-spin® Chromatography Column for buffer exchange. The column was then centrifuged at 1,000 × g for 1 min and washed three times. HRP-IgG solution was then carefully added to the column and it was centrifuged at 1,000 × g for 4 min in order to allow the solution to collect in a microcentrifuge tube. HRP-conjugated rabbit anti-tiger IgG was obtained and then stored at -20°C for further analysis.
Determination of avidity and specificity of tiger IgG and rabbit anti-tiger IgG polyclonal antibody by western blot
Immunochemical analysis of purified protein was done by western blot technique according to the method of Towbin et al. (1979) [34] with some modifications. Briefly, the purified tiger IgG was separated by sodium dodecyl sulfate polyacrylamide gel electrophoresis (SDS-PAGE) according to the method described by Laemmli (1970) [35]. Samples were prepared in sample buffer and boiled at 95°C for 5 min and then analyzed on 10% SDS-PAGE gel slabs in a mini-slab apparatus (Bio-Rad Laboratories, Hercules, CA, USA). The protein on SDS-PAGE gel was electrically transferred onto a nitrocellulose membrane (Merck Millipore™, Merck KGaA©, Darmstadt, DEU). The blotting time was 60 min at a constant voltage of 10 V. The membrane was incubated with blocking buffer (5% skim milk in PBS) for 1 hr at room temperature with gentle shaking. After being washed three times with washing buffer (PBS containing 0.05% Tween® 20; PBST), the membrane was probed with HRP-conjugated rabbit anti-tiger IgG (1:500 dilution) obtained from previous step and HRP-conjugated goat anti-cat IgG (1:2000 dilution; KPL, Gaithersburg, MD, USA) antibodies, separately. The membrane was then incubated with gentle shaking at room temperature for 1 hr and washed three times. Finally, the reactions were visualized using a solution containing 3,3´-diaminobenzidine (DAB; Invitrogen, Carlsbad, CA, USA) with hydrogen peroxide (H2O2; Merck, Germany).
Animals
All of tigers included in the study belonged to the Tiger Kingdom, Mae Rim, Chiang Mai, Thailand. During the study, the tigers were fed, housed and managed according to Tiger Care Manual [11]. All sampling procedures were monitored and controlled under veterinarian. After the study, all of tigers, a protected wildlife animals in Thailand, were kept and looked after at Tiger Kingdom, Mae Rim and Tiger Kingdom learning centre, Mae Tang, Chiang Mai.
Vaccination and blood sampling
Forty-three tigers were included in this study. All tigers were vaccinated with an inactivated vaccine (Fel-O-Vax® 4 Vaccine; Boehringer Ingelheim Vetmedica, Inc. St. Joseph, MO, USA) according to the vaccination protocol described in the Tiger Care Manual [11]. Blood samples were collected from the saphenous vein after administering anesthesia. A blood sample was taken from each tiger prior to the vaccinations and every 3 months for 1 year. Sera were prepared by centrifugation and stored at -20°C for further analysis.
Hemagglutination Inhibition (HI) test
Tiger sera were tested using the HI test following the method that had been previously described [36]. HI titer that was higher than 1:20 was considered as seropositive.
Capsid protein or viral protein 2 (VP2) subunit antigen prediction and synthesis
The VP2 subunit antigen was predicted based on the amino acid sequence accession number ABN70938.1 using the linear and conformational epitope prediction software as was described in the previous report [37]. The selected amino acid sequence (WNPIQQMSINVDNQFNYVPNNIGAMKIVYEKSQLAPRKLY) was then further synthesized (Genscript, Piscataway, New Jersey, USA).
In-house indirect ELISA
The reaction was performed in 96-well plates (Nunc-Immuno™ MaxiSorp™; Sigma-Aldrich). Each well was coated with an optimal concentration of synthetic VP2 capsid protein with coating buffer (0.05 M carbonate bicarbonate buffer, pH 9.6). Each plate was incubated overnight at 4°C and then washed three times with 200 µl of washing buffer (PBST, pH 7.2). Non-specific binding sites were blocked with 100 µl per well of blocking buffer (1% skim milk in PBS) for 1 hr at 25°C. After being washed three times with PBST, 100 μl of tiger serum that was diluted in blocking buffer was added to each well and the plate was incubated for 1 hr at 25°C. After washing three times with PBST, 100 μl of either HRP-conjugated goat anti-cat IgG (KPL) or HRP-conjugated rabbit anti-tiger antibody diluted in blocking buffer were added to each well. The reaction was performed for 1 hr at 25°C. After completion, any excess antibody was washed out with PBST over the course of three washings. One hundred μl of tetramethylbenzidine (TMB; KPL) was added to each well as a substrate. The reaction was performed in the dark for 15-30 min at room temperature before being stopped by adding 50 μl of 2 N H2SO4. The absorbance was measured at a wavelength of 450 nm using an automatic ELISA plate reader (AccuReader; Metertech, Taipei, Taiwan). The results were expressed as an OD value.
Optimization of an in-house indirect ELISA
Checkerboard titration was performed according to Crowther (2009) [38] to determine the optimal dilutions of the sera and conjugated antibody. Pooled vaccinated sera and pooled non-vaccinated sera were analyzed according to the ELISA method as has been previously described and ranged from 1:100 to 1:500 dilutions. The HRP-conjugated antibody was varied from 1:1000 to 1:4000 dilutions. The optimal dilutions of serum and HRP-conjugated antibody were defined as those at which the ratio was the greatest between the vaccinated and non-vaccinated sample OD values.
Calculation of cut-off value
The cut-off value was obtained by OD value at a wavelength of 450 nm and calculated from the mean plus 3 standard deviations (SD) of the non-vaccinated group [38]. For further interpretation, any tiger sera with an OD value of more than or equal to the cut-off value were classified as seropositive. Tiger sera with an OD value that was less than the cut-off value were classified as seronegative.
Determination of sensitivity and specificity
A latent class analysis was performed using a Bayesian model to determine the sensitivity and specificity of two indirect ELISA tests and the HI test. Since all three tests are based on the detection of antibody response, their results were considered conditionally dependent upon each other [39]. Therefore, a Bayesian model for three diagnostic tests was implemented in one population in order to determine the sensitivity and specificity of each test.
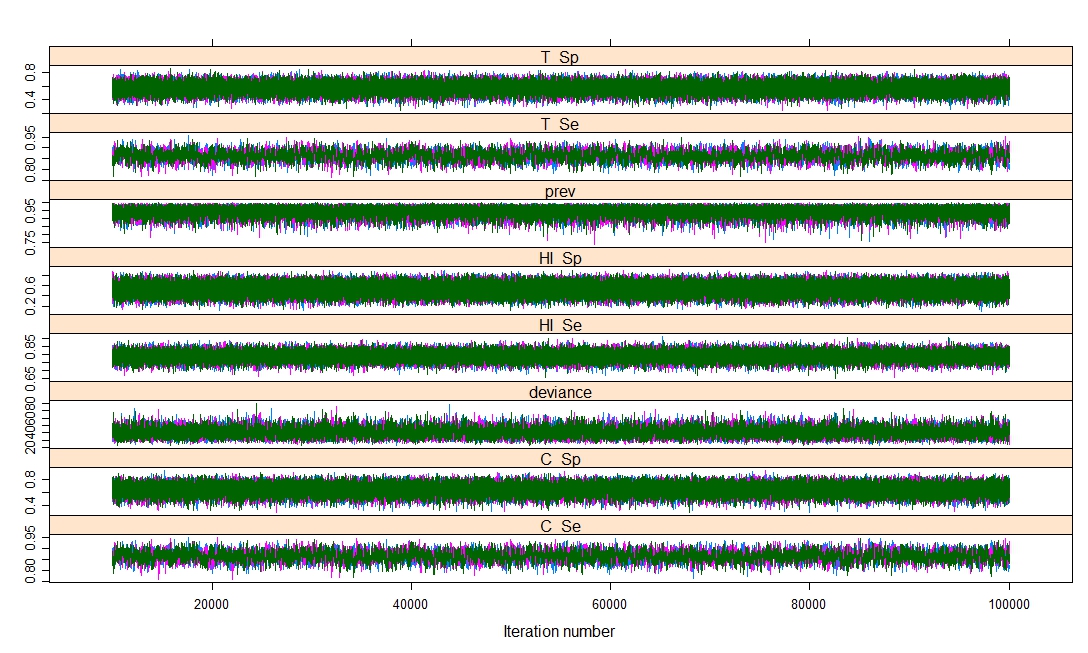
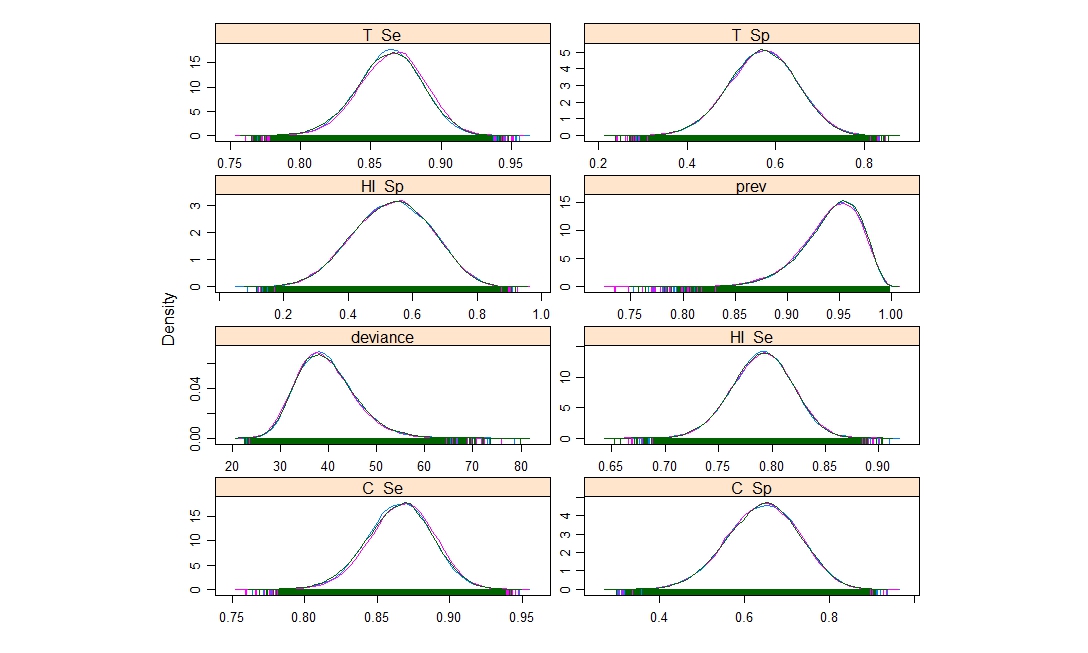
Prior information on test performance and the prevalence of antibodies was introduced into the analysis using probability distributions (prior distribution). As a result of a lack of prior information on three tests, the sensitivity and specificity of prior values for indirect ELISA and HI tests were modeled as beta distributions based on three expert opinions. Prior value for the prevalence of antibodies against FPV vaccine in tigers in Chiang Mai was also selected based on opinions from three zoo and wildlife experts due to a lack of published information. Prior values used for analysis (sensitivity, specificity, and prevalence) are listed in Table 4. All analyses were implemented in JAGS 3.4.0 [40] via the rjags and R2jags packages [41-42] obtained from R 3.2.2 software [43]. Posterior distributions were computed after 100,000 iterations of models with the first 10,000 being discarded as the burn-in phase.
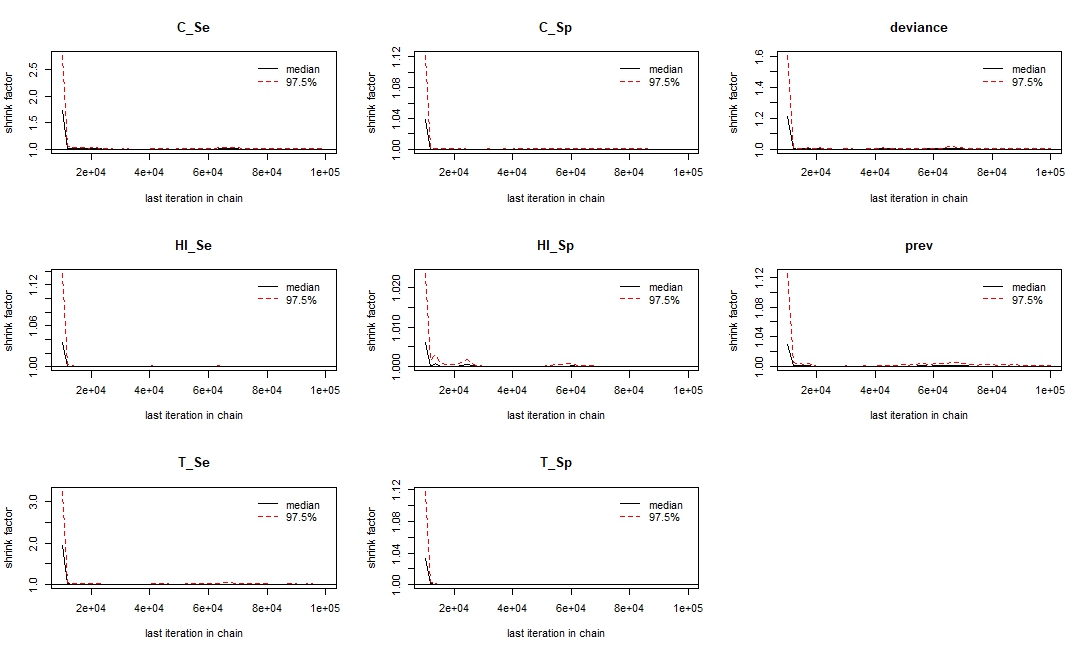
The model convergence was assessed by visual inspection of the Gelman-Rubin diagnostic plots [44-45] using three sample chains with different initial values. The goodness of fit of the models was evaluated using DIC [46], and the number of effectively estimated parameters (pD) [47] served as the calibrating parameters. The model sensitivity analysis was performed to assess the influence of prior information and the assumption of conditional dependence between the two ELISA tests and the HI test on the posterior estimates [27, 48]. These analyses were performed by replacing each prior value with a non-informative uniform 0-1 distribution and by comparing the DIC between models with and without the covariance term [27].