Data
GTEx (release V6p) whole transcriptome (RNAseq) data (dbGaP accession #8834) were downloaded from dbGaP. TCGA LIHC Affymetrix Human Omni 6 array genotype data, whole exome sequencing (WES) and RNAseq data (dbGaP accession #11368) were downloaded from NCI Genomic Data Commons [15]. In total, RNAseq data from 91 male and 45 female GTEx donors, germline genotypes and tumor RNAseq data from 248 male and 119 female TCGA LIHC donors, as well as paired tumor and tumor-adjacent samples from 28 male and 22 female TCGA LIHC donors were utilized in this study. FASTQ read files were extracted from the TCGA LIHC WES BAM files using the strip_reads() function of XYAlign [16]. We used FastQC [17] to assess the WES and RNAseq FASTQ quality. Reads were trimmed using TRIMMOMATIC IlluminaClip [18], with the following parameters: seed mismatches 2, palindrome clip threshold 30, simple clip threshold 10, leading quality value 3, trailing quality value 3, sliding window size 4, minimum window quality 30 and minimum read length of 50.
Read mapping and read count quantification
Sequence homology between the X and Y chromosomes may cause the mismapping of short sequencing reads derived from the sex chromosomes and affect downstream analyses [16]. To overcome this, reads were mapped to custom sex-specific reference genomes using HISAT2 [19]. Female samples were mapped to the human reference genome GRCh38 with the Y-chromosome hard-masked. Male samples were mapped to the human reference genome with Y-chromosomal pseudoautosomal regions hard-masked. Gene-level counts from RNAseq were quantified using Subread featureCounts [20]. Reads overlapping multiple features (genes or RNA families with conserved secondary structures) were counted for each feature.
Germline variant calling and filtering
BAM files were processed according to Broad Institute GATK (Genome Analysis Toolkit) best practices [21–23]: Read groups were added with Picard Toolkit’s AddOrReplaceReadGroups and optical duplicates marked with Picard Toolkit’s MarkDuplicates (v.2.18.1, http://broadinstitute.github.io/picard/). Base quality scores were recalibrated with GATK (v.4.0.3.0) BaseRecalibrator. Germline genotypes were called from whole blood Whole Exome Sequence samples from 248 male and 119 female HCC cases using the scatter-gather method with GATK HaplotypeCaller and GenotypeGVCFs [21]. Affymetrix 6.0 array genotypes were lifted to GRCh38 using the UCSC LiftOver tool [24] and converted to VCF. Filters were applied to retain variants with a minimum quality score > 30, minor allele frequency > 10%, minor allele count > 10, and no call rate < 10% across all samples.
Clinical characteristics and cellular content of tumor samples
Confounding effects, e.g. differences in clinical and pathological characteristics or cell type composition of the sequenced samples, may contribute to the observed effect modification when utilizing stratified analyses. We examined the differences in the clinical characteristics between males and females in the TCGA LIHC cohort. We used a t-test to test for the equality of means in patient age and cell type proportions, and Fisher’s exact test to test to detect differences in risk factors and pathological classifications (Supplementary Tables S1 and S2).
Filtering of gene expression data
FPKM (Fragments Per Kilobase of transcript per Million mapped reads) expression values for each gene were obtained using EdgeR [25]. Each expression dataset was filtered to retain genes with mean FPKM≥0.5 and read count of ≥6 in at least 10 samples across all samples under investigation. In the comparative analysis of differentially expressed genes (DEGs) between the tumor vs. tumor-adjacent samples in males, females, and both sexes, genes that reached the previously described expression thresholds in at least one tissue in at least one sex were retained. This assures that the DEGs detected in the sex-specific and combined analyses are not due to filtering.
Differential expression analysis
For differential expression (DE) analysis, filtered, untransformed read count data were quantile normalized and logCPM transformed with voom [26]. From the TCGA LIHC dataset, paired tumor and tumor-adjacent samples were available for 22 females and 28 males. From the GTEx liver dataset, 91 male and 45 female samples were used in the DE analysis. A multi-factor design with sex and tissue type as predictor variables were used to fit the linear model. duplicateCorrelation function was used to calculate the correlation between measurements made between tumor and tumor-adjacent samples on the same subject, and this inter-subject correlation was accounted for in the linear modeling. As the paired tumor samples differed significantly between the sexes in terms of race, tumor grade, and HBV status, (Supplementary Tables S1 and S2), these parameters were included in the linear models as covariates. Due to missing values in the covariate data, the final numbers of sample pairs used in the analyses were 18 females and 26 males.
DEGs between comparisons were identified using the limma/voom pipeline [26] by computing empirical Bayes statistics with eBayes. An FDR-adjusted p-value threshold of 0.01 and an absolute log2 fold-change (FC) threshold of 2 were used to select significant DEGs.
To reliably detect genes that are expressed in a sex-biased way in HCC but not in non-diseased liver or in tumor-adjacent tissue, we examined genes that were DE in the male vs. female tumor comparison using the previously described significance thresholds, but not in the male vs. female comparisons of normal or tumor-adjacent samples with a relaxed significance threshold of FDR-adjusted p-value ≤ 0.1 and absolute log2(FC) ≥ 0.
To detect genes that are dysregulated in tumors compared to matched tumor-adjacent samples in each sex, we identified DEGs in the tumor vs. tumor-adjacent comparison of males, females, and in the whole sample. DEGs that were identified in one sex but not in the other or in the combined analysis of both sexes were considered sex-specific. DEGs identified in the combined analysis were considered sex-shared. This approach allows the identification of high-confidence sex-specific events that are a result of the underlying biological differences as opposed to sampling or statistical power. ANOVA and Kruskal-Wallis tests were used to test for equality of fold changes of sex-shared and sex-specific DEGs across male, female, and all samples.
Overrepresentation of biological functions and canonical pathways
We further analyzed the sex-shared and sex-specific tumor vs. tumor-adjacent DEGs as well as the sex-specific eQTL target genes (eGenes) to identify sex-shared and sex-specific pathways driving HCC etiology. We used the NetworkAnalyst web tool [27], which utilizes a hypergeometric test to compute p-values for the overrepresentation of genes in regards to GO terms and KEGG and Reactome pathways. An FDR-adjusted p-value threshold of 0.01 was used to select significantly overrepresented GO terms and canonical pathways.
Accounting for confounding effects and population structure
Gene expression values are affected by genetic, environmental, and technical factors, many of which may be unknown or unmeasured. Technical confounding factors introduce sources of variance that may greatly reduce the statistical power of association studies, and even cause false signals [28]. Thus, it is necessary to account for known and unknown technical confounders. This is often achieved by detecting a set of latent confounding factors with methods such as principal component analysis (PCA) or Probabilistic Estimation of Expression Residuals (PEER) [29]. These surrogate variables are then used as covariates in downstream analyses. We derived 10 PEER factors from the filtered tumor gene expression data and used the weights of these factors as covariates in the eQTL analysis. We used the R package SNPRelate [30]to perform PCA on the germline genotype data. We accounted for population structure by applying the first three genotype PCs as covariates in the eQTL analysis.
eQTL analysis
We used eQTL analyses to detect germline genetic effects on tumor gene expression. Similar to the DE analysis, we utilized combined and sex-stratified analyses to detect sex-shared and sex-specific effects. Germline genotypes and tumor gene expression data from 248 male and 119 female donors in the TCGA LIHC cohort were used in the eQTL analysis. Filtered count data was normalized by fitting the FPKM values of each gene and sample to the quantiles of the normal distribution. To account for technical confounders and population structure, 10 de novo PEER factors and three genotype principal components were used as covariates. Cis-acting (proximal) eQTLs were detected by linear regression as implemented in QTLtools v.1.1 [31]. Variants within 1Mb of the gene under investigation were considered for testing. We used the permutation pass with 10,000 permutations to get adjusted p-values for associations between the gene expression levels and the top-variants in cis: first, permutations are used to derive a nominal p-value threshold per gene that reflects the number of independent tests per cis-window. Then, QTLtools uses a forward–backward stepwise regression to determine the best candidate variant per signal [31]. FDR-adjusted p-values were calculated to correct for multiple phenotypes tested, and an adjusted p-value threshold of 0.01 was used to select significant associations. To allow the comparison of effect sizes of sex-specific and sex-shared eQTLs across the sexes, effects of each variant located within the 1Mb cis-window were obtained using the QTLtools nominal pass.
Similarly to the tumor vs. tumor-adjacent DEGs, eQTLs that were detected in one sex but not in the other or in the combined analysis were considered sex-specific, while eQTLs detected in the combined analysis were considered sex-shared. ANOVA and Kruskal-Wallis tests were used to test for equality of effect sizes of sex-shared and sex-specific eQTLs across male, female, and all samples.
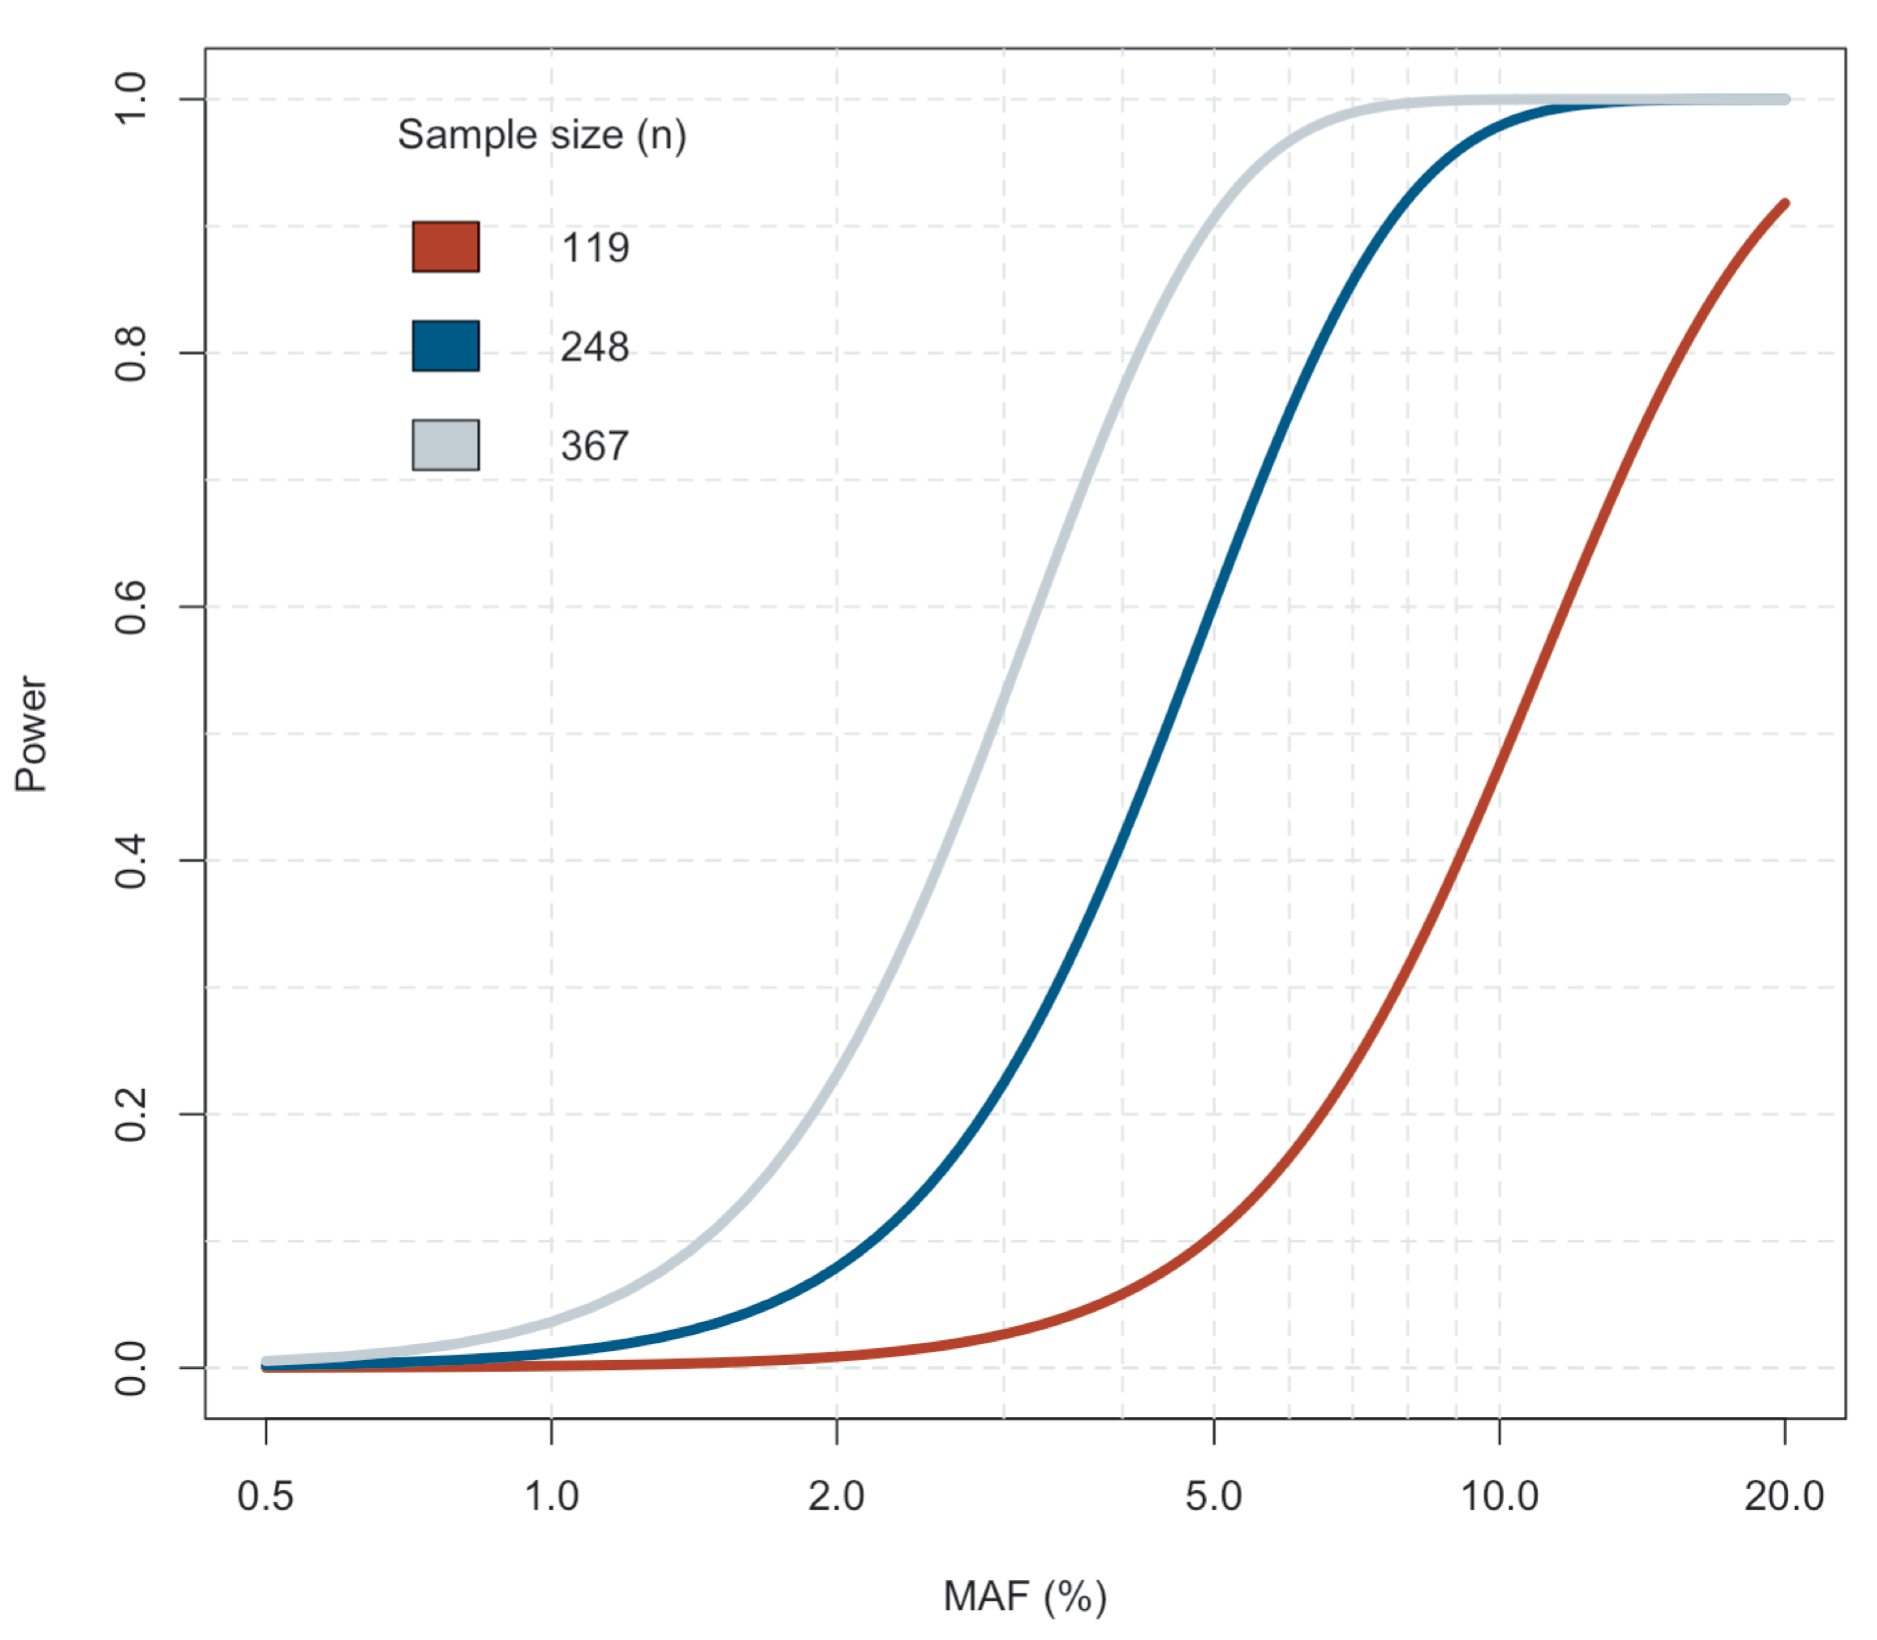
Estimating statistical power in the eQTL analysis
We used the R package powereQTL [32] to estimate the effect of the sample size to the statistical power to detect eQTLs in the combined analysis of both sexes and in the sex-specific analyses (Fig. S2).
Genomic annotations of eQTLs
We used the R package Annotatr to annotate the genomic locations of eQTLs [33]. Variant sites were annotated for promoters, 5'UTRs, exons, introns, 3'UTRs, CpGs (CpG islands, CpG shores, CpG shelves), and putative regulatory regions based on ChromHMM [34] annotations.