Identification of 6-Prognosis-Related Genes
After the intersection of 19620 coding genes and 312 ferroptosis-related genes in the TCGA training cohort, 304 FRGs were obtained for further screening (Fig. 2B). Univariate Cox regression analysis of 304 genes yielded 47 genes associated with OS ( p < 0.05 )(Fig. 2A). Further the least absolute shrinkage and selection operator (LASSO) regression analysis was performed on 47 genes, 29 meaningful genes were screened out and the coefficients of each gene were obtained(Figs. 2B-D). Kaplan–Meier(K-M) survival analysis was performed on these genes one by one, and 6 prognostic genes were obtained with p < 0.01 as the cut-off value. The results are shown in Figs. 3A-F. OS of the high expression group of EGFR or FADS1 was significantly worse than the low expression group. On the contrary, OS in the high expression group of ISCU, PGRMC1, PTPN6, or TRIM26 was better than in the low expression one. Hence EGFR and FADS1 were identified as high-risk genes, while ISCU, PGRMC1, PTPN6, and TRIM26 were identified as low-risk genes. The protein-protein interaction (PPI) map of 6 FRGs was drawn in Fig. 3G and the results showed that 6 FRGs were closely related to FADS2, CYB5D1, CYB5D2, and NENF.
Construction and Internal Validation of 6-Gene Prognostic Risk Model
Based on the coefficients obtained by LASSO regression, the risk score of each tumor sample was calculated to construct a prognostic risk model. The formula is :
risk score = ( 0.0787 ) * EGFR + ( -0.1029 ) * PTPN6 + ( -0.4132 ) * TRIM26 + ( -0.1010 ) * PGRMC1 + ( -0.0908 ) * ISCU + ( 0.0278 ) * FADS1. The risk distribution diagram was drawn(Figs. 3H-J). The TCGA training cohort was divided into high-risk group(n = 130) and low-risk group(n = 130) according to the median risk score. K-M survival curve indicated that the OS of the high-risk group was shorter than that of the low-risk group(Fig. 4A, HR = 2.26, 95% CI 1.57–3.25, P < 0.001). The time-dependent receiver operating characteristic (time-dependent ROC) curves indicated that area under the curve (AUC) values were 0.71, 0.67, and 0.70 in 1st year, 3rd year, and 5th year(Fig. 4B), indicating the excellent prediction performance of the model. As shown in Fig. 3I, patients in the high-risk group had worse OS, which was accordant with the results of the K-M curve. Principal Component Analysis(PCA) and t-distributed Stochastic Neighbor Embedding(t-SNE) analysis indicated that patients in the high-risk and low-risk groups were spatially distributed in two directions (Figs. 4C, D). The difference of 6 FRGs expression in high- and low-risk groups was compared in Fig. 4E. In TCGA validation cohort ( n = 140 ), the risk score was calculated in the same way as in TCGA training cohort, 140 validation samples were divided into high-risk groups (n = 70) and low-risk groups(n = 70), and K-M survival curve showed that the survival in high-risk group was poor than in low-risk group(Fig. 4F, P < 0.05 ). At the same time, time-dependent ROC was performed and the AUC values were 0.64 in the first year, 0.63 in the third year, and 0.70 in the fifth year (Fig. 4G), indicating that the model was meaningful for the prediction of OS.
Relationship Between Different Clinicopathological Variables and the Prognosis Model of BC Patients
According to other covariates, 260 BC training samples were divided into 8 different subgroups (male, female, age < 70, age ≥ 70, non-papillary type, papillary type, stage I-II, stage III-IV). The effect of risk score on OS was compared respectively. The results showed that the death rate of high-risk groups in all subgroups was faster than corresponding low-risk groups(Figs. 5A-H, P < 0.05 ), demonstrating that the 6-gene prognostic model was not affected by clinical and pathological variables, which further illustrated the accuracy of the prognostic model.
External Validation of Prognostic Risk Model
Three independent datasets (GSE69795、GSE48075、GSE48276) were downloaded to conduct further external validation. Samples with incomplete clinical information were excluded. In GSE69795 validation cohort (n = 36), the risk score was calculated based on the expressions and coefficients of 6 risk genes, 36 validation samples were divided into high-risk group(n = 18)and low-risk group(n = 18), and K-M survival curve showed that the survival in high-risk group was obviously poor than that in low-risk group(Fig. 6A, p < 0.05 ). The AUC value of total ROC curve was 0.688(Fig. 6D). According to the same calculation and grouping method, In GSE48075 validation cohort ( n = 73 ), K-M survival curve showed that the survival in high-risk group(n = 36) was obviously poor than that in low-risk group(n = 37)(Fig. 6B, p < 0.05 ). The AUC vaule of total ROC curve was 0.639(Fig. 6E). In GSE48276 validation cohort ( n = 72 ), K-M survival curve showed that the survival in high-risk group(n = 36) was obviously worse than that in low-risk group(n = 36)(Fig. 6C, p < 0.05 ). The AUC value of total ROC curve was 0.634(Fig. 6F). The accuracy of the ferroptosis-related prognostic model was further validated by three external cohorts.
Enrichment Analysis of Ferroptosis-Related Genes
After analyzing Differentially Expressed Ferroptosis-related Genes (DEFRGs) between high- and low-risk groups, 38 DEFRGs (38/304, 12.5%) were identified, of which 30 genes were up-regulated in the high-risk group and 8 genes were down-regulated in the high-risk group, as shown in Figs. 7A-C. Gene Ontology (GO) and Kyoto Encyclopedia of Genes and Genomes (KEGG) enrichment analyses were conducted to explore the molecular mechanism affecting survival outcome(p < 0.05 was considered significant). Graphical results of GO and KEGG are shown in Figs. 7D-H. GO enrichment analysis showed that biological processes ( BP ) such as fatty acid metabolic process, organic acid biosynthetic process, and response to peptide were significantly enriched, and molecular functions ( MF ) such as iron ion binding, oxidoreductase activity, and dioxygenase activity were significantly enriched. Focal adhesion, the apical part of cell, and cell − substrate junction were obviously enriched in cellular components ( CC ). KEGG enrichment analysis showed that DEFRGs were significantly enriched in the following pathways: Arachidonic acid metabolism, HIF − 1 signaling pathway, shear stress and atherosclerosis, and African trypanosomiasis, indicating that these diseases or pathways are related to DEFRGs. It indicates that DEFRGs may promote the development of bladder cancer and affect the overall survival of patients by acting on the HIF-1 signaling pathway.
Identification of Independent Prognostic Variables
Clinical features such as age, gender, TNM stage, grade, risk score, and smoking history were integrated to perform univariate and multivariate Cox regression analysis, the result is shown in Table 1. Univariate Cox regression indicated that the risk score, age, and TNM Stage of TCGA training cohort were intimately related to OS (p < 0.01). Multivariate Cox regression analysis further confirmed that the risk score and TNM Stage are the independent prognostic factors in TCGA training cohort( p < 0.05).
Table 1
Results of univariate Cox regression and multivariate Cox regression for clinical characteristics.
| Characteristics | Total(N) | Univariate analysis | | Multivariate analysis |
| Hazard ratio (95% CI) | P value | Hazard ratio (95% CI) | P value |
| RiskScore | 259 | 8.655 (4.188–17.890) | < 0.001 | | 6.379 (2.958–13.757) | < 0.001 |
| Age | 259 | 1.031 (1.011–1.050) | 0.002 | | 1.019 (0.999–1.039) | 0.068 |
| Gender | 259 | 0.811 (0.547–1.202) | 0.296 | | | |
| Grade | 259 | 3.587 (0.499–25.796) | 0.204 | | | |
| TNM Stage | 259 | 1.609 (1.269–2.039) | < 0.001 | | 1.379 (1.077–1.765) | 0.011 |
| Smoking | 259 | 1.361 (0.498–3.718) | 0.548 | | | |
Construction and Validation of the Nomogram in the TCGA Training Cohort
Based on risk score and TNM Stage, a nomogram was constructed to predict the 1-, 3-, and 5-year survival rates of patients( Fig. 8A). The time-dependent ROC curves indicated that AUC values were 0.72, 0.70, and 0.72 at 1st years, 3rd years, and 5th years(Fig. 8B). The calibration curves are close to the 45 ° line indicating the prominent prediction performance of the nomogram(Fig. 8C). The concordance index was 0.684(95% CI 0.656–0.711), which also manifested the excellent discriminative ability of the nomogram. Decision Curve Analysis ( DCA ) showed that the predictions of survival probability would be better than patients’ survival probabilities predicted by this prognostic risk model. The scopes of the threshold probability were between 1% and 50% at 1 year (Fig. 8D); between 1% and 78% at 3 years (Fig. 8E); and between 1% and 84% at 5 years (Fig. 8F), respectively.
Analysis of Immune Cell Infiltration
CIBERSORT was performed and the visualization result of 22 kinds of immune cells in each BC sample was shown in Fig. 9A. The comparison of the proportion of 22 immune cells between the high- and low-risk groups were shown in Fig. 9C. The abundance of T cells CD8 and T cells follicular helper in the high-risk group was significantly lower than that in the low-risk group ( p < 0.001 ). The abundance of Macrophages M0 in the high-risk group was significantly higher than that in the low-risk group ( p < 0.001 ). The abundance of Dendritic cells resting in the high-risk group was significantly lower than that in the low-risk group ( p < 0.05 ). The abundance of Mast cells activated in the high-risk group was significantly higher than that in the low-risk group ( p < 0.05 ). Applying Spearman rank correlation analysis to explore the relationship between 6 FRGs and immune cells(Fig. 9B). It was found that TRIM26 expression was positively correlated with the content of T cells follicular helper (Fig. 9D, p < 0.001 ), EGFR expression was positively correlated with the number of Neutrophils (Fig. 9F, p < 0.001 ), the amount of T cells regulatory(Tregs) was positively correlated with PTPN6 expression(Fig. 9E, p < 0.001 ) and was negatively correlated with expression of EGFR(Fig. 9G, p < 0.001 ), expression of PTPN6 and ISCU was weakly negatively correlated with the content of Macrophages M0 (Figs. 9H-I, p < 0.001 ).
ESTIMATE Score and TumorPurity
Utilizing the expression data to calculate the StromalScore, ImmuneScore, ESTIMATEScore, and TumorPurity of the sample. The ESTIMATEScore is the sum of StromalScore and ImmuneScore. The greater the ESTIMATEScore, the lower the TumorPurity, so the two values are negatively correlated. Analyzing the correlation between 6 FRGs and StromalScore, ImmuneScore, ESTIMATEScore, and TumorPurity(Fig. 10A). The results showed that the expression of PGRMC1 was positively correlated with TumorPurity (Fig. 10B, p < 0.001 ) and negatively correlated with ImmuneScore (Fig. 10C, p < 0.001 ). The risk score was positively correlated with StromalScore(Figs. 10D-E, p < 0.001) and negatively correlated with TumorPurity(Figs. 10F-G, p < 0.001).
Relationship Between Risk Score and Immunotherapy in Patients With Bladder Cancer
Integrating TCGA training and validation cohorts to predict the response of Immune checkpoint blockade (ICB) therapy in high- and low-risk groups using the Immune Cell Abundance Identifier website. Although the results showed that there was no significant statistical difference in ICB score and response to ICB treatment between high- and low-risk groups(Figs. 10H-I), the proportion of “Response” in the high-risk group was slightly higher than in the low-risk group. We further compared the expression levels of immunotherapy-related genes including PDCD1 and PDCD1LG2 between high- and low-risk groups(Figs. 10J-K). The results showed that the expression level of PDCD1 in the low-risk group was higher than that in the high-risk group (p < 0.05), and the expression level of PDCD1LG2 in the high-risk group was higher than that in the low-risk group ( p < 0.05 ). It is suggested that immunotherapy targeting PDCD1 encoded protein may be more effective in patients with low-risk BC in clinical work, while immunotherapy targeting PDCD1LG2 may be more effective in patients with high-risk BC.
Tumor Mutation Burden(TMB) Analysis
Out of 260 TCGA training cohorts, the results showed that 128 samples ( 49.23% ) had changed. Overall gene mutation analysis was first performed on 260 samples as shown in Fig. 11A. The top 10 genes were: TTN, TP53, MUC16, KMT2D, ARID1A, KDM6A, RB1, ERBB2, FAT4, SYNE1. 49% of the samples had TP53 mutations, 45% had TTN mutations, 30% had MUC16 mutations, etc. Among them, TTN, MUC16, BIRC6, and other genes have multiple mutations in a sample ( illustration Multi _ Hit ), the most common type of mutation is Missense Mutation. And then gene mutation differences between the high- and low-risk groups were compared. In the high-risk group, the median mutation burden was 2.84 / megabase. The median number of mutations per sample was 142. Graphical results were shown in Figs. 11B-D. In the low-risk group, the median of mutation burden was 2.68 / megabase. The median number of mutations per sample was 134. Graphical results were shown in Figs. 11E-G. The frequency and intensity of tumor gene mutations in the high-risk group were higher than those in the low-risk group, indicating that the high-risk group may be slightly better than the low-risk group for immunotherapy, which is accordant with the above prediction results of immunotherapy efficacy in Immune Cell Abundance Identifier website.
Difference of FRGs Expression in Tumor and Normal Tissues
We further explored the expression differences of FRGs in tumor tissues and normal tissues. The results showed that the expression of PTPN6, TRIM26, and FADS1 in tumor tissue was higher than in normal tissues, and the expression of ISCU in tumor tissue was lower than in normal tissues(Fig. 12A, p < 0.05), indicating that these four genes may be involved in the occurrence of BC. Furthermore, we got further validation in Human Protein Atlas ( HPA ) cohort(Fig. 12B). We used an online UALCAN website(http://ualcan.path.uab.edu/) to verify the differential expression of these four genes in tumor and normal tissues(Figs. 12D-G), and the results were consistent with our study.
Correlation of Ferroptosis-Related Risk Score With Clinical Characteristics
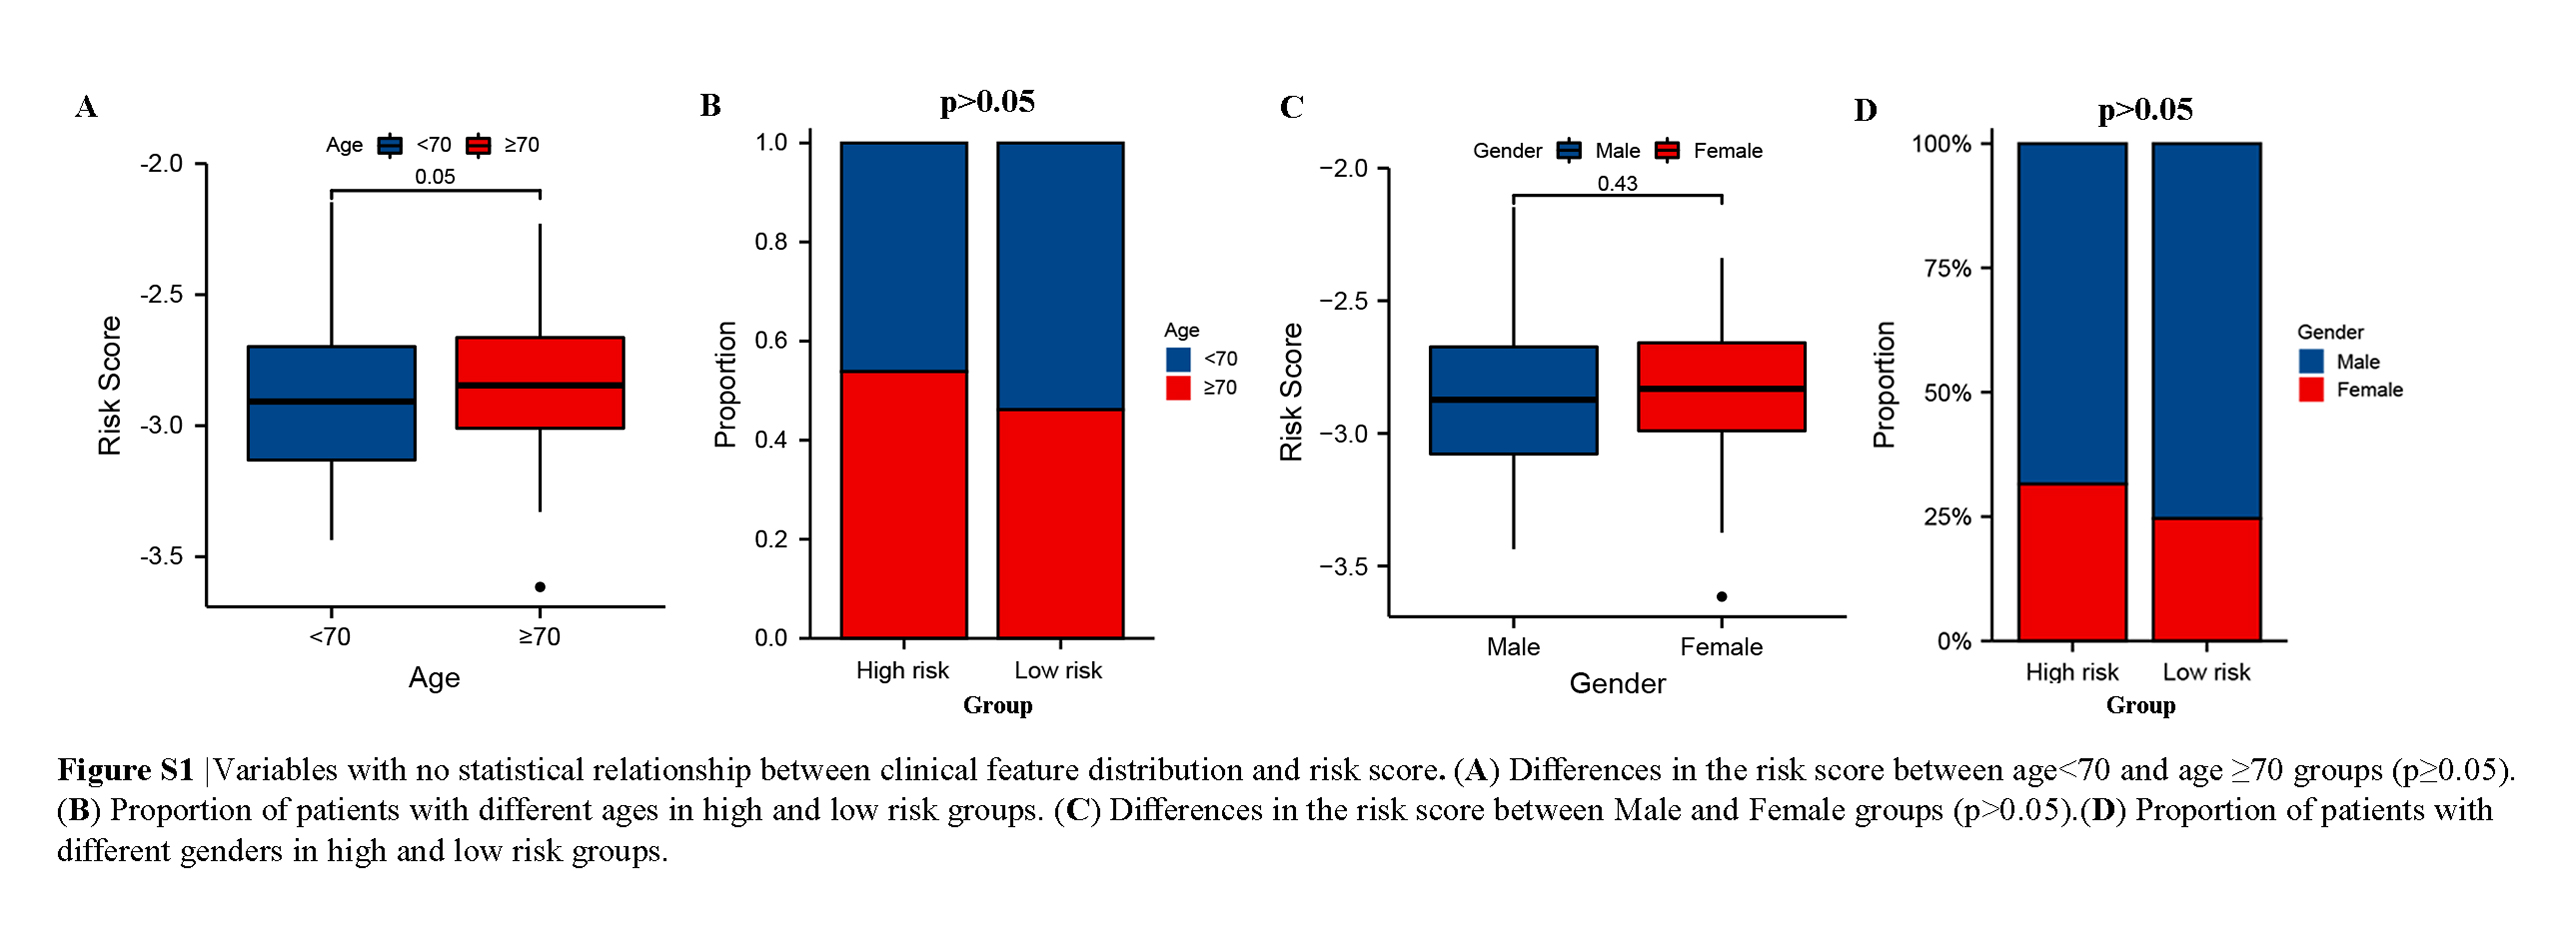
We investigated the interaction between the risk score and clinical features, and the results demonstrated that the risk score was conspicuously associated with the grade, TNM stage, and diagnosis subtype (p < 0.05) (Figs. 13A-J). Patients with later TNM Stage and higher grade have a higher risk, and the risk of Non-Papillary type is obviously higher than Papillary type, visualizing the distribution of clinical features in high- and low-risk groups by drawing a Sankey chart(Fig. 12C). However, the distribution differences of the risk score in age and gender were not statistically significant (p > 0.05)( Supplementary Figure S1). At the same time, the scatter distribution map was drawn to compare the difference in risk scores between patients with outcomes of Alive and Dead. The results manifested that the risk score in the Dead group was higher than that in the Alive group ( Figs. 13K-L, p < 0.001 ).
