Miniaturization of optical spectrometers is an active area of research because the demand for portable scientific and industrial characterization tools remains high.1-5 Furthermore, smartphones are ubiquitous devices that provide numerous applications and services. Recently, many efforts have focused on converting smartphone cameras into optical spectrometers for mobile food inspection6,7 beauty care8, health care9, and other applications10-14. In these cases, the image sensor of the smartphone detects optical signals from the object of interest—such as reflectance, fluorescence, and Raman emissions. Then, the smartphone’s application processor (AP) and communication chip can together perform on-device or cloud-linked analysis12, providing identification of specimens or evaluation of physical or chemical conditions.
Most research on smartphone-based spectrometers uses gratings as a dispersion component, assembled in an external optics module6-13 More recently, researchers have implement Fabry–Perrot filters15, photonic crystals16,17, metasurfaces18-20, and quantum dots21 on CCD or CMOS image sensors to transition from bulky conventional gratings. However, due to low Q-factors, these approaches have low spectral resolution and transmission, and require heavy use of numerical calculations to produce the desired spectra22 . Thus, experimental results in the literature have substantial limitations—especially in terms of capturing weak Raman signatures.
In this work, we demonstrate the feasibility of 2D Raman spectral barcodes as a means of identification. Traditionally, barcodes are machine-readable, optical labels that enable location, identification, and/or tracking. The 2D Raman spectral barcode is a Raman intensity map captured with an imaging sensor. The uncertainty-handling capability of artificial intelligence compensates for the fluctuations in intensity levels; together, the intensity map and intensity fluctuations serve as a barcode that provides the material identity.
To conveniently generate 2D Raman barcodes, we used a smartphone-based Raman spectrometer. We integrated a 2D periodic array of band-pass filters on the image sensor of a Samsung Galaxy Note 9, built a compact external smartphone-based Raman spectrometer module, and demonstrated 2D Raman-barcode-based drug classification at 785-nm wavelength. Each spectral barcode is a unique Raman signature of the material. We conducted identification with a convolutional neural network (CNN) embedded in the smartphone23. In addition, one can acquire an RGB image with another camera of the same smartphone to further enhance the identification accuracy.
Due to increasing online pharmacies and supply chain, counterfeit drugs have become threatening even to public health safety. As a demonstration, we experimentally investigated the Raman spectral barcodes of 54 commonly used popular drugs for diabetes, hyperlipidemia, hypertension, painkillers, and nutritional supplements; which frequently come in almost identical shapes, sizes, and colors. Utilizing the Raman spectral barcodes, we achieved a 99% drug-type-classification accuracy and 80% drug-brand-identification accuracy. By adding associated RGB images, we increased the prediction accuracy to 83.2%. We also correctly classified drugs that we did not include in the CNN training set but were in one of the drug categories listed previously; even in this case, the prediction accuracy for classifying drugs by category remained 99%. Our proposed concept of a CNN-powered spectral barcode will facilitate many research and business opportunities for smartphone spectrometers.
Smartphone Raman spectrometer and spectral barcode
Fig. 1 shows schematics of the smartphone Raman spectrometer and spectral barcode; which is the 2D Raman intensity map acquired with the smartphone Raman spectrometer, and an artificial intelligence algorithm embedded in the smart phone for classification. One collects and generates Raman signals by using a compact external module with a 785-nm laser diode. Periodic arrays of 128 filters on the CMOS image sensor of the smartphone capture the spectral information of the specimen. The array of 128 filters passes through 128 distinct wavelengths in the range of 830–910 nm. The spectral width and transmission rate of the band pass filters range from 1–1.2 nm and 0.45–0.6, respectively, which are sufficient to detect Raman emission when excited at 785 nm (Fig. S1). Black solid squares among the filters are metal blocks that serve as position indicators in the image. Each band pass filter consisted of a pair of Si/SiO2 distributed Bragg reflectors (DBRs), we set its resonant wavelength by adjusting the thickness of the Si layer in the center. The Methods and Fig. S1 show the details of the filter structure and fabrication. The Raman emission—collected with the attachable optical module—simultaneously illuminates several sets of 128 channels located near the center of the image sensor. The attachable optical module with a 785-nm laser diode excites and collects the resulting Raman emission. Fig. S2 shows a photograph of the miniaturized external Raman module attached to the rear-wide camera of the Samsung Galaxy Note 9, and its detailed optical configurations.
From the 2D image, one generates a unique spectral barcode pattern of the specimen, which contains the Raman information of the sample. The Methods explains the detailed process to convert a raw 2D Raman spectral image—acquired with smartphone spectrometers—to a spectral barcode, a unique spectral identifier. Analogous to conventional barcodes, our work introduces a new concept of symbology to map spectral information into a spectral barcode: a set of multiple wavelengths, physical positions, and continuously variable transmitted Raman intensities at given wavelengths after normalization. Our spectral barcodes can encode 1200 bits since 120 channels deliver different wavelength information and one pixel of the image sensor encodes 10 bits. This is comparable with conventional 2D barcodes, which can encode ca. 4000 bits depending on the symbology. One can enhance the capacity of the encoding information of the spectral barcode by increasing the number of channels. Fig. S3 shows examples of spectral barcodes of three drug pills that are similar in appearance: Glu-M SR for diabetes, Vitamin C 1000 mg Yuhan, and Tylenol 8-Hour ER. Whereas they have a virtually indistinguishable appearance, one can easily distinguish their Raman spectra—obtained with a commercial spectrometer as well as the corresponding Raman spectral barcodes obtained with our smartphone spectrometer. When comparing the Raman spectra obtained with the two tools, blue squares indicate the Raman peaks or major spectral components of each drug and the corresponding pixels in the Raman spectral barcode. Although the spectrum obtained with the smartphone Raman spectrometer exhibited a lower spectral resolution, it matched well with that of the commercial Raman spectrometer. The spectrum from the smartphone exhibited a slight shift in the peak locations (<1 nm), different relative peak intensities, and inter-peak spacing (Δλ) resulting from the spectral resolution. The full width at half maximum (FWHM) of the peaks corresponding to the C–O–C stretching bond at 861 nm and the C=C ring stretching bond at 903 nm of Vitamin C were 180% and 140% wider, respectively, than those obtained with the commercial Raman spectrometer. Nevertheless, the narrowly spaced Raman bands at 899 nm (aryl CC stretch) and 903 nm (C=O stretch) were still well-resolved. The FWHM at these corresponding bands ranged between 1 and 1.2 nm, and Δλ was <1 nm.
We demonstrated drug classification with a smartphone Raman spectrometer because this tool is important in healthcare; for example, when distinguishing counterfeit from legal drugs, or choosing the correct drug pill among similar-looking drug pills to prevent misuse. This issue becomes more critical since increasing the online pharmacies and supply chain can provide blind spots for counterfeit or substandard drugs to be distributed into public health market.14 Current smartphone applications (such as DrugID, ID My Pill, Pill Identifier, Pill Finder, and Drug Info) can distinguish drug types and models either by entering the name, shape, color, and/or etched marks of the drugs; or by comparing the drug pill’s RGB images (acquired with the camera) with the U.S. Food and Drug Administration database. The identification accuracy is insufficient due to similar appearance, absence in the database, or other technical issues.
To overcome these issues, Raman spectroscopy provides molecular fingerprints and is suitable for identifying drugs by their chemical compositions and functions. When combined with CNN, Raman spectroscopy becomes a powerful tool for predicting the major components of drugs and even their brand identities. We used RGB images as supplementary information to improve drug classification accuracy. One can complete the entire process, from the measurement (Raman spectral barcodes and RGB images) to the display of the results (types or brand names of the drugs), with a single device—by using the pre-embedded CNN algorithm in the smartphone’s AP. We chose the most widely prescribed drugs for three common diseases (hypertension, diabetes, and hyperlipidemia) and three over-the-counter medicines (vitamin B6, vitamin C, and acetaminophen) for drug classification. Fig. S4 shows the chemical structures of the major ingredients, and Table S1 shows the complete list of 58 drugs as well as their major components and RGB images. Medical professionals prescribe amlodipine, losartan, and valsartan for hypertension; glimepiride and metformin for diabetes; and atorvastatin, rosuvastatin, and simvastatin for hyperlipidemia. We used 54 drugs (1–54 in Table S1) to train and test the neural network, and four drugs (A1–A4 in Table S1) to validate the hypothesis that a CNN based on Raman spectral barcodes can properly recognize drugs that are not in the database. Fig. S4 shows reference Raman spectra measured with a commercial Raman spectrometer at 785-nm excitation. Raman spectra of the same component exhibited the same Raman peaks, whereas the intensity of the background was quite different; or even new Raman peaks were evident at 810, 825, and 830 nm due to the additives in the drugs (such as atorvastatin and simvastatin for hyperlipidemia; Fig. S4).
Spectral barcodes of 11 major components of drugs
Figure 2 shows representative spectral barcodes of 11 major components found in hypertension, diabetes, hyperlipidemia, and the other over-the-counter drugs. Spectral barcodes result from sharp Raman bands and broad fluorescence, which produce slightly different patterns. Most of the spectral barcodes are readily distinguishable; but in some cases, drugs with different major components (for example, amlodipine, losartan, and simvastatin) appear essentially the same yet one can distinguish them with a classification algorithm. We will discuss this point in a subsequent paragraph.
Encoding spectral barcode and data processing to analysis
Figure 3 shows acquisition of a spectral barcode. We added another CNN for RGB-image identification to improve the accuracy of drug classification. Among various classification algorithms such as Bayesian network, and support vector machine, we used a CNN with a simplified ResNet architecture23 to identify the major component of drugs (based on a common CNN structure, including e.g. AlexNet and VGGNet, and implemented a shortcut(add) skipping convolution).23 This CNN consisted of one conventional residual block of ResNet, consisting of a convolution layer with batch normalization, add, and ReLu (rectified linear unit); and two fully connected layers produced after flattening (one with batch normalization and ReLu, and the other with batch normalization and softmax). ReLu is a common activation function in deep learning algorithms and returns a max (0, input), which provides a threshold in various parameters generated during execution of the algorithm. The Methods describes details of the CNN architecture, training method, and database.
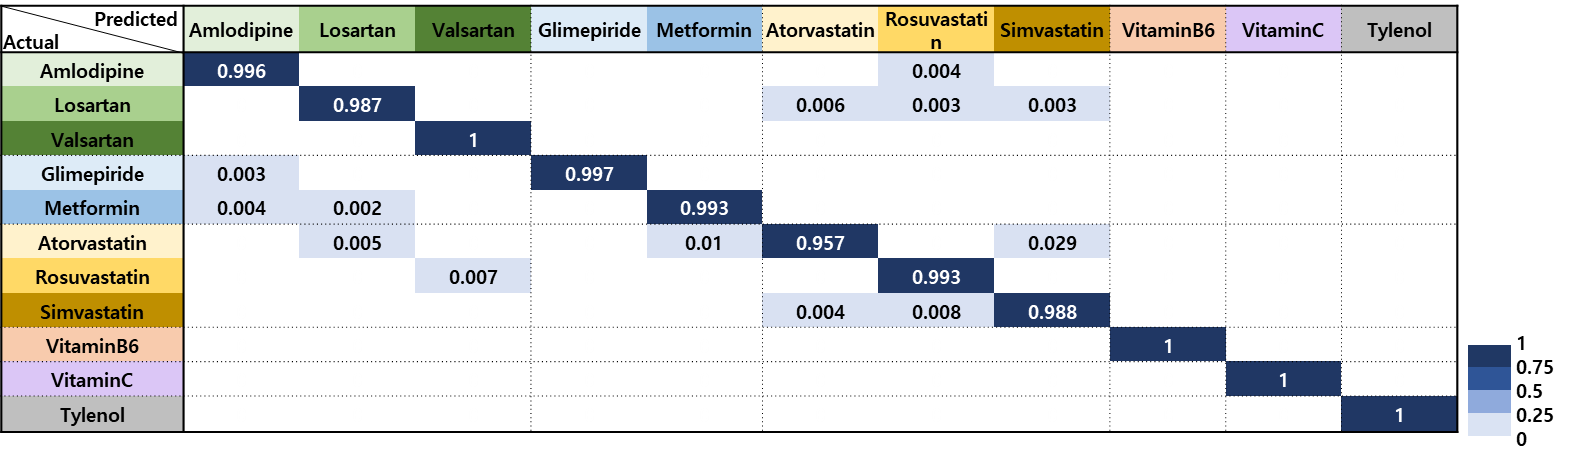
Confusion matrix for classifying the major component
Table 1 shows the confusion matrix for classifying the major chemical components of the drugs. The confusion matrix was for evaluating the performance in classification problems, comparing the actual class, and predicting the class with a classification algorithm. Diagonal and off-diagonal terms represent the correct and incorrect cases, respectively. Valsartan, vitamin B6, vitamin C, and Tylenol produced almost 100% accurate classification. The overall accuracy for 54 drugs major component was 99.1%. Additionally, we confirmed the expandability and effectiveness of the CNN for spectral barcodes by identifying four drugs that were not in the database (Glimel 3 mg, Dymit XR, Glucophase 1000 mg, and Metofol 500 mg). Even though these drugs are not in the database, we accurately predicted the major components from the spectral barcodes once the spectral barcode of the same major components were in the database. Regarding Dymit, Glucophase, and Metofol, another 11 drugs with the same major components (i.e., metformin) were in the database. Regarding Glimel, eight drugs with glimepiride were in the database.
CNN to identify the brand name of drugs
It might occasionally be necessary to identify the names as well as brands of drugs that are in the same drug group because brand-specific additives or coatings can affect the behavior in the body, such as speed of absorption or allergic reaction. Fig. 4 shows the spectral barcodes of three metformin drugs (Diabex 1000 mg, Dybis, and Glu-M SR) and their spectra. The squares of the same color indicate the Raman peaks and associated channels in the spectral barcodes. We observed higher fluorescence for Glu-M SR than Diabex yet the overall intensity was high in the spectral barcodes. To identify the brand name of each drug, we applied another CNN—simplified ResNet—followed by classification of the major component (Fig. 3). The architecture of the CNN for identifying the brand name was similar with that of the CNN for classifying the major component, except the size of the fully connected layers (since the size is related to the dimensions of the final result; i.e., the brand name of the drug). The accuracy in terms of classifying brand names remained outstanding: 79.5% (Table S2 shows the confusion matrix), since the additives or coatings provided increased fluorescence levels or additional Raman bands, which enhanced the distinguishability among drugs with the same major component. The accuracy of the CNN for differentiating one major component from the others was high, and thus misclassifying cases were most common among drugs with the same major components (Table S2).
The appearance of the drugs such as color and shape provides additional information for identification (Fig. 4). The RGB images exhibited a variety of shapes and colors (Table S1). We applied a CNN with a commonly used VGGNet architecture24,25 in conventional RGB imaging of drugs to recognize the shape (snowman, circle, ellipse, and pentagon/octagon) and color (blue, yellow, green, white, and pink) for higher recognition accuracy as well as brand name classification. We achieved classification by subsampling (i.e. reduced data size) with a convolution layer, fully connected layer, and Maxpooling; and used ReLu as an activation function. Table S3 and the Methods show the architecture of the CNN algorithm and the confusion matrix for the RGB images for classifying the shape and well as color. By additionally applying the CNN to RGB images of drugs as an auxiliary classification tool, the accuracy of identifying the exact brand name was slightly increased up to 83.2% (Table S4 shows the confusion matrix). We designed the final CNN (for predicting the brand name) to use the product of the outputs from both CNNs as a combined method, treating them with equal importance. One could further optimize the prediction accuracy by adjusting the output ratio between two types of CNNs. One could also use the imprinted marks on the drugs in conjunction with proper image processing, and further subdivisions of shape and color for appearance recognition with the RGB images.