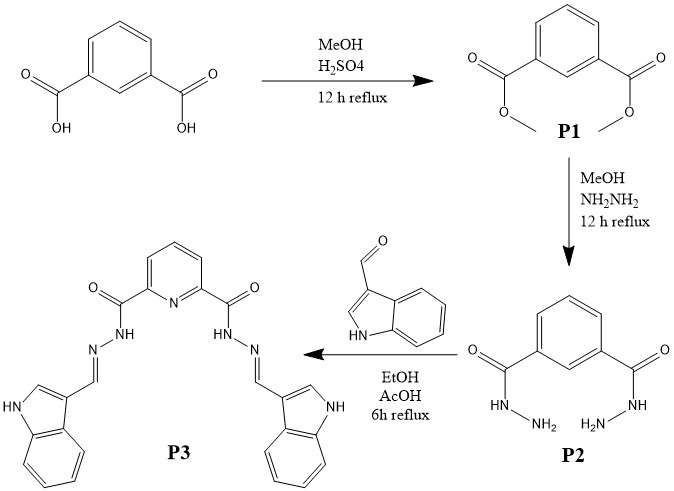
As indicated in Scheme 1, the cation receptor P3 was effectively synthesized. Accordingly, esterification of pyridine-2,6-dicarboxylic acid was accomplished by using 95% H2SO4 in methanol to form dimethyl pyridine-2,6-dicarboxylate P1. Next, the hydrazination of dimethyl Pyridine-2,6-dicarboxylate P1 to pyridine-2,6-dicarbohydrazide P2 was performed using hydrazine monohydrate in methanol. The reaction of pyridine-2,6-dicarbohydrazide P2 with indole-3-carboxaldehyde in acetic acid yielded the final product P3 (95% yield). The structure of receptor P3 was identified using spectral data, 1H NMR, 13C NMR, ESI+-MS, FT-IR, and elemental analyses. Descriptions of specific synthetic methods and the resulting spectral data can be seen in the experimental section.
3.1. Cation binding studies
The receptor's cation binding characteristics were examined using various cations in the form of their acetate salts (Ba2+, K+, Pb2+, Hg2+, Al3+, Fe2+, Zn2+, Tl+, Mg2+, Ni2+, Nd3+, Fe3+, Ag+, Ca2+, Cs+, Co2+, Cd2+, Sr2+, Mn2+ and Cu2+ ). Different spectral techniques, including fluorescence, UV–vis, 1H NMR, ESI+-MS, and\(\)FT-IR, were used to monitor the cation recognition process. The average value of each experiment was reported after being carried out triplicate.
3.2. Visual detection
The color change studies were carried out in a DMSO solution containing 20% water (v/v) with 5.0 × 10− 5 M receptor P3 solutions that interacted with the cations mentioned above. In the presence of Cu2+ cation, the addition of receptor P3 instantly changed the colorless solution to brown color. Copper complexation may have resulted in an intramolecular charge transfer that resulted in the dramatic color change [40]. However, the color of the receptor P3 did not change significantly when other cations were added (Fig. 1). The observed data indicate that the receptor is specific for copper ions.
3.3. UV–vis experiments
Absorption spectroscopy was used to investigate the sensing reaction of P3 in the presence and absence of various metal ions based on the colorimetric data. Without cations, receptor P3 displayed two absorbance bands at 263 nm and 340 nm. Internal charge transfer (ICT) might explain the band at 340 nm, and π → π* transition could explain the band at 260 nm [36, 41, 42] (Fig. 2). The characteristic UV–vis absorption changes were examined by adding acetate salts of Ba2+, K+, Pb2+, Hg2+, Al3+, Fe2+, Zn2+, Tl+, Mg2+, Ni2+, Nd3+, Fe3+, Ag+, Ca2+,Cs+, Co2+, Cd2+, Sr2+, Mn2+ and Cu2+ in DMSO solution containing 20% water (v/v). The addition of Cu2+ led to a 25 nm redshift from 340 nm to 365 nm and reduction of the intensity. The interaction of receptor P3 with Cu2+ ions led in a broad absorption band to the visible region of the spectrum and caused the color change.
The absorption titration was measured after adding 0–2.0 (Equiv.) copper (II) ions to the solution of receptor P3 (Fig. 3). The observed a redshift at 365 nm, a decrease in absorption intensity in the range of 290–360 nm, and an increase in absorption intensity in the 360–500 nm region are all shown in Fig. 3. The creation of a complex between the copper (II) ion and P3 is indicated by the isobestic point at 360 nm.
3.4. Fluorescence experiments
The capacity of receptor P3 to bind cations was investigated using fluorescence spectroscopy in DMSO/H2O (8:2, v/v) by exciting P3 at 340 nm and recording the emission spectrum in the range of 420–700 nm. The fluorescence spectrum was performed in a solution of free receptor P3 at λex = 340 nm which displayed two significant emission bands at 493 and 536 nm with a quantum yield (Фf) of 0.62 using fluorescein dissolved in 0.1 M NaOH (Φst = 0.79) as standard[43, 44]. In the recognition studies, several cations composed of acetate salts were employed (Fig. 4). The intensity of the fluorescence gradually decreases as the amount of Cu2+ is increased, and saturation in its quenching can be observed at [Cu2+]/[ P3] mole ratios greater than one (Fig. 5). Soft-soft metal interactions between Cu2+ and N atoms of the receptor P3 could explain the binding mechanism of P3 [45]. The involvement of amide, imine, and indole N atoms of P3 in forming the host-guest complex with the Cu2+ ions enhances the electron delocalization and molecular conjugation owing to the intramolecular charge transfer (ICT) process. Evidence of the (ICT) process for P3 includes a redshift in the absorption spectra, color change, and fluorescence quenching [40, 46–49].
Furthermore, other cations have not changed significantly their fluorescence intensity, indicating that they do not interact with the P3 receptor (Fig. 4). Job's plot results from the fluorescence titration experiment indicate a 1:2 binding stoichiometry between P3 and Cu2+. Using the Benesie-Hildebrand equation, the association constant (Ka) of P3 binding to metal ions was also calculated using the following formula [50, 51]:
$$\frac{1}{\text{F}-{\text{F}}_{0}}=\frac{1}{{\text{K}}_{\text{a}}({\text{F}}_{\text{m}\text{a}\text{x}}-{\text{F}}_{0}){\left[{\text{C}\text{u}}^{2+}\right]}^{2}}+\frac{1}{{\text{F}}_{\text{m}\text{a}\text{x}}-{\text{F}}_{0}}$$
Where F0 and Fmin indicate the fluorescence intensities of receptor P3 in the absence and presence of copper ion, respectively. Fmax denotes the maximum fluorescence intensity observed with P3, and [\({\text{C}\text{u}}^{2+}\)] indicates the concentration of\({\text{C}\text{u}}^{2+}\). The plot of 1/(F0 - Fmin) against 1/\({\left[{\text{C}\text{u}}^{2+}\right]}^{2}\) is linear, as illustrated in (Fig. 6). Using the results of fluorescence titration, the association constant (ka) of the P3-\({\text{C}\text{u}}^{2+}\)complex was calculated to be (2.9–3.5) ×1011 M−2. The fluorescence spectra of receptor P3 were examined repeatedly to determine the measurement's standard deviation. As a result, the limit of detection was calculated using the formula LOD = 3S/K, where S denotes the standard deviation of the blank solution and K denotes the slope of the fluorescence vs. \({\text{C}\text{u}}^{2+}\)concentration relationship (Fig. S12). The LOD was calculated to be ⁓ 4.2 ×10⁻⁹ M based on fluorescence titrations, which is substantially lower than the WHO recommended level of copper ion in drinking water [52].
3.5. Competitive cation titrations
P3 was tested in the presence of various cations to find out if it can sense Cu2+ selectively. The titrations data revealed that in the presence of most other cations, the fluorescence emission intensity of [P3 + Cu2+] is unaffected (Fig. 7), in agreement with the preceding investigation which established that other coexisting cations did not affect the detection of Cu2+ by P3 in DMSO/H2O (8:2 v/v). Even in the presence of other cations, the chelated complex [P3 + Cu2+] exhibits fluorescence quenching. All the findings are expected to be due to the good soft-soft interaction between Cu2+ and P3 nitrogen atoms, which confirms the results obtained from absorption, and fluorescence studies.
3.6. Binding mode of receptor P3 towards Cu2+ ion
The 1H NMR titration, FT-IR, and ESI+-MS techniques were used to investigate the interaction mechanism between receptor P3 and Cu2+ ion. The results of the 1H NMR titration experiment indicate a binding mode between the metal ion and the receptor molecule. This titration experiment was carried out using receptor (5×10− 2 M, in DMSO-d6) in various ion concentrations (0, 0.5, 1.0, 1.5, and 2.0 Equiv.) (Fig. 8). Upon addition of Cu2+ (2.0 Equiv.) to the solution of P3, amide and indole NH protons were broadened and shifted downfield from 12.1 to 12.6 and 11.6 to 12.2, respectively. The-N = CH protons were also broadened. Other peaks were slightly shifted up-field (approx. 0.03ppm). These spectra exhibited binding nature with Cu2+ ions in a 1:2 stoichiometric ratio; it also indicates that the nitrogen in amine, imine, and indole moiety participate in complexation with Cu2+ ions. Following that, when FT-IR spectral analysis is performed on the receptors P3 and P3-Cu2+, significant differences in their spectra are observed (Fig. 9). In the FT-IR spectrum of complex, the bands disappeared at 3413 (indole -NH), 3250, 3183 (-NH), 1675 and 1650 (-C = O), 1606 (-C = N), and the band at 1446 shifted to 1518 cm− 1, while new bands were observed at 3361, 1599, 1560, 998, and 947 cm− 1\(,\) that confirming the complexation of p3 with Cu2+ [37]. ESI-MS analysis was used to further confirm the 1:2 stoichiometry, in which the peak at m/z 467.4, 511.2, and 574.6 in the mass spectrum could be assigned to the mass of [P + H2O]+, [P + Cu2+− H+]+, [P + 2. Cu2+− H+]+ respectively (Fig. S13). The 1:2 stoichiometry between Cu2+ and the sensor was confirmed by all of these experiments. The fact that receptor P3 exhibits a selective and sensitive recognition affinity for Cu2+ ions is unsurprising given the receptor's relatively rigid binding pocket, which contains six NH (amide), NH (indole), and imine sites, allowing for the formation of a suitable complex with two copper ions.
3.7 Practical application
Suitable substrates for practical use include active materials-based test strips [53–55]. Therefore, the P3-based test strip was made by immersing filter paper in a DMSO solution of P3 (5.0 × 10− 4 M) and drying it in a vacuum. Relevant probe experiments were performed subsequently. The results showed that this protocol was implemented. Test strips containing P3 were used to detect various cations (5.0 × 10− 4 M), and the results revealed that only Cu2+ ion causes changes the color of the paper strip to brown (Fig. S14). In addition, when the test strips were immersed in copper solutions (DMSO/H2O (8:2, v/v)) with various concentrations for a few seconds, the paper strips color changed from light brown to dark brown with increasing the Cu2+ ion concentration as depicted in Fig. 10. Thus, the detection trace amounts of copper ions can be performed by the supplied test kits.
3.8 pH effect
The effects of pH on the fluorescence of the receptors P3 and P3-Cu2+ complex were tested in a DMSO solution containing 20% water (v/v).The solution's PH was altered using NaOH and HCl solutions (0.1 M). Receptor P3 shows weak fluorescence in the pH range of 1.0–4.5, as shown in (Fig. 11), due to the significant interference of \({\text{H}}^{+}\) ions. Receptor P3-Cu2+ did not display fluorescence performance in the pH range of 4.5–11.5, which indicated that receptor P3-Cu2+ possessed excellent acid and alkali-resistance at this range of pH, and P3 might be employed for ion measurement across a wide range of environmental and physiological circumstances.
3.9 Time of response
Time-dependent fluorescence spectrum modulations were examined to understand better the interaction of receptor P3 with copper ions (Fig. 12). Fluorescence intensity at 536 nm immediately decreased dramatically and the fluorescence intensity no longer changed and remained at its minimum. All the obtained results, the calculated association constant (2.9–3.5) ×1011 M− 2, and immediate response time can indicate a swift interaction and high affinity of the receptor P3 to copper ions.
3.10 Comparison
In order to show the advantages and limitations of the introduced receptor in this work, it was compared with some reported receptors in the literature (Table 1). Although all the receptors in Table 1 are effective, the receptor P3 exhibits some interesting advantages over other receptors towards Cu2+ ions. These promising sensing properties include turn-off fluorescence responses to Cu2+; high selectivity for Cu2+; lower LOD; high association constant; good applicability to test strips and sample testing; and operating in a wide range of pHs.
Table 1
Comparison of reported receptors and DPA-based probes for detecting the Cu2+ ions.
| Reference | LOD (M) | Association constant | Detection method (Cu2+) | pH | Application (yes or no) |
| [56] | 1.89 × \({10}^{-7 }\)M | 1.5 × \({10}^{6}\)\({\text{M}}^{-1}\) | Fluorescence, UV-vis | NR | Yes |
| [33] | 1.49 × \({10}^{- 6}\) M | 8.89 × \({10}^{3}\)\({\text{M}}^{-1}\) | Fluorescence, UV-vis | 4–10 | No |
| [35] | \(2.7\times {10}^{-7}\text{M}\) | 4.86 × \({10}^{4}\)\({\text{M}}^{-1}\) | Fluorescence, UV-vis | 4–9 | Yes |
| [36] | 1.978×\({10}^{-5}\) M | 3.11×\({10}^{5 }{\text{M}}^{-1}\) | Fluorescence, UV-vis | 4–8 | No |
| [41] | 5 \(\times {10}^{-9}\)M | 2.3 ×\({10}^{5 }{\text{M}}^{-1}\) | Fluorescence, UV-vis | NR | No |
| [46] | 1\(\times\) \({10}^{-7}\)M | NR | Fluorescence, UV-vis | NR | Yes |
| [49] | 1.2\(\times {10}^{-7}\) M | 9.08\(\times {10}^{4}{ \text{M}}^{-1}\) | UV-vis | NR | Yes |
| [57] | 4.5×\({10}^{-8}\)M | 9.9×\({10}^{9}\)\({\text{M}}^{-2}\) | Fluorescence | NR | Yes |
| [58] | 1.64 × \({10}^{-8 }\)M | 1.22 ×\({10}^{3}{\text{M}}^{-1}\) | Fluorescence | 3–11 | Yes |
| [59] | 1.82 ×\({10}^{-8 }\)M | 6.59 × \({10}^{5 }\)\({\text{M}}^{-1}\) | Fluorescence | NR | Yes |
| [60] | 0.69 \(\times {10}^{- 6}\) M | 6.47 ×\({10}^{4}\)\({\text{M}}^{-1}\) | Fluorescence, UV-vis | NR | Yes |
| [61] | 0.48 ×\({10}^{- 6}\) M | 6.045 × \({10}^{7}\)\({\text{M}}^{-2}\) | Fluorescence | 5–9 | Yes |
| This work | ⁓ 4.2 ×10− 9 M | (2.9–3.5) ×1011 M− 2 | Fluorescence, UV-vis | 4.5–11.5 | Yes |
| NR: Not reported |