This study aims to investigate spatiotemporal variability, trends, and anomaly in rainfall and temperature in the Sidama region, Ethiopia. The TerraClimate gridded dataset on a monthly time scale for 30 years (1991–2020) with a horizontal resolution of approximately 4 km was used for the study. Trends in annual and seasonal rainfall and temperature were assessed using a nonparametric test (Mann-Kendal test) and Sen’s slope, to test the statistical significance and magnitude of trends (increase/decrease), respectively. Our findings revealed that annual rainfall, summer (Hawado), and spring (Badhessa) rainfall have shown an increasing trend in most parts of the region, except for its northwest parts. We found a low annual rainfall variability (CV < 13%) over the southeastern and northwestern parts of the region. Rainfall variability revealed the difference in both time and space across the region. Six drought years (1999, 2001, 2002, 2003, 2012, and 2019) with different magnitudes were identified across the region. Annual average maximum (up to 0.4°C decade–1) and minimum (up to 0.25°C decade–1) temperatures revealed significantly increasing trends across the region. The standardized anomaly in the mean annual temperature indicated that the years in the recent decade (2011–2020) are getting warmer compared to the past two decades (1991–2010) due to climate change and other local and regional factors that cause weather extremes in the region. The results of this study for rainfall contradict the other studies in the rift valley part of the region. Therefore, we suggest the design and implementation of locally driven climate change adaptation strategies so that there is high rainfall and temperature variability across the region and between seasons.
Research Article
Spatiotemporal characteristics and trend analysis of rainfall and temperature in Sidama Regional State, Ethiopia
https://doi.org/10.21203/rs.3.rs-2443038/v1
This work is licensed under a CC BY 4.0 License
Journal Publication
published 27 Apr, 2023
Read the published version in Theoretical and Applied Climatology →
You are reading this latest preprint version
Climate change
Rainfall
Temperature
TerraClimate
anomalies
Sidama region
Human-induced climate change and variability are worldwide phenomena that have a detrimental effect on people's socioeconomic activities such as health, livelihood, and food security. Between 1850 and 2012, the global average temperature increased by 0.78°C (Esayas et al. 2018). The Intergovernmental Panel on Climate Change (IPCC) predictions indicated a 1.5°C to 2°C rises by the end of the 21st C (IPCC 2014). Several researchers have examined the historical trends of climate change and variability in Ethiopia. Recent studies, for example, discovered that the average annual maximum temperature rose by 0.2°C to 0.28°C per decade between 1960 and 2006 (Mekonnen et al. 2019). Similarly, the minimum temperature rose by 0.37°C per decade between 1951 and 2006 (Bogale and Tolossa 2021). The changing amount and intensity of rainfall over space and time is another feature of climate variability. Rainfall in Belg and Kiremt reduced by 15–20% across the country's southern, southwestern, and central parts (Belay et al. 2019). The annual and seasonal rainfall variability ranges between 50 and 80%, the average temperature rises at a rate of 0.37°C decade–1, and the maximum daily temperature has risen a total of 1.5°C since 1900 impacting food security, livelihoods, and health, and well-being, and other socioeconomic aspects of people (Belay et al. 2019; IPCC 2022).
Ethiopia is one of Africa's most vulnerable countries to climate change and variability that threaten people's lives and livelihoods (Matewos and Tefera 2020a). The uncertainty and ever-changing patterns of rainfall and temperature have caused unprecedented challenges to the rural poor in the country. Several empirical pieces of evidence reveal rainfall variability and temperature rise impact agricultural productivity, water availability, and biodiversity (Parry et al. 2009; Ripple et al. 2017; IPCC 2021). Rural livelihoods in Ethiopia, such as agriculture, pastoralism, and agropastoralism, are extremely sensitive to climate variability and change due to their close ties to the natural environment.
While agriculture contributes over 40% to the gross domestic product (GDP), generates about 85% of national export earnings, and employs 75% of the country’s workforce (Taffesse et al. 2013). Its productivity is closely linked with climate because of its rainfed characteristics. Thus changes in rainfall and temperature result in reductions in agricultural productivity impacting the country’s overall food security and socioeconomic status (Bezabih et al. 2014; Gleixner et al. 2017; Matewos 2019; Teshome and Zhang 2019). Although the association between cereals production and rainfall variability differs depending on the crop type, the correlation between the mean cereals production and rainfall variability is about 0.23 (Lewis 2017).
Aside from agriculture, the ever-changing conditions of rainfall and temperature will affect several sectors. Climate-related extremes have multidimensional consequences. Many of the impacts of climate change will emerge as changes in extreme weather events such as droughts and floods. Climatic extremes (such as droughts and flooding) have economic and social consequences for farmers' livelihoods as well as national economic growth (Weldearegay and Tedla 2018). Ethiopia has experienced numerous severe drought events over the last 40 years, including those in 1983–1985, 1988, 2000, 2002–2003, 2006, 2011, and 2015, with the 1983–1985 drought being the worst, affecting millions of poor rural farmers, pastoralists, and livestock (Alemayehu and Bewket 2017; Matewos 2019; Matewos and Tefera 2020a; Ayehu et al. 2021).
Although the susceptibility of the country's regions to climate change and variability is not markedly different, the impacts differ greatly across regions. Ethiopia's southern, eastern, northern, and north-eastern regions are identified as drought-prone and famine-affected (Webb and Von Braun 1990). Understanding the long-term trends and variability of climate over space and time in various regions is a critical step in obtaining the necessary details on how it has been changing and affecting the country's economy and development. Such data is critical for developing appropriate strategies to deal with current and future trends in climate variability and change (Abeje et al. 2019). The trend in climate change, i.e., the decline in rainfall and increase in temperature makes livestock rearing more viable than crop production (Godde et al. 2021). Several studies have been conducted to assess patterns of climate change and variability across Ethiopia; however, their conclusions on trends in rainfall based on location and season are inconsistent and mixed. For example, Alemayehu et al. (2020 and Mohammed et al. (2022) concluded that there are significantly increasing trends in rainfall. Gebrechorkos et al. (2019) briefed that there is a decreasing trend in annual rainfall in eastern (western) parts of Ethiopia. On the other hand, Matewos and Tefera (2020) found statistically significant decreasing trends in Belg rainfall in north-eastern Sidama. However, several studies have found that rainfall trends in many Ethiopian locations are uncertain.
Inconsistencies in previous findings could be attributed to the limited number of ground stations to represent the extensive area as well as the length and quality of rainfall and temperature data used for the studies. Using accurate and long-time series enables us to understand the complexity of local climate variables and develop appropriate policies and strategies to plan for agricultural productivity and ensure food security. However, depending on the topography and other biophysical factors, rainfall in Ethiopia varies along the localities, and results indicate high spatiotemporal variability at small distances. In this regard, using high-resolution gridded datasets such as Terraclimate is not optional.
Most of the previous studies in the Sidama region are limited to drought-prone districts such as Lokka Abbaya, Boricha, and Hawassa Zuria (Matewos 2019, 2020; Matewos and Tefera 2020b). These districts are by nature characterized as dry and hot and are categorized under lowlands (locally called kola). However, highlands and midlands in the region are not exceptions to the impacts of climate change. Besides, most of the previous studies explained rainfall in terms of inter-annual and inter-seasonal variability, trends, and seasonality. All of the previous studies except Matewos and Tefera (2020) used rainfall and temperature data from gauge stations that have several limitations. To address the limitations of previous research, this study used a gridded dataset to investigate the spatiotemporal characteristics of rainfall and temperature variability across different agroecologies of the entire region.
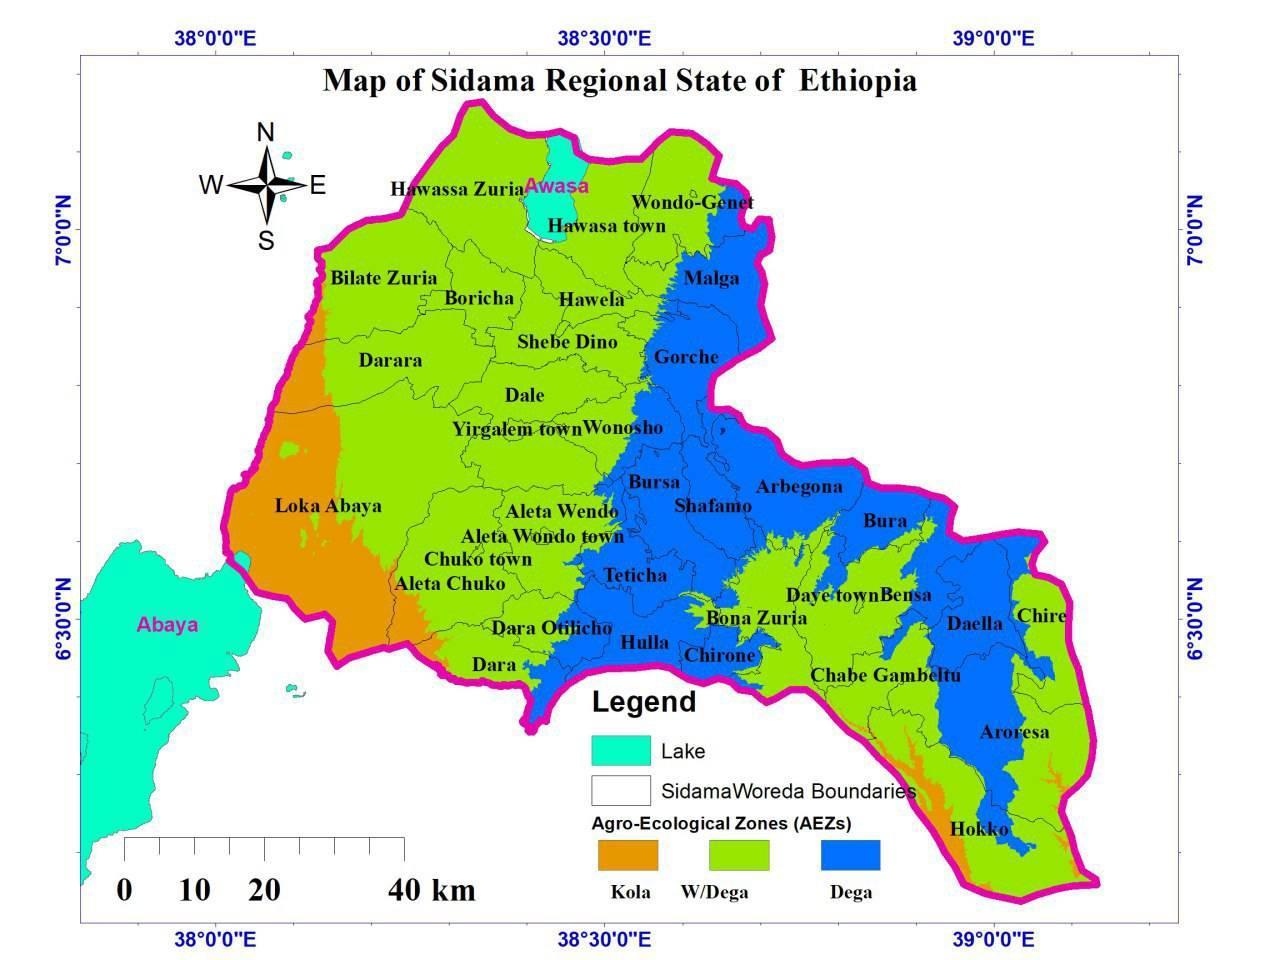
Sidama National Regional State (hereafter referred to as Sidama) is located between 5'45"- 6'45"N latitude and 38'00"- 39'20" E longitude (Fig. 1). It covers 6538 km2, with a human population of 3.4 million (Elbakidze et al. 2018). Sidama is bordered from north to southeast by the Oromia region, south by the Gedeo zone, and west by the Wolaita zone. The region has diverse biophysical conditions and rich cultural practices, and its current challenges are achieving food security given land shortage, rapid population growth, deforestation, loss of biodiversity, and climatic change. Sidama region is divided into 32 districts (Woredas).
The climatic conditions in Sidama range from hot and dry conditions in the lowland areas of Lokka Abaya to cold and humid alpine habitats in the highlands of Hula, Teticha, Bursa, Arbegona, Burra, Daeela, and Aroressa. The elevation of Sidama ranges from 1179 m.a.s.l over the northwestern part of the region to > 3127 m.a.s.l, mount Garamba (Elbakidze et al. 2018).
Sidama region grows many crops mainly in the agroforestry system. Given the diversity in elevation, the region follows mixed agricultural (crop and livestock production) practices. The major crops in the region are Enset (Ensete ventricosum), coffee, maize, barley, and wheat. Enset is one of the unexploited and less investigated crops in the region even though it is called the ‘tree against hunger’ because of its high tolerance to drought. Coffee is one of the major export crops in Ethiopia and Sidama coffee is one of the brands in the country. The effects of climate change on coffee are unclear as there have not been many studies in the region either on climate change and variability or the effects of these changes on coffee. As coffee plants need temperatures lower than 22°C higher temperatures would adversely affect coffee production in the region. The results of some studies stated that coffee will be forced to move to a higher altitude in long run owing to rising temperatures in low altitudes. Currently, this plant has been suffering the threat of being replaced by Khat, (Catha edulis) which is one of the cash crops in the region.
It roughly can be classified into five categories. Lowlands, less than 1500 m.a.s.l covers about 10% of the region, which is mainly located over the northwestern (Lokka Abaayya) part of the region. About 48% of the region is categorized as midlands (1500–2000 m.a.s.l). About 21% falls between 2000–2500 m.a.s.l and the next 21% is categorized between 2500–3000 m.a.s.l. The mountain of Garamba, which has a height of greater than 3000 m.a.s.l is found in the region as well.
3.1. Data sources and acquisition
This study used monthly, seasonal, and annual time series data for the last 30 years (1991–2020) downloaded from the TerraClimate website. We download and used precipitation and maximum and minimum temperatures from the dataset for this study. The dataset is of monthly climate for global terrestrial surfaces with 0.04° spatial resolution and is available from 1958 to the present (Abatzoglou et al. 2018). Details of TerraClimate products are provided in Abatzoglou et al. (2018).
3.2. Data analysis methods
The total annual rainfall time series was calculated from the monthly rainfall of the TerraClimate. Seasonal rainfall over the respective seasons was obtained by summing corresponding monthly rainfall. Non-parametric methods used to detect trend analysis include the Mann-Kendall test (Mann 1945; Kendall 1975) and Spearman’s rho test (Hamed 2016). Because parametric tests require meeting normal distribution assumptions, in this study a non-parametric (Mann-Kendall) test was used for detecting trends. Non-parametric tests are less sensitive to outliers and do not hold any distribution assumption (Yue et al. 2002).
Seasonal and annual trends in rainfall and temperature from 1991 to 2020 were used to explore homogeneous climatic regions of the study area. The trend in the seasonal and annual precipitation, as well as in the minimum and maximum temperature time series, were detected by fitting a linear regression model to each grid cell. The study used the Mann–Kendall (MK) test to assess the significance of the trends. The trends over each climatic region were extracted using a mask of a climatic region area. In this case, linear regression is computed as:
$$y\left(t\right)=a+\beta t$$
1
The slope β of the time series over each grid cell is calculated following the recommendation of Mann (1945) and Kendall (1975):
$$\beta =\frac{\frac{12}{\text{n}}\left({\sum }_{\text{n}=1}^{\text{N}}\left({\text{t}}_{\text{n}}{\text{x}}_{\text{n}}\right)-\frac{\text{N}+1}{2}{\sum }_{\text{n}=1}^{\text{N}}{\text{x}}_{\text{n}}\right)}{{\text{N}}^{2}-1}$$
2

Then the statistical significance of the trend in time series was assessed using the Mann-Kendal test (Mann 1945; Kendall 1975). The nonparametric test is chosen due to its resilience to outliers, non-normality, missing values, and seasonality (Helsel and Hirsch 2002; Borges et al. 2014). The statistics \(S\) of the MK test for the time series x is computed as a sum of the signs of the slopes (Rustum et al. 2017) which is given as:
$$S=\sum _{\text{i}=1}^{\text{n}-1}\sum _{\text{j}=\text{i}+1}^{\text{n}}\text{s}\text{g}\text{n}\left({\text{x}}_{\text{j}}-I\right)$$
3

Mann (1945) and Kendall (1975) noted that when \(n\ge 8\) the statistics \(S\) is approximately normally distributed with mean and variance V given as follows:
$$mean\left(\text{S}\right)=0$$
4
$$V\left(\text{S}\right)=\frac{\text{n}\left(\text{n}-1\right)\left(2\text{n}+5\right)-\sum _{\text{i}=1}^{\text{q}}{\text{p}}_{\text{i}}\left(\text{i}-1\right)\left(2\text{i}+5\right)}{18}$$
5
$$sgn\left({\text{x}}_{\text{j}}-{\text{x}}_{\text{i}}\right)=\left\{\begin{array}{c}1 if {\text{x}}_{\text{j}}-{\text{x}}_{\text{i}}>0\\ 0 if {\text{x}}_{\text{j}}-{\text{x}}_{\text{i}}=0\\ -1 if {\text{x}}_{\text{j}}-{\text{x}}_{\text{i}}<0\end{array}\right.$$
6

$${\text{Z}}_{\text{m}\text{k}}=\left\{\begin{array}{c}\frac{\text{S}-1}{\sqrt{V\left(S\right)}} S>0\\ 0 S=0\\ -\frac{\text{S}+1}{\sqrt{\text{V}\left(\text{S}\right)}} S<0\end{array} \right.$$
7

$$Se{\text{n}}^{{\prime }}s Slope=Median=\left\{\left.\frac{\left({\text{X}}_{\text{t}\text{n}}-{\text{X}}_{\text{t}\text{m}}\right)}{\left(\text{t}\text{n}-\text{t}\text{m}\right)} \right\}, \text{t}\text{n}>\text{t}\text{m}, \right.$$
8

The variability analysis was performed using the Coefficient of Variation (CV) which is the percentage departure of rainfall from the long-term mean. The variability analysis measures conditions of temperature and rainfall over the specified geographic area within the study time frame (1991–2020). CV is computed as:
$$C=\frac{\sigma }{\mu }x100 \left(9\right)$$
Where CV is the coefficient of variation; σ is the standard deviation and µ is the mean precipitation. According to Hare et al. (2020) and Samy et al. (2019), the variation of rainfall is classified as CV < 20, low variability, 20 < CV < 30, moderate variability; and CV > 30, high variability. In this regard, the coefficient of variation was calculated for each month of the years (1991–2020). Maximum and minimum rainfall was calculated along with its mean, standard deviation, Skewness, and Kurtosis. Eventually, from the obtained result, the coefficient of variation was calculated using Eq. 9 above.
All the above computations were performed using several packages provided in R-project (R Core Team 2018). The major packages that were used in this study were RASTER (Hijmans et al. 2022), and CMSAF (Kothe et al. 2019).
4.1. Annual and seasonal rainfall variability
Sidama region is characterized by a diverse climate, which ranges from dry and hot lowlands to wet and cold highlands. The area-averaged annual maximum temperature of the region is approximately 24.5°C, and it varies from 13°C to 34°C. The average annual precipitation in the region is about 1243 mm (Fig. 2). In the Central Rift Valley Region (CRVR) part of the Sidama region, Matewos and Tefera (2020b) found that annual rainfall is 1101.27 mm. The region receives rainfall for eight (7) months from April to October although there was a modest reduction in June. The region receives a high average monthly rainfall between July and October with the second season between April and June.
Figure 3 showed the spatial distribution of seasonal and monthly rainfall from 1991 to 2020 over the Sidama region. The rainfall starts in March in the central part of the region though the amount is less than 100 mm/month (see Annex 1). Most parts of the region receive rain during April and May with an increasing tendency toward the southern and southeastern parts of the region. These areas include the kebeles such as Teticha, Hula, Chirone, Dara, and Dara Otilicho in the southern tips of the region while Aroressa and Hokko (southeastern part) also receive the relatively optimum amount of rainfall during these months. The monthly rainfall amount reaches up to 200 mm in parts of the region during this period. In June, rainfall showed a decreasing pattern throughout the region and was limited only to central and southeastern highlands. Thus, the northwestern and southwest parts of the region such as Hawassa Zuria, Boricha, Darara, and Loka Abaya remain moisture deficient. Meanwhile, the results revealed that the rainfall increased and its distribution covered back the entire region starting from Mid of July to October. In Sidama, this season stays from July to October and it is locally called Hawado. Thus, during Hawado, the majority of the districts in the Sidama region receive modest rainfall except for Cabe Ganbeltu and Dara. Similarly, Matewos and Tefera (2020b) reported that the Kiremt season provided > 100mm/month rainfall consecutively for four months for the northwestern part of the region. The region received minimal (< 50 mm/month) rainfall between November and February, which is locally known as Arro are the regions located in the southeastern and northwestern. During this season, these areas receive limited precipitation. The region received rainfall in two seasons, Badheessa (March, April, and May) and Hawado (June, July, August, September, and October) (Fig. 3). The dry (Arro) season extends from November to February. Following conventional seasonal classification does not reflect the region’s reality because rainfall extends from March to October almost without any jump between. Therefore, we classified only into two: from March to May as Badheessa and Hawado between June to October.
Regarding zonal (rainfall values in latitude wise) precipitation distribution in the region, high precipitation (200 mm/month) was received between August and September in areas located between 6.4 and 6.8 North latitudes (e.g., Daarra, Hula, Teticha, Shafamo, and Arbegona). It also revealed a slight weakening of the amount of rainfall during November. This result revealed that the northern part of the region receives rainfall from only June to September (Fig. 4). Meridionally, the central highlands (e.g., Arbegona, Bursa, Hula) of the region received rainfall for a longer period than the eastern and western parts of the region. For example, between 32.4 east and 38.8 east, the region received rainfall from April to October (Fig. 4). However, the western and eastern edges of the region received maximal rainfall for a shorter period (July to September) compared with central longitudes. Eventually, rainfall stays longer in the southern part of the region (lower latitude) compared to its northern part. An area located between 38.6° East and 6.6° North was identified as the wettest in the region. These are the areas that receive the most rainfall over the course of the year. According to these results Bursa, Arbegona and Hula receive higher rainfall for a longer period compared with other kebeles in the region, yet verification using ground stations was not possible because stations with long-time climate data series are missing in these areas. Moreover, the region lacks similar studies to compare our results with.
The mean annual rainfall of the region is 1244 mm/year for 1991–2020. The mean for the dry northeastern part of the region, for example, Lokka Abaya, Boricha, and Hawassa Zuria reported having 1101.27 mm/year for 1983–2014 (Matewos and Tefera, 2020b). It is found that the central and eastern highlands receive up to 1700 mm/year from 1991–2020. The region receives an annual rainfall ranging from 800 to 1800 mm (Figure. 5). The distribution of annual rainfall over the region has shown local characteristics. Annual rainfall gradients corresponding to latitude/longitude values respective to each pixel were estimated for the region. The maximum and strong rainfall gradients are oriented along with the central and southern tips of the region which receives total annual rainfall exceeding 1700 mm (Fig. 5). Western and south-and north-eastern margins of the region receive the lowest total annual rainfall from 1991 to 2020.
4.2. Precipitation trends and anomalies
The annual rainfall anomalies presented in Fig. 6 revealed that there were variations in the amount of rainfall spatiotemporally. Many areas in the region have received lower than long-term average annual rainfall in 1991, 1994, 1995, 1999, 2001, 2002, 2003, 2012, and 2019. However, in 1992, 1993, 1997, 1998, 2005, 2006, 2008, 2011, 2014, 2016, and 2020 many places in the region received higher than long-term annual average rainfall. However, the years 1991, 1999, and 2002 were identified as the driest years recorded in the region. In 2016 and 2020 the region received extremely high rainfall, particularly in the northern and northwestern parts. However, annual rainfall in the remaining years showed a slight deviation from the long-term mean, which indicates the region had received nearly normal annual rainfall distribution during these years. These findings are consistent with other studies in the northeastern part of the region conducted by Matewos and Tefera (2020b), who identified 1999 and 2012 as severe drought years. High inter-annual rainfall variability, combined with precipitation deficit, resulted in long-term drought in several areas. Many studies on climate change noted that Ethiopia has experienced eight major droughts since 1980: in 1984, 1987, 1991, 1994, 1999 2002, 2012, and 2015 (Seleshi and Zanke 2004; Suryabhagavan 2017; Matewos and Tefera 2020a). Additionally, the year 2019 can be categorized as a drought year, particularly in our study area. On the contrary, few regions received rainfall having high regional variability exceeding the long-term mean which caused flash flooding in 2005, 2006, 2016, and 2020.
Figure 7 showed monotonic trends in annual and seasonal rainfall per pixel over the region and stipples on the plot indicate trend significances at P < 0.05. The mean annual rainfall over the region showed positive trends across the region with values ranging from 20 mm to 60 mm per decade. According to the findings, the annual pattern of rainfall revealed only a significant increasing trend (ranging from 20 to 60 mm decade–1) over the southeastern (Aroressa and Hokko) and southwestern (Darra) parts of the region. At the same time, rainfall data from the Hawassa weather station showed a tendency of increasing trend (18 mm decade–1) although the trend is not statistically significant during the study period (Ware et al. 2022). Similar to these results, Ayehu et al. (2021) reported increasing trends in annual (2.48 mm year− 1), summer (1.16 mm year− 1), spring (0.92 mm year− 1), and autumn (0.67 mm year− 1) rainfall and decreasing trend in the winter season (-0.15 mm year− 1) over the Upper Blue Nile area. Moreover, Alemayehu et al. (2020) reported statistically significant increasing trends in annual and Bega rainfall and a non-significant increasing trend in Belg in the Alwero watershed, western Ethiopia. On the contrary, Matewos and Tefera (2020b) found decreasing trends in annual, Kiremt, and Belg rainfall over the CRVR although it is statistically significant only in Belg. Besides, Belihu et al. (2018) reported significantly decreasing trends in annual rainfall in the Gidabo catchment in the Sidama region.
Seasonal trend analysis shows a non-significant (except for small areas) increasing trend in rainfall during both Kiremt (Hawado) and Belg (Badhesa) seasons in the region. Only the Hawado season revealed a significant increase in rainfall in the region's northwestern and south-eastern regions. However, we discovered a decreasing trend in the Arro (NDJF) season across the central and northern parts of the region, with only a few areas of the northern tip of Hawasa Zuria showing a statistically significant trend during this season. Unlike this result, a non-significant increasing trend is reported by Matewos and Tefera (2020b) during the season over the Central Rift Valley part of the region.
The spatial and temporal variability in annual and seasonal rainfall is assessed using a coefficient variation (CV). The CV for over 30 years (1991 to 2020) indicates that the variability in seasonal rainfall is much higher than that of annual rainfall variability (Fig. 8). The CV in annual rainfall ranges from 6 to 13% and in seasonal rainfall from 12 to 65%. The seasonal rainfall variability showed the CV ranging from 12 to 18%, 23 to 30%, and 50 to 63% for the Hawado, Badhessa, and Arro seasons, respectively (Fig. 8). The highest seasonal variability was observed in the Arro season and it is the most significant contributor to annual rainfall variability. As the finding of Matewos and Tefera (2020b) showed the CV in the Bega rainfall is 35%, which is higher compared to annual (13%), and Kiremt and Belg account for 23% of each in the CRVR.
4.3. Annual and seasonal temperature variations
The overall temperature of the region ranges between 8–28°C (Fig. 9). Northwestern parts of the region are hotter compared with the central and southeastern parts of the region. Regarding seasonalities in the temperature, January to May was hotter relative to June to August, which is colder in over the lowlands. The average temperature over the central Sidama highlands was less than 20°C throughout the year.
4.4. Trends in annual minimum and maximum temperature
Figure 10 shows the decadal monotonic trend in maximum and minimum temperatures (°C decade–1) significantly increased during the last three decades (1991–2020). Similarly, Matewos (2019) reported significantly increasing trends in temperature over the northeastern parts of the Sidama region. Our results revealed significantly increasing trends in both minimum and maximum temperatures across the region. However, the southeastern part of the region experiences higher temperature incidences much faster than the rest of the region, which is probably due to the alarming conversion of forest areas into agriculture, particularly in Aroressa, Chirre, Daeela, Gambeltu, and surrounding areas. Meanwhile, Hamesso (2018) conducted a survey study in three districts from different agroecological zones and concluded that the majority of respondents reported a reduction in rainfall and a rise in temperature. For the Gidabo catchment of the Sidama region, Belihu et al. (2018)found the Gidabo catchment is getting warmer from 0.03°C to 0.07°C year–1, which is similar to our finds. Additionally, the national climate change adaptation program of action (NAPA) states that the mean temperature has been increasing by about 0.37°C decad–1 (NMA 2007).
4.5. Anomalies in annual mean temperature
The mean temperature anomaly in the region indicated that the years are getting hotter from time to time. Most of the years in the first decade (1991–2000) were colder than the long-term mean for 1991–2020. The year 2019 was the hottest compared to the years considered for this study. The frequency of having hot years increases from time to time. These results go hand in hand with the rising global temperature (Hansen et al. 2006). As temperature anomaly refers to a departure from a reference value or long-term average, in this study the latter was applied. The positive anomaly indicated that the respective year is hotter than the long-term mean. On the other hand, the negative (blue colors) in Fig. 11 indicates years colder than the long-term mean. Therefore, the years 1992, 1993, 1994, and 1999 were considerably colder than the long-term mean during the study time. However, the years 2002, 2006, 2009, 2010, 2011, 2015, 2016, 2017, 2019, and 2020 were hotter than the long-term mean temperature of the region. This is probably due to the fact that changing climate leads to significant increases in temperature extremes (Esayas et al. 2018). Meanwhile, the number of cold days and nights is significantly decreased across all agroecologies in Southern Ethiopia (Esayas et al. 2018) eventually this leads to higher annual mean temperature compared to its long-term mean.
In this study, we investigated spatiotemporal variability and trends in both rainfall and temperature in the Sidama region of Ethiopia during 1991–2020. Based on our key findings we can conclude that the region segregates into three rainfall seasons of which the main rainy season (Hawado) contributes the largest to the annual rainfall for the region having less variability compared to the other two seasons. Hawado rainfall showed statistically increasing trends over the western and southeastern parts of the region. The region received less than the long-term average rainfall in 1991, 1994, 1995, 1999, 2001, 2002, 2003, 2012, and 2019, which means these years refer to the region’s drought incidences in different magnitudes. Findings of the annual, Badhesa, and Hawado rainfall trends show statistically non-significant increasing trends across most parts of the region. These results contradict the findings of the previous studies (e.g., Seleshi and Zanke 2004; NMA 2007; Wagesho et al. 2013; Alemayehu and Bewket 2017; Belihu et al. 2018; Matewos 2019; Matewos and Tefera 2020a; Mohammed et al. 2022) who reported significantly declining rainfall trends in Rifty valley part of the region. The possible source for these contradictions is differences in data sources and study locations, we attempted to evaluate this using other data sources (not shown).
The mean annual maximum and minimum temperatures show warming trends across the region for 1991–2020. The rate at which the maximum temperature change is higher over the eastern part of the region compared to their western counterparts. The annual minimum temperature also significantly increased (up to 0.26°C decade–1) over the region during the study period. There is a considerable difference in rainfall variability across the region by season with high variability (CV up to 63%) in the Arro season. As trends in temperature have shown a significant increase during the past three decades and with a quite variable nature of rainfall, the overall situation requires close monitoring of government and other stakeholders as the region is one of the hubs for agricultural products such as coffee. As the variability and trends in climatic variables are localized, local-level studies like this are required for making agricultural decisions and planning for water and climate change adaptation options. Therefore, localized policy interventions are vital to mitigate upcoming climate-change-induced disasters’ impacts on the socioeconomic activities of the smallholders in the region.
Acknowledgments: We are grateful for the University of Idaho’s Northwest Knowledge Network providing data for this study.
Funding The authors declare that no funds and grants were received from any organization for the submitted work.
Author contribution MBW contributed to the study's conceptualization, design, data collection, analysis, writing—first draft, and writing—review and editing. MG contributed to the writing of the first draft, review, and editing. TM, AL, and YM have reviewed and commented on the first draft of the manuscript. All authors read and approved the final version of the manuscript.
Data availability The datasets used in this study are freely available in the University of Idaho’s Northwest Knowledge Network, repository at http://thredds.northwestknowledge.net:8080/thredds/terraclimate_catalog.html
Code availability R codes are available from the first author upon reasonable request.
Ethics approval The authors declare that this submission follows the journal's policies as described in the Guidelines for Authors and the Ethics Statement.
Competing interests The authors declare no competing interests.
Consent to participate Not applicable
Consent for publication Not applicable
- Abatzoglou JT, Dobrowski SZ, Parks SA, Hegewisch KC (2018) TerraClimate, a high-resolution global dataset of monthly climate and climatic water balance from 1958–2015. Scientific Data 5:170191. https://doi.org/10.1038/sdata.2017.191
- Abeje MT, Tsunekawa A, Haregeweyn N, et al (2019) Communities’ Livelihood Vulnerability to Climate Variability in Ethiopia. Sustainability 11:6302. https://doi.org/10.3390/su11226302
- Addisu Climate change effects on coffee production
- Alemayehu A, Bewket W (2017) Local spatiotemporal variability and trends in rainfall and temperature in the central highlands of Ethiopia. Geografiska Annaler: Series A, Physical Geography 99:85–101. https://doi.org/10.1080/04353676.2017.1289460
- Alemayehu A, Maru M, Bewket W, Assen M (2020) Spatiotemporal variability and trends in rainfall and temperature in Alwero watershed, western Ethiopia. Environ Syst Res 9:22. https://doi.org/10.1186/s40068-020-00184-3
- Ayehu GT, Tadesse T, Gessesse B (2021) Spatial and temporal trends and variability of rainfall using long-term satellite product over the Upper Blue Nile Basin in Ethiopia. Remote Sens Earth Syst Sci 4:199–215. https://doi.org/10.1007/s41976-021-00060-3
- Belay AS, Fenta AA, Yenehun A, et al (2019) Evaluation and Application of Multi-Source Satellite Rainfall Product CHIRPS to Assess Spatio-Temporal Rainfall Variability on Data-Sparse Western Margins of Ethiopian Highlands. Remote Sensing 11:2688. https://doi.org/10.3390/rs11222688
- Belihu M, Abate B, Tekleab S, Bewket W (2018) Hydro-meteorological trends in the Gidabo catchment of the Rift Valley Lakes Basin of Ethiopia. Physics and Chemistry of the Earth, Parts A/B/C 104:84–101. https://doi.org/10.1016/j.pce.2017.10.002
- Bezabih M, Di Falco S, Mekonnen A (2014) On the Impact of Weather Variability and Climate Change on Agriculture:: Evidence from Ethiopia. Environment for Development Initiative
- Bogale GA, Tolossa TT (2021) Climate change intensification impacts and challenges of invasive species and adaptation measures in Eastern Ethiopia. Sustainable Environment 7:1875555. https://doi.org/10.1080/23311843.2021.1875555
- Borges P de A, Franke J, do Santos Silva FD, et al (2014) Differences between two climatological periods (2001–2010 vs. 1971–2000) and trend analysis of temperature and precipitation in Central Brazil. Theor Appl Climatol 116:191–202. https://doi.org/10.1007/s00704-013-0947-4
- Elbakidze M, Gebrehiwot M, Angelstam P, et al (2018) Defining Priority Land Covers that Secure the Livelihoods of Urban and Rural People in Ethiopia: a Case Study Based on Citizens’ Preferences. Sustainability 10:1701. https://doi.org/10.3390/su10061701
- Esayas B, Simane B, Teferi E, et al (2018) Trends in Extreme Climate Events over Three Agroecological Zones of Southern Ethiopia. Advances in Meteorology 2018:1–17. https://doi.org/10.1155/2018/7354157
- Gebrechorkos SH, Hülsmann S, Bernhofer C (2019) Long-term trends in rainfall and temperature using high-resolution climate datasets in East Africa. Sci Rep 9:11376. https://doi.org/10.1038/s41598-019-47933-8
- Gleixner S, Keenlyside N, Viste E, Korecha D (2017) The El Niño effect on Ethiopian summer rainfall. Clim Dyn 49:1865–1883. https://doi.org/10.1007/s00382-016-3421-z
- Godde CM, Mason-D’Croz D, Mayberry DE, et al (2021) Impacts of climate change on the livestock food supply chain; a review of the evidence. Global Food Security 28:100488. https://doi.org/10.1016/j.gfs.2020.100488
- Hamed KH (2016) The distribution of Spearman’s rho trend statistic for persistent hydrologic data. Hydrological Sciences Journal 61:214–223. https://doi.org/10.1080/02626667.2014.968573
- Hansen J, Sato M, Ruedy R, et al (2006) Global temperature change. Proceedings of the National Academy of Sciences 103:14288–14293. https://doi.org/10.1073/pnas.0606291103
- Helsel DR, Hirsch RM (2002) Statistical methods in water resources. U.S. Geological Survey, Reston, VA
- Hijmans RJ, Etten J van, Sumner M, et al (2022) raster: Geographic Data Analysis and Modeling
- IPCC (2022) Climate Change 2022: Impacts, Adaptation and Vulnerability. Contribution of Working Group II to the Sixth Assessment Report of the Intergovernmental Panel on Climate Change. Cambridge University Press, Cambridge University Press, Cambridge, UK and New York, NY, USA
- IPCC (2021) Summary for Policymakers. In: Climate Change 2021: The Physical Science Basis. Contribution of Working Group I to the Sixth Assessment Report of the Intergovernmental Panel on Climate Change [
- IPCC (ed) (2014) Climate Change 2013 - The Physical Science Basis: Working Group I Contribution to the Fifth Assessment Report of the Intergovernmental Panel on Climate Change. Cambridge University Press, Cambridge
- Kendall SB (1975) Enhancement of Conditioned Reinforcement by Uncertainty1. Journal of the Experimental Analysis of Behavior 24:311–314. https://doi.org/10.1901/jeab.1975.24-311
- Kothe S, Hollmann R, Pfeifroth U, et al (2019) The CM SAF R Toolbox—A Tool for the Easy Usage of Satellite-Based Climate Data in NetCDF Format. IJGI 8:109. https://doi.org/10.3390/ijgi8030109
- Lewis K (2017) Understanding climate as a driver of food insecurity in Ethiopia. Climatic Change 144:317–328. https://doi.org/10.1007/s10584-017-2036-7
- Liou Y-A, Mulualem GM (2019) Spatiotemporal Assessment of Drought in Ethiopia and the Impact of Recent Intense Droughts. Remote Sensing 11:1828. https://doi.org/10.3390/rs11151828
- Mann HB (1945) Nonparametric Tests Against Trend. Econometrica 13:245–259. https://doi.org/10.2307/1907187
- Matewos T (2019) Climate Change-Induced Impacts on Smallholder Farmers in Selected Districts of Sidama, Southern Ethiopia. Climate 7:70. https://doi.org/10.3390/cli7050070
- Matewos T (2020) The state of local adaptive capacity to climate change in drought-prone districts of rural Sidama, southern Ethiopia. Climate Risk Management 27:100209. https://doi.org/10.1016/j.crm.2019.100209
- Matewos T, Tefera T (2020a) Local level rainfall and temperature variability in drought-prone districts of rural Sidama, central rift valley region of Ethiopia. Physical Geography 41:36–53. https://doi.org/10.1080/02723646.2019.1625850
- Matewos T, Tefera T (2020b) Local level rainfall and temperature variability in drought-prone districts of rural Sidama, central rift valley region of Ethiopia. Physical Geography 41:36–53. https://doi.org/10.1080/02723646.2019.1625850
- Mekonnen ZA, Riley WJ, Randerson JT, et al (2019) Expansion of high-latitude deciduous forests driven by interactions between climate warming and fire. Nat Plants 5:952–958. https://doi.org/10.1038/s41477-019-0495-8
- Mohammed JA, Gashaw T, Worku Tefera G, et al (2022) Changes in observed rainfall and temperature extremes in the Upper Blue Nile Basin of Ethiopia. Weather and Climate Extremes 37:100468. https://doi.org/10.1016/j.wace.2022.100468
- NMA (2007) Ethiopia National Programme of Action (NAPA) Official Document - June 2007 | UNDP Climate Change Adaptation. https://www.adaptation-undp.org/resources/assessments-and-background-documents/ethiopia-national-programme-action-napa-official. Accessed 29 Apr 2020
- Parry M, Evans A, Rosegrant MW, Wheeler T (2009) CLIMATE CHANGE AND HUNGER Responding to the Challenge
- R Core Team (2018) R: A language and environment for statistical computing. R Foundation for Statistical Computing, Vienna, Austria. URL https://www.R-project.org/.
- Ripple WJ, Wolf C, Newsome TM, et al (2017) World Scientists’ Warning to Humanity: A Second Notice. BioScience 67:1026–1028. https://doi.org/10.1093/biosci/bix125
- Rustum R, Adeloye AJ, Mwale F (2017) Spatial and temporal Trend Analysis of Long Term rainfall records in data-poor catchments with missing data, a case study of Lower Shire floodplain in Malawi for the Period 1953–2010. Global hydrology/Stochastic approaches
- Seleshi Y, Zanke U (2004) Recent changes in rainfall and rainy days in Ethiopia. International Journal of Climatology 24:973–983. https://doi.org/10.1002/joc.1052
- Sen PK (1968) Estimates of the Regression Coefficient Based on Kendall’s Tau. Journal of the American Statistical Association 63:1379–1389. https://doi.org/10.1080/01621459.1968.10480934
- Suryabhagavan KV (2017) GIS-based climate variability and drought characterization in Ethiopia over three decades. Weather and Climate Extremes 15:11–23. https://doi.org/10.1016/j.wace.2016.11.005
- Taffesse AS, Dorosh P, Gemessa SA (2013) 3 Crop Production in Ethiopia: Regional Patterns and Trends. In: Dorosh P, Rashid S (eds) Food and Agriculture in Ethiopia. University of Pennsylvania Press, Philadelphia
- Teshome A, Zhang J (2019) Increase of Extreme Drought over Ethiopia under Climate Warming. In: Advances in Meteorology. https://www.hindawi.com/journals/amete/2019/5235429/. Accessed 5 Jan 2021
- Wagesho N, Goel NK, Jain MK (2013) Temporal and spatial variability of annual and seasonal rainfall over Ethiopia. Hydrological Sciences Journal 58:354–373. https://doi.org/10.1080/02626667.2012.754543
- Ware MB, Mori P, Warrach-Sagi K, et al (2022) Climate regionalization using objective multivariate clustering methods and characterization of climatic regions in Ethiopia. Meteorologische Zeitschrift. https://doi.org/10.1127/metz/2022/1093
- Webb P, Von Braun J (1990) Drought and food shortages in Ethiopia: a preliminary review of effects and policy implications International Food Policy Research Institute. 176
- Weldearegay SK, Tedla DG (2018) Impact of climate variability on household food availability in Tigray, Ethiopia. Agriculture & Food Security 7:6. https://doi.org/10.1186/s40066-017-0154-0
- Yue S, Pilon P, Cavadias G (2002) Power of the Mann–Kendall and Spearman’s rho tests for detecting monotonic trends in hydrological series. Journal of Hydrology 259:254–271. https://doi.org/10.1016/S0022-1694(01)00594-7
No competing interests reported.
- floatimage12.png
Sup. Fig. 1: Administrative districts (woredas) along with Elevation clusters across the region.
- floatimage13.png
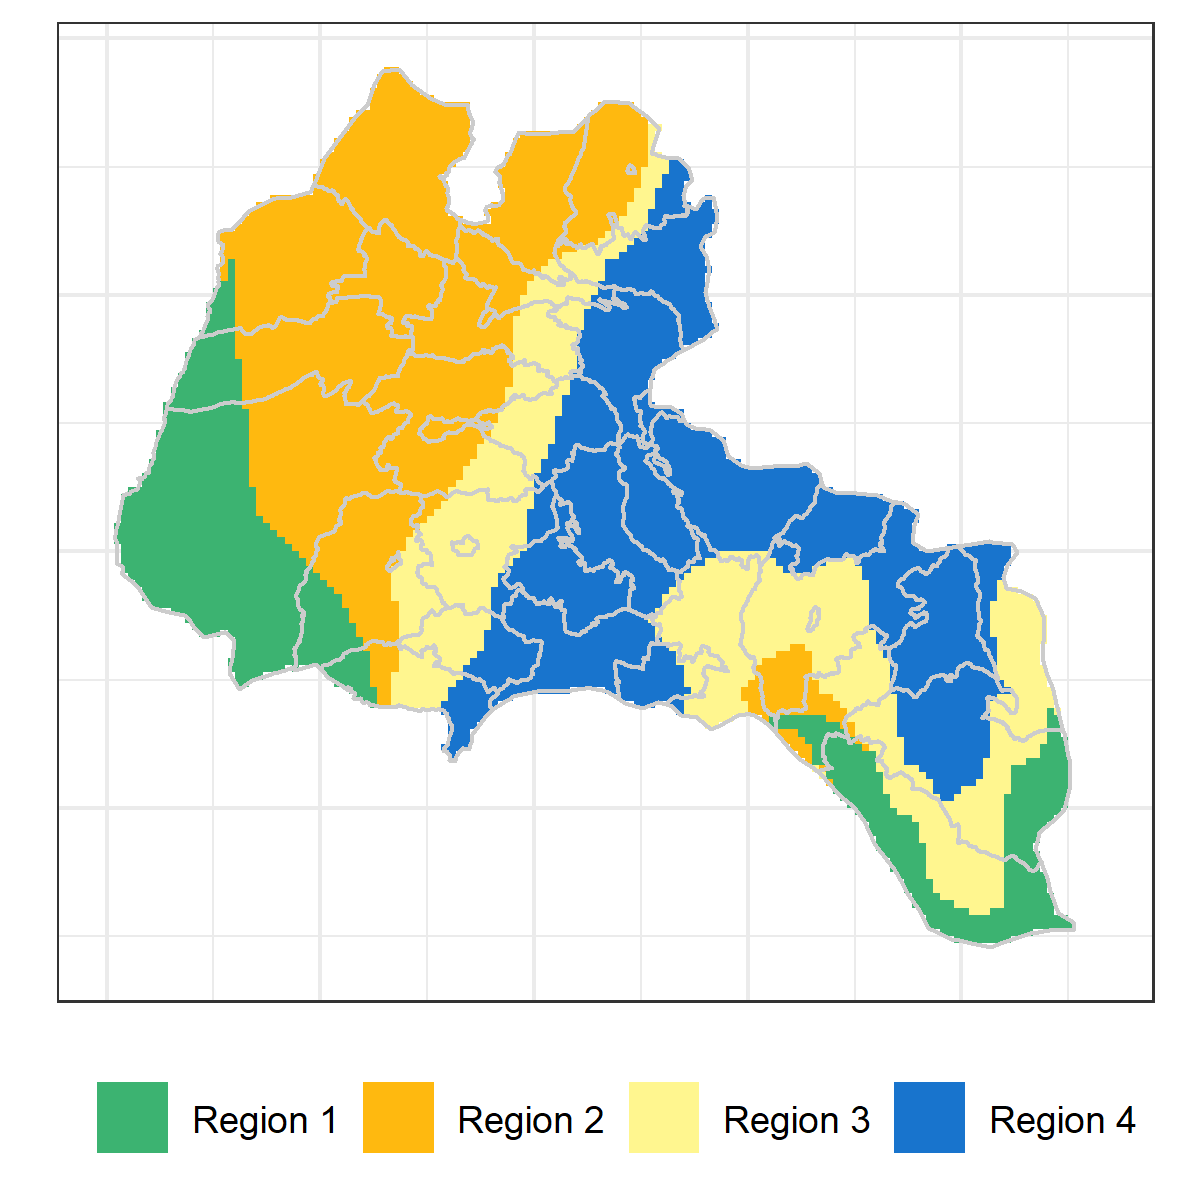
Sup. Fig. 2: Homogenous climatic regions clustered applying the K-means method on the long-term monthly mean of precipitation (mm), maximum- and minimum temperature (°C), and elevation(m).