Semiconductor nanocrystals could replace conventional bulk materials completely in displays and light-emitting diodes. However, the organic ligands enabling their unique optical properties, prevent current flow in nanocrystal films, leaving energy transfer as the only means of injecting or extracting carriers. Here, we investigate exciton diffusion in halide perovskite superlattices - nearly perfect 3D nanocrystal assemblies. This high degree of order is not as crucial as the individual nanocrystal size, which affects transport differently depending on temperature. Up to 70 K, a confinement-induced splitting of excitonic energies, especially for the smallest nanocrystals, traps excitons into dark levels, suppressing diffusion. At intermediate temperatures, the distance of individual FRET steps corresponding to nanocrystal size enhances diffusion in the larger nanocrystals. This trend is reversed, as exciton dissociation and carrier trapping in less strongly confined nanocrystals become dominant up to room temperature. Our results reveal that transport must be factored strongly into nanocrystal design strategies for future optoelectronic applications.
Article
Dark-Bright Exciton Splitting Dominates Low-Temperature Diffusion in Halide Perovskite Nanocrystal Assemblies
https://doi.org/10.21203/rs.3.rs-2450378/v1
This work is licensed under a CC BY 4.0 License
Version 1
posted
You are reading this latest preprint version
Since their first conception in the 1980s, semiconductor nanocrystals (NCs), with their size-dependent properties, have been a focus of scientific study as a platform to understand the underlying material in more detail.1, 2, 3, 4 Knowledge so obtained has aided in improving their quality to the degree that they are now being implemented into commercial devices.5, 6 However, organic ligands are typically required to passivate semiconductor NC surfaces in order to realize these characteristics and provide colloidal stability.7, 8 The sizeable inter-NC separation so arising, prohibits charge transfer from occurring, currently limiting their primary application to color converters. The only means of injecting carriers is thus reduced to energy transfer, either through reabsorption as in the color converters or by nonradiative processes, such as Förster resonance energy transfer (FRET).9, 10 Directed by concentration gradients, exciton diffusion can then be utilized to inject electron-hole pairs into the active areas of light-emitting diodes or lasers. Several studies have looked into exciton diffusion in NC thin films, with optical diffusion microscopy as one of the best methods for investigating these processes.11 It was so determined that excitons diffuse via energetic downhill migration, diminishing the diffusivity over time. Additionally, decreasing the NC separation (by reducing inorganic shells or using shorter organic ligands) enhanced the diffusivity in the films.12 One newer class of semiconductor, halide perovskite, offers not only superior optical properties: high photoluminescence quantum yields (PLQYs), and spectral tunability throughout the visible range, but also abundant, less toxic constituents and facile, reproducible, and scalable syntheses.13, 14, 15 Perovskite nanocrystal (PNC) films exhibit far larger diffusivities and diffusion lengths than conventional semiconductor NC films, an effect that has been attributed to a homogeneous energy landscape, high oscillator strengths, large absorption cross sections, and low nonradiative decay rates.16, 17 As most of the underlying diffusion processes in semiconductor (NC) films are highly sensitive, it is imperative to study them in a temperature-controlled environment to fully understand their fundamental nature.18, 19
Hence, we here realize a diffusion microscope implemented within a closed-cycle cryostat, enabling a study of exciton diffusion in a temperature range of \(9 – 300 K\). We compare highly ordered 3D assemblies of halide perovskite nanocubes – so-called superlattices (SLs) comprising different NC sizes with drop-cast thin films of a third NC size. Interestingly, we find that the high degree of order in the SLs is not as significant as the actual size of the individual NCs and the temperature of the NC ensemble in determining diffusion efficiencies. At the lowest temperatures, a quantum- and dielectric-confinement-induced splitting of the excitonic levels into upper bright and lower dark states by up to 17 meV becomes prominent.20 Optically excited electron-hole pairs rapidly relax to the dark levels, which preclude FRET due to a negligible dipole oscillator strength. This effect is especially egregious for the smallest NCs, which exhibit the most extensive confinement and the largest bright-dark splitting energy.21 Thermally-activated hopping processes strongly enhance diffusion as temperatures increase and excitons can be excited into the bright states. Here, the length of the inter-NC hop is given by the size of the individual NCs. Consequently, an exciton in the \(14 nm\) NCs travels nearly three times the distance compared to the 5 nm NCs. As the temperature increases further, the smaller size becomes beneficial, as weaker binding energies lead to a stronger dissociation of the excitons into free electrons and holes, severely limiting diffusion in the larger NCs. The results of this study clearly show that it is imperative when designing the ideal NC for optoelectronic applications to consider their size, shape, and order and not only the organic ligand length to enable sufficient transport capabilities.
Basic properties of nanocrystal assemblies
To investigate the effect of NC size and order, we fabricated films by drop-casting 14 nm large cubic PNCs synthesized via tip-sonication as described previously (Fig. 1a).22 Optical microscopy and scanning electron microscope (SEM) imaging reveal dense films with no high-range ordering. While there are voids around 50 nm in size, these are few and far between. Some PNCs form closed packages of roughly several tens of PNCs, but larger symmetry of such structured clusters is missing, i.e., these clusters are randomly orientated to each other. These films are in sharp contrast to superlattices (SL) visible in Fig. 1b,c via SEM imaging formed out of 8 nm and 5 nm cubes, respectively. The cubes are synthesized via the hot injection method and form SLs through solvent-drying-induced spontaneous assembly.23 The SLs are highly ordered over several microns. No voids or larger/smaller PNCs disturb the SL order. The smaller PNC cubes have lower relative deviations of their lateral size, as observed in transmission electron microscopy (TEM) images (Figure S1), resulting in a more ordered film formation. All PNCs exhibit high optical quality, as demonstrated by their intense, narrow (full width at half maximum – fwhm \(=75-93\)meV) emission spectra (Fig. 1d, Table S1). The PL peak blueshifts due to quantum confinement from 515 nm to 498 nm as the PNC size shrinks. The spacing between adjacent PNCs is determined by the organic ligands used to passivate the PNCs and amounts to approximately 2 nm in all films.24 This separation precludes charge transfer between adjacent NCs. Thus, the only possible way to transfer electron hole (e-h) pairs through the films, regardless of size and order of the NCs, is via resonant energy transfer.16
FRET processes are multiplicative and dependent on several conditions, rendering the processes non-efficient if even one of these conditions is weakly fulfilled: 1) The donor photoluminescence (PL) and acceptor absorption spectra should have a sizable overlap, 2) the orientation of the donor and the acceptor dipole moments should be aligned, i.e., as collinear as possible, and 3) the donor-acceptor distance should be small (not more than 10 nm)25. Fortunately, those conditions are highly fulfilled for PNCs, as seen in many preliminary works.9, 16, 17
Low temperature regime: Bright-dark exciton splitting
To track exciton diffusion in the PNC structures, we have realized a PL microscope inside a closed-cycle cryostat, yielding spatially and temporally resolved exciton dynamics at temperatures down to 9 K (Figure S2). Briefly, a laser is focused onto the NC assemblies, exciting electron-hole pairs that rapidly form excitons, which can emit photons and diffuse within the nanostructures. We ensure that we are in a low-power excitation regime to preclude non-linear or memory effects from playing a role.26 A single photon avalanche detector (SPAD) is scanned over the magnified focal plane of the PL, recording a PL decay trace at each spatial position with a temporal resolution of 25 ps (Figures S3).11, 12 With temperature affecting many relevant processes for exciton diffusion, such as thermally-induced hopping (Figure S4), trap formation and binding, and exciton formation and dissociation, this setup can shed light on the nature of the diffusion processes.11, 27, 28 In the measurements, the exciton concentration in an optically excited NC ensemble corresponds directly to the spatial PL emission profile, given by a Voigt function. A broadening of this function is indicative of exciton diffusion. Accordingly, we monitor the change in the PL profile variances \({\sigma }^{2}\) (from the Gaussian part of the distribution) in 25 ps steps after excitation, leading to the mean-squared displacement (MSD):
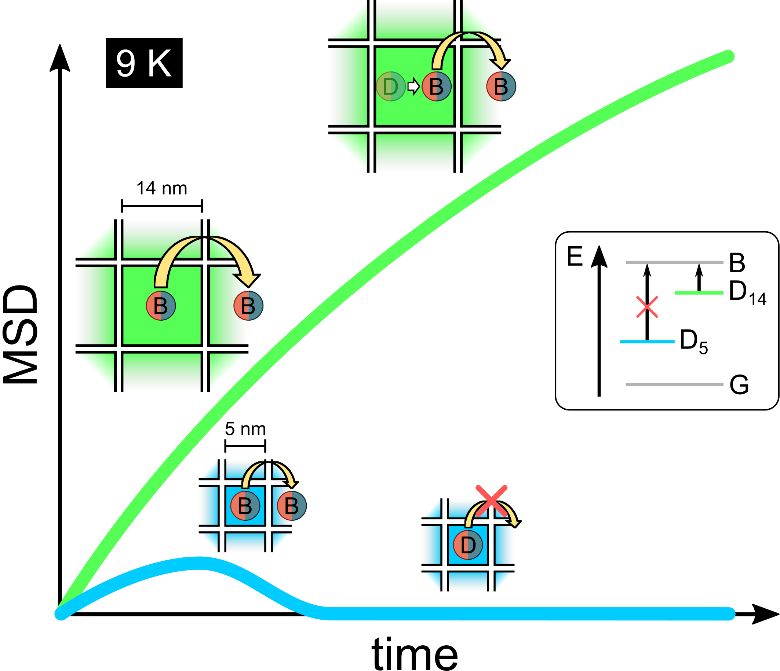
At low temperatures, we find a striking difference between the smallest and largest NCs. At 9 K, the MSD increases rapidly and nearly linearly within the first one to two nanoseconds for the 5 nm and 8 nm SLs (Fig. 2a). The MSD, however, plateaus and then begins to decline, reaching a value of \(MSD=0\frac{c{m}^{2}}{s}\) after 2 ns. This latter behavior can be naively interpreted as a negative diffusion. In contrast, for the 14 nm cubes, the MSD values continuously increase in time over the same time range as for the smaller NCs (see Figure S5).
This apparent negative diffusion is also visible at 20 K; however, the MSD does not return to 0, remaining at a constant value for higher times. At 40 K, the negative diffusion disappears, and the MSD increases continuously; yet, much faster within the first 500 ps than subsequently. This bimodal behavior becomes less prominent for higher temperatures until the MSD increase becomes monotonous for \(T>80\) K. The initial rapid increase is the same for all these temperatures, suggesting a similar diffusion source. Negative diffusion has been observed previously and generally requires multi-component systems such as singlet-triplet states in organic semiconductors or intervalley exciton–phonon scattering in 2D transition metal dichalcogenides.29, 30
To explain why negative diffusion is prevalent in the 5 nm PNCs, but not in the 14 nm PNCs, we must consider the energetic structure of the exciton. Due to the strong quantum and dielectric confinement, the exciton manifold splits into three bright levels and one dark one (Fig. 2b). While there had previously been some debate about the ordering of the levels, it has now generally been accepted that the dark exciton is the energetically lowest level.31, 32 The existence of the dark exciton can be observed in the time decay of the PL, which displays two general lifetimes, one on the order of a few nanoseconds and the other on the order of hundreds of nanoseconds or microseconds (see Figure S6). Such a slow component can also arise from delayed fluorescence from the dissociation of excitons and subsequent trapping of single charge carriers.33 We observe the power-law decay associated with such a mechanism for the 14 nm NCs and also at higher temperatures for all samples. However, at low temperatues and for long times, the 5 nm SLs exhibit the typical exponential decay one would assign to the decay of a dark exciton (see Figure S6, right). The splitting between the bright and dark levels depends strongly on size. 34, 35 We estimate the splitting energies of the NCs used here to be:
\({{\Delta }E}_{BD}^{14 nm}=1.5 meV;\) \({{\Delta }E}_{BD}^{8 nm}=9 meV;\) \({{\Delta }E}_{BD}^{5 nm}=17 meV\) (Fig. 2c).20, 35, 36 Using a Boltzmann distribution, we find that at the lowest temperatures, only the 14 nm NCs possess a significant bright-state occupation (see Figure S7). Accordingly, for the smaller NCs, excitons will quickly relax to the dark state, in which they are then fundamentally trapped, while in the larger NCs, excitons will readily switch between bright and dark states. The FRET process, which is likely responsible for the diffusion, is based on dipole-dipole coupling. With the dark states possessing nearly no dipole component (low oscillator strength compared to the bright exciton levels), the probability of a FRET hopping of excitons in the dark state from one exciton to the next is negligible. Thus, only excitons in bright states can undergo FRET processes, and excitons in dark states must first be thermally excited into an upper bright state before they can also diffuse, as indecated in the sketch in Fig. 2d by white arrows.
To confirm whether the dark exciton state can cause the observed negative diffusion, we implemented a Monte-Carlo simulation for this system (see Methods for details). In this model, the excitons are initially created nearly equally in bright/dark states. This results from the PNCs being excited far above the exciton levels within the e-h continuum and the charge carriers populating the exciton levels nearly equally upon carrier cooling.35 An exciton in its bright state can either recombine with a lifetime of approximately 1.5 ns, can hop to an adjacent NC or relax down to a dark state. Once inside the dark state, the recombination lifetime increases up to 1 µs, as previously observed,20, 21 hopping no longer occurs, and the exciton can only be thermally excited to the higher-lying bright states at higher temperatures. The simulated MSD curves match the experimental trends nicely, with a clear negative diffusion trend observable for the lowest temperatures and a bimodal increase for elevated temperatures. The bright excitons can diffuse between NCs, which initiates rapid diffusion. However, these recombine quickly or relax into dark states, which possess lifetimes in the microsecond regime and do not exhibit diffusion. Once all excitons have vacated the bright levels, the distribution returns to the original width, where the dark exciton population is also approximately equal to the size of the exciting laser spot. Accordingly, the apparent negative diffusion is not an actual diffusion process but is caused by the two different exciton species (bright and dark) with drastically different inter-NC transfer rates. At higher temperatures, thermal excitation of the dark excitons becomes progressively more likely, reducing the negative diffusion and inducing the monotonous diffusion for higher temperatures. For the largest NCs with the smallest bright-dark splitting, the trapping effect into the dark exciton state is not observable and, at most, reduces the overall diffusion.
High temperature regime: Trap states and exciton dissociation
As the temperature increases further, the MSD curves of all NC samples exhibit a steeper increase signifying an enhanced diffusion. Three effects can explain this: 1) FRET rates increase with temperature,37 2) the increased exciton lifetime allows the excitons to diffuse for a longer time than at low temperatures, and 3) thermally activated hopping is more efficient at higher T, reducing the detrimental effect of an inhomogeneous energetic landscape (see Figure S4). The observed effect progresses up to 100–150 K, upon which we again observe a contraction of the MSD (Fig. 3a,b), albeit for much longer times on the order of 10–30 ns. Moreover, the time at which the contraction begins, \({t}_{max} ,\)is highly temperature dependent, with higher temperatures leading to larger values. The bright-dark exciton state cannot explain this observation, as at these temperatures, excitons do not reside long in the dark state, even for the smallest PNCs. So far, we have neglected any contribution from trap states, which can bind excitons and charge carriers and are often detrimental to optoelectronic properties.38 Accordingly, we reworked our Monte-Carlo simulation to reproduce the observed MSD traces. In this new model, we introduced a trapping rate of free excitons into deep defects from which the excitons can still emit (albeit with a radiative rate of 1/100th that of the free exciton) but not be detrapped (see Figure S8). The result is the bottom curve in Fig. 3c, which produces a near-linear increase in MSD up to a maximum value and time (denoted \({t}_{max}\)), subsequently decaying back to zero. An additional contribution due to shallow traps from which the excitons can be detrapped, would only reduce the overall diffusion (analogous to the previous bright-dark model with thermal excitation) and not shift the \({t}_{max}\) value and is thus omitted from the new model. The increase in the initial diffusion occurring for higher temperatures can easily be reproduced by varying the inter-NC hopping rate, but this does not affect the \({t}_{max}\) value (Figure S9). The only way to shift this value to later/earlier times is through a variable trap density, which we incorporate by modifying the trapping rate of the free excitons (Fig. 3c,d). Notably, a lower trapping rate (corresponding to a lower trap density) shifts \({t}_{max}\) to higher values, which agrees nicely with the experimentally observed trends (Fig. 3e). Interestingly, we observe essentially constant \({t}_{max}\) values up to a specific temperature (14 nm: 140 K, 8 nm: 180 K, 5 nm: 220 K), after which the values increase abruptly. This result implies that the number of trap states is reduced as the temperatures increase. This can be explained by assuming that the traps in the NCs exhibit a breadth of energies that are all deep enough to preclude detrapping at lower temperatures. At higher temperatures, a certain fraction can no longer be considered deep enough and no longer bind the excitons indefinitely, reducing the effective trap density. The trap depth seems to vary with NC size, either due to the exciton Bohr radius or the binding energy, which are inversely proportional to each other, or the larger surface-to-volume ratio for smaller NCs, since traps are more likely to be located at the NC boundaries.
Temperature dependence of diffusion parameters
Understanding these processes, we evaluated the diffusion for all PNC samples and temperatures. Depending on the system and the experimental circumstances, various methods can be employed to reproduce the observed MSD curves, including a subdiffusion model39 and trapping models of varying complexity.39, 40, 41 While each model can be applied to specific combinations of PNC samples and temperature ranges, none of these models can reproduce the complete set of MSD curves of all three PNC types. However, none of the previously reported data suggests that diffusion should occur differently for the three systems. Accordingly, we numerically determine the diffusivity for all systems and temperatures with the following equation:

The average diffusivity is given by summing the differences in MSD from two subsequent time bins (separated by \({t}_{bin}= {\text{t}}_{i+1} - {\text{t}}_{\text{i}} = 25 \text{p}\text{s}\)), which are weighted by the total PL intensity at the first time bin up to the time bin corresponding to five times the PL lifetime (\(N = 5*{\tau }_{PL}/{t}_{bin}\)). The PL lifetimes differ for each NC system and temperature. The total PL intensity \({I}_{PL}\left({t}_{i}\right)\) is the sum over the PL counts of all captured PL decay traces for each time bin and the PL lifetime corresponds to the time after which total PL intensity has dropped to 1/e of the initial value. This way, we can account for the exciton population, i.e., in early times, more excitons are present. Thus those times should have a more considerable impact on the diffusivity compared to later times, where the exciton population rapidly decreases due to radiative and nonradiative recombination. If normal diffusion is present, i.e., a linear MSD behavior with time, its slope is constant, and Eq. 2 expresses the normal diffusivity: \({D}_{normal}=\frac{1}{2}\frac{\varDelta MSD}{\varDelta t}.\)Importantly, we assure that even at these very late times, when most of the exciton population has decayed, their spatial distribution can still be given by a Voigt function (see Figure SI10). With the so-obtained diffusivity and the PL lifetime measured through time-correlated single photon counting (TCSPC), we can then calculate the diffusion length \(L=\sqrt{{\tau }_{PL}{D}_{avg}}\). All three of these quantities are depicted in Fig. 4a-c.
At the lowest temperatures, both the \(5 nm\) and \(8 nm\) superlattices exhibit very low diffusivity, nearly two orders of magnitude lower than the \(14 nm\) films, which have a diffusivity of  at 9 K (Fig. 4a). This is most likely due to the prevalence of the dark exciton, which severely limits diffusion in the SLs (see Fig. 2b,c). Also, considering a FRET-mediated diffusion process between equally spaced NCs (given by the ligand length), the distance covered by a single hopping process is equal to the size of the respective NCs, and so is nearly three times as large for the 14 nm NCs as for the 5 nm NCs. Accordingly, to cover the same distance in the 5 nm SLs, an exciton would need three successive hops. The diffusivities all increase with temperature, albeit at different rates, due to enhanced hopping rates (larger FRET rates and thermally activated hopping bridging energy inhomogeneities between adjacent NC (Figure S4)). Especially for the smaller NCs, a significantly increased thermal excitation of the excitons from dark to bright states can be observed, reflecting the largest exciton bright-dark splitting for these SLs. Between 80 K and 110 K, the diffusivities of the 14 nm NC films and 8 nm SLs are comparable \({D}_{avg}\approx {10}^{-1}\frac{c{m}^{2}}{s},\)peaking at 100 K and 110 K, respectively. Here, the order in the SL becomes important and can compensate for the smaller hopping distances. However, the diffusivity in the 5 nm SLs increases far slower, peaking at \({D}_{avg}\approx {4\cdot 10}^{-3}\frac{c{m}^{2}}{s}\) at 140 K\(.\) In this intermediate temperature range, the NC size and the order in the ensembles play similarly important roles in determining the diffusivities.
All samples show a steep decline in diffusivity for higher temperatures. To explain this, we again consider exciton traps in the NCs. Shallow traps likely increase in number with rising temperatures as defects are thermally ionized. Moreover, deep traps become progressively shallower with respect to thermal energy, leading to a transient binding, which reduces the overall diffusivity. The importance of bound exciton emission in perovskites was previously shown in organic/inorganic 2D and 3D halide perovskite films.42, 43 This assertion also matches the increasing \({t}_{max }\)values due to a lower deep trap density observed in the MSD measurements and Monte Carlo simulations (Fig. 3d,e).
At 200 K all three diffusivities become comparable, and for higher temperatures, the 5 nm SLs exhibit the highest values, yet, below those in our previous report on PNCs at temperatures around RT.44 This continued decline coincides with a steep rise in the PL lifetimes (Fig. 4b) and a significant drop-off in the total PL count rate at those temperatures (see Figure S11). However, as these two processes begin at higher temperatures than the diffusivity decline, the underlying effects must differ. At elevated temperatures, the thermal energy available noticeably affects the Coulomb interaction of electron and hole, in turn influencing the exciton to free charge carrier ratio in the NCs, as given by the Saha equation. This equation quantifies how the free charge carrier density increases with rising temperatures as excitons become progressively dissociated, especially for the less-confined NCs in the intermediate temperature ranges (Figure S12). Inter-NC transport of free charge carriers is prohibited, further reducing diffusivities. Additionally, the charged particles are more susceptible to binding to trap states, so in the more polarizable larger NCs, the diffusivity is even more severely reduced.
This discrepancy in the absolute diffusivity values to our previous publication is likely a result of the experimental setup. With the temperature measured just below the substrate but diffusion measurements carried out on top of the NC ensembles, which are hundreds of nanometers thick, the actual temperature in the NC samples is likely higher than indicated by the setup. We corroborate this through additional temperature-dependent PL measurements, which suggest that the temperature in the relevant part of the NC ensembles is significantly higher than anticipated (see Supporting Information, Figures S13, S14). Nevertheless, the diffusion lengths as derived from the PL decay time and diffusivity range between 10 nm and 250 nm (Fig. 4c)., which are in the order of previously determined values 12, 39, 44, 45
Clearly, the diffusion in colloidal NC thin films and SLs is far more complicated than previously assumed, at least for the extensive temperature range. While one would assume highly ordered structures without NC voids and nearly monodisperse NC size to lead to enhanced diffusion, we do not find this to be the case for the samples studied here. Instead, the size of the individual NCs plays a far greater role. At the lowest temperatures, the splitting of excitons into bright and dark states becomes the dominant effect. The dark excitons possess a weak dipole oscillator strength, which is a prerequisite for FRET processes. As the bright-dark splitting is most prominent in the smallest NCs, excitons relax rapidly to dark states, in which they are stuck energetically and spatially, leading to minuscule diffusivities which are only caused by an initial population of excitons in bright states diffusing until they recombine or themselves become trapped in dark states. At intermediate temperatures (up to approximately 140 K), where dark excitons can be thermally excited into bright states, and FRET processes become prevalent, the larger NCs still show far higher diffusivities, as each hopping event brings about a spatial displacement on the order of the NC size. Accordingly, an exciton must hop thrice in the 5 nm SL to diffuse the same distance as an exciton in the 14 nm NC film. Thus the size is much more important than the degree of order in the ensembles. At higher temperatures, the diffusivities in the smaller NCs overtake those obtained for the larger NCs. Again, this is an effect of size, as exciton dissociation into free charge carriers, which cannot diffuse due to the larger inter-NC separation and trapping effects, becomes dominant, deterring diffusion far less in the smaller NCs. These results highlight the importance of considering NC morphology, size, and spacing when devising optoelectronic device architectures that rely on efficient carrier transport, such as LEDs or solar cells.
Nanocrystal Synthesis
14 nm PNCs: The 14 nm PNCs were synthesized as previously described.22
Materials: Cs2CO3 (Cesium carbonate, 99%), PbCl2 (lead(II) chloride, 98%), PbBr2 (lead(II) bromide 98%), PbI2 (lead(II) iodide 99%), mineral oil (light), SnBr2 (Tin(II) bromide), 1-octadecene (technical grade 90%), oleic acid (technical grade 90%), oleylamine (technical grade 70%), hexane (HPLC, grade ≥ 97.0%, GC)and trioctylphosphine (97%) were purchased from Sigma-Aldrich.
Synthesis: 10 ml octadecene together with 0.5 ml oleic acid and 0.5 ml oleylamine were added to Cs2CO3 (0.1 mmol) and PbBr2 (0.3 mmol) precursor powders. Then the reaction medium was subjected to tipsonication (Sonoplus hd 3100, Bandelin) at a power of 30 W for 10 minutes. The as prepared NC dispersions were purified by centrifugation at a speed of 9000 rpm for 10 min to get rid of unreacted precursors, and then the NC precipitates were redispersed in 5 ml hexane under mild sonication. The obtained NC dispersions were further centrifuged at 2000 rpm to remove large NCs.
8 nm PNC: The 8 nm PNCs were synthesized as previously described.46
Stock solutions: PbBr2 stock solution (0.04 M) is prepared by dissolving PbBr2 (1 mmol, 0.367 g, Sigma Aldrich 99.999%) and TOPO (5 mmol, 2.15 g, Strem, 90%) in octane (5 mL) at 100 ⁰C, followed by dilution with hexane (20 mL). The CsDOPA solution (0.02 M) is prepared by mixing Cs2CO3 (100 mg, Sigma Aldrich) with diisooctylphosphinic acid (1 mL, Sigma Aldrich) and octane (2 mL) at 100 ⁰C, followed by dilution with hexane (27 mL).
Synthesis: In a 25 mL one-neck round bottom flask, 0.7 mL PbBr2 stock solution is combined with 6 mL hexane. Under vigorous stirring, 0.35 mL of Cs-DOPA stock solution is swiftly injected. After 4 min 75 µL of didodecyldimethylamonium bromide (DDAB) in toluene (300 mg of DDAB from Alfa Aesar are solubilized in 3 mL anhydrous toluene) is added and then the reaction is stopped in 2 min.
Purification: The volume of the reaction mixture is decreased to 1 mL by evaporation on the rotary evaporator at room temperature. A ca. 3-fold excess of antisolvent (ethyl acetate and acetone mixture, v/v 2:1) is added, and NCs are isolated by centrifugation at 12100 g for 2 minutes and redispersed in 1 mL anhydrous toluene.
5 nm PNC: The 5 nm PNCs were synthesized by adapting a synthesis procedure.47
Stock solutions: Cesium oleate 0.16 M in octadecene (ODE): Cs2CO3 (250 mg, 0.77 mmol, Sigma Aldrich), and oleic acid (0.8 mL), and octadecene (8.8 mL) are mixed in a 25 mL flask. The mixture is degassed three times and then heated to 100–120°C under N2 until it becomes clear. Cesium oleate in ODE is stored in the glove box.
Synthesis: PbBr2 (75 mg, 0.2 mmol, Sigma Aldrich, 99.999%), ZnBr2 (Alfa Aesar, 180 mg, 0.8 mmol), and distilled mesitylene (5 mL, Acros) are mixed in a 25 mL flask under N2, stirring at 1400 rpm. The mixture is heated to 120°C: distilled oleylamine (2 mL) and dried oleic acid (2 mL) are injected. The mixture is heated to 145°C: 0.4 mL cesium oleate is injected from a 0.5 mL glass syringe. The reaction is quenched after 15 s with an ice bath.
Size selection and purification: The crude solution is centrifuged for 3 min at 20130 g, and the precipitate is discarded. 27 mL ethyl acetate is added to the supernatant, then centrifuged for 5 min at 20130 g, the supernatant is discarded, and the precipitate is dispersed in 1 mL anhydrous toluene.
Post-synthesis treatment: 1 mL NCs in toluene is mixed with 100 µL 0.01 M DDAB in toluene and stirred for one h. 0.01 M solution of DDAB in toluene is prepared by dissolving 9.2 mg DDAB in 2 mL anhydrous toluene.
Self-assembly of CsPbBr3 NCs
The 14 nm PNC film was prepared by drop casting 40 µL of the PNC dispersion onto a SiO2-coated (300 nm) 10 × 10 mm Si substrate.
The SLs were prepared on square 5 mm × 5 mm silicon substrates. Shortly before the self-assembly process, the silicon substrate was dipped into a 4% HF in water for 20 min, followed by intensive washing with deionized water. The substrate was placed in a 10 mm × 10 mm × 10 mm Teflon well, and 7 µl of stock solution of NCs in toluene (5 nm PNC: 20 µL of NC stock solution in 0.16 mL anhydrous toluene/8 nm PNC: 25 µL of NC stock solution in 0.15 mL anhydrous toluene) were spread onto the substrate. The well was covered with a glass slide to allow slow evaporation of the solvent. 3D SLs of CsPbBr3 NCs were formed upon complete evaporation of the toluene.
Confocal low-temperature microscopy
The setup for conducting exciton diffusion measurements (via TCPSC measurements) and capturing steady-state PL spectra is depicted in Figure S2.
The excitation is provided by a pulsed laser (NKT Photonics, SuperK Fianium FIU-15) and a tunable multiline filter (NKT Photonics, SuperK VARIA) to select an excitation wavelength depending on the specific NC according to SI Table 2. A motorized continuous neutral density (ND) filter wheel (ThorLabs, NDM4) is used to attenuate the signal by reflecting a tunable fraction of the beam. Together with a power diode (ThorLabs, S120C), this allows for precise control over irradiance of the laser spot on the sample (SI Table 2). The laser beam is reflected in the direction of the focusing optics inside the cryostat with the help of a suitable dichroic (DC) mirror (either Semrock, HC 495 or Chroma, T 450 LPXR; see SI Table 2). The insides of the closed-cycle helium-cooled cryostat (attocube, attoDRY800) consist of a vacuum objective (Zeiss, EC Epiplan-Neofluar 100x/0.9 NA DIC Vac M27) with a working distance of 1.0 mm and a sample holder on a 3-axis piezo-controlled translation stage (attocube). A thermal bridge between the cold plate and the sample holder allows for sample temperatures from 9 K to 300 K. The generated PL is collected and collimated by the vacuum objective and exits the cryostat in the direction of the DC mirror. The DC mirror allows for the transmission of the PL signal, thus separating it from the excitation signal (laser beam). An additional suitable long pass (LP) filter (either Semrock, 496/LP-25 or Semrock, AT465lp; see SI Table 2) makes sure that no laser light is left in the signal path by reflecting all light below its characteristic wavelength. A beam splitter (ThorLabs, BSN10R) guides 10% of the PL signal to the (i) spectrometer and 90% to the (ii) TCSPC system. (i) A lens (𝑓 = 200 mm) focuses the PL signal into the slit of the spectrometer (Teledyne Princeton Instruments, HRS-500-MS). Inside the spectrometer, the PL is reflected from different optical parts on a rotating turret and detected by a charge-coupled device camera (Teledyne Princeton Instruments, PIXIS 400BR eXcelon). PL images or PL spectra can be recorded by setting the turret to either a mirror or a grating. (ii) A lens (𝑓 = 200 mm) focuses the PL light onto a plane, where it is magnified by a factor of 122 compared to the initial sample plane (same for (i)). The magnification factor was determined with a gold scale. A motorized ND filter wheel (ThorLabs, NDM4) can be used to attenuate the PL signal, e.g., to guarantee single-photon statistics in TCSPC measurements. The PL signal is collected by a \(10 \mu\)m wide glass fiber (ThorLabs, M64L01) connected to a fiber-coupled SPAD (MPD, PDM series). Both laser and SPAD are connected to a TCSPC card (PicoQuant, TimeHarp 260) in the PC to allow for TCSPC measurements. The glass fiber is mounted on a piezo-controlled 2-axis translation stage (Physik Instrumente, Q-521), which enables capturing local PL decays at different positions of the magnified PL signal. Exciton diffusion is measured using this method, as depicted in Fig. S3.
Additional microscopy methods
Optical images of the superlattices were obtained using an optical microscope Leica DM4 M under UV light.
Transmission electron microscopy (TEM) images of the 14 nm PNC samples were recorded using a JEOL JEM-1011 with an accelerating voltage of 80 kV. TEM images for the 5 nm and 8 nm PNC samples were collected using a JEOL JEM2200FS microscope operating at 200 kV accelerating voltage.
Scanning electron microscopy (SEM) images of all samles were recorded using a ZEISS SEM Ultra Plus with an acceleration voltage of 3 kV and a FEI Helios 660 operated at 3 kV using immersion mode.
Characterization of Exciton Diffusion
To characterize exciton diffusion, we fitted Voigt profiles to each spatial PL intensity distribution for every time bin. A Voigt profile, being the convolution of a Gaussian and a Lorentzian function, can be expressed as an exciton density according to:
Here, \(\tau\) is the monomolecular recombination time, and \(A\) is the profile height. For the first time bin, both broadening parameters of the Lorentzian \(\lambda\) and the Gaussian part \(\sigma\) serve as free fit parameters for the Voigt profile. For all subsequent time bins, only the parameters of the Gaussian part act as free fit parameters. The Lorentzian parameters retain their initial values since the Lorentzian profile best describes the starting exciton distribution. Thus, it does not evolve over time. This implies that the time-dependent Gaussian line shape is the only parameter characterizing the PL broadening/exciton diffusion. The diffusivity \({D}_{avg}\) is numerically determined with Eq. (2) in the main text. The diffusion length is calculated with the equation \(L=\sqrt{{\tau }_{PL}{D}_{avg}}\), where \({\tau }_{PL}\) is the \(1/e\)-decay time of the total PL decay trace (integration of PL decay traces at all positions over time).
Monte Carlo Simulations
The structure formed by NCs in the experimental setup is implemented as a regular 2D grid without effective boundaries and comprising uniform squares with identical orientations. We found that the results for 2D and 3D grids were nearly identical; however, the computation time in 3D was significantly higher. We, therefore, chose to adopt the 2D system for the model. To prevent the exciton dynamics from being limited by the edges of the simulated environment, sufficiently large dimensions are chosen (dim = 150 lattice units). The side length of a square corresponds to the average center-to-center distance of the respective NCs in the experiment. This distance is also the step size considered for nonradiative transitions between the two closest neighbors within the grid.
The lattice is initially populated with excitons residing in bright, dark, and trapped states, with the ratio depending on the temperature regime. The spatial distribution of the excitons is given by an initial Gaussian function with standard deviation\(\sigma = 10\) in lattice units, i.e., 170 nm for the largest NCs considered. The initial excitation marks the starting point of a Monte-Carlo-based random walk for 200–300 frames (after that time, no excitons are left for the considered parameters). The system's dynamics are obtained by considering all possible interactions, such as radiative and nonradiative decay, dissociation, trapping, and inter-NC hopping, assigning each a probability and determining what happens to each exciton for each time step. The most likely event for an exciton in a bright state is a nonradiative transfer (or hopping event) with a FRET-like distance dependence. The transition rate to a nearest neighbor (NN) is \({r}_{NN}=\frac{0.15}{{1}^{6}}\), so with 4 NN, the total probability for a hopping event is 0.6. We additionally consider FRET processes to the next nearest neighbors (NNN), located at the corners of the squares with hopping rates of \({r}_{NNN}=\frac{0.15}{\surd {2}^{6}}\). Consequently, these events only play a minuscule role. Hopping events for excitons in a dark or trapped state are negligible due to the weak oscillator strength and weak spatial overlap, respectively.
Every bright exciton can recombine radiatively at a rate of 0.03 (3% possibility that a bright state is deexcited to the ground state, thereby emitting a photon). For dark or trapped states, however, the radiative relaxation to the ground state is much less likely to happen compared to bright states resulting in a smaller transition rate (reduced by a factor of 50 to match the difference in PL decay)35; therefore, these processes are only relevant on longer time scales. Nonradiative decay does not have a significant effect on the results of the Monte-Carlo simulation and was left out of the model. 'Decay' events correspond to the end of the random walk, and the location of the decay event is registered to create the MSD(t) function.
The excitons can also transition between individual states. While the transition from bright to dark is fixed with a rate of 0.15, the inverse transition is temperature-dependent and varies between 0 (at the lowest temperatures) and approximately 0.1 (see Figure S7). Consequently, at the higher temperature regimes, we neglect the dark state entirely (also for the initial population), as the thermal excitation is sufficiently large enough that the MSD values are only reduced slightly due to the excitons residing in the dark state. The transition from a bright state to a trap state is also temperature dependent and varies from 0 to 0.025; detrapping is not permitted, as explained in the main text. In all, we repeated the simulations beginning with the initial Gaussian distributions approximately 10.000 times to obtain an accurate picture of the diffusion behavior of excitons in such NC environments.
Data availability
The authors declare that the data needed to evaluate the conclusions in this manuscript are present in the main text or the Supplementary Information. Experimental procedures, characterization of materials, computational details, Supplementary Tables and Supplementary Figures are available in the Supplementary Information. Additional raw data formats are available upon request to the corresponding authors.
Code availability
The computer simulations codes used in this study are available upon reasonable request.
- Kagan CR, Murray CB, Nirmal M, Bawendi MG. Electronic Energy Transfer in CdSe Quantum Dot Solids. Phys Rev Lett 1996, 76(9): 1517–1520.
- Norris DJ, Bawendi MG. Measurement and assignment of the size-dependent optical spectrum in CdSe quantum dots. Phys Rev B 1996, 53(24): 16338–16346.
- Chamarro M, Gourdon C, Lavallard P, Lublinskaya O, Ekimov AI. Enhancement of electron-hole exchange interaction in CdSe nanocrystals: A quantum confinement effect. Phys Rev B 1996, 53(3): 1336–1342.
- Ekimov AI, Efros AL, Onushchenko AA. Quantum size effect in semiconductor microcrystals. Solid State Commun 1985, 56(11): 921–924.
- Murray CB, Norris DJ, Bawendi MG. Synthesis and characterization of nearly monodisperse CdE (E = sulfur, selenium, tellurium) semiconductor nanocrystallites. J Am Chem Soc 1993, 115(19): 8706–8715.
- Dai X, Deng Y, Peng X, Jin Y. Quantum-dot light‐emitting diodes for large‐area displays: towards the dawn of commercialization. Adv Mater 2017, 29(14): 1607022.
- Ip AH, Thon SM, Hoogland S, Voznyy O, Zhitomirsky D, Debnath R, et al. Hybrid passivated colloidal quantum dot solids. Nature Nanotechnology 2012, 7(9): 577–582.
- Krieg F, Ochsenbein ST, Yakunin S, Ten Brinck S, Aellen P, Suess A, et al. Colloidal CsPbX3 (X = Cl, Br, I) Nanocrystals 2.0: Zwitterionic Capping Ligands for Improved Durability and Stability. ACS Energy Letters 2018, 3(3): 641–646.
- Singldinger A, Gramlich M, Gruber C, Lampe C, Urban AS. Nonradiative Energy Transfer between Thickness-Controlled Halide Perovskite Nanoplatelets. ACS Energy Letters 2020, 5(5): 1380–1385.
- Clegg RM. Förster resonance energy transfer—FRET what is it, why do it, and how it's done. In: Gadella TWJ (ed). Fret and Flim techniques, vol. 33. Elsevier, 2009, pp 1–57.
- Akselrod GM, Deotare PB, Thompson NJ, Lee J, Tisdale WA, Baldo MA, et al. Visualization of exciton transport in ordered and disordered molecular solids. Nat Commun 2014, 5.
- Akselrod GM, Prins F, Poulikakos LV, Lee EM, Weidman MC, Mork AJ, et al. Subdiffusive exciton transport in quantum dot solids. Nano Lett 2014, 14(6): 3556–3562.
- Zhang J, Yang Y, Deng H, Farooq U, Yang X, Khan J, et al. High quantum yield blue emission from lead-free inorganic antimony halide perovskite colloidal quantum dots. Acs Nano 2017, 11(9): 9294–9302.
- Xu W, Hu Q, Bai S, Bao C, Miao Y, Yuan Z, et al. Rational molecular passivation for high-performance perovskite light-emitting diodes. Nat Photonics 2019, 13(6): 418–424.
- Shewmon NT, Yu H, Constantinou I, Klump E, So F. Formation of Perovskite Heterostructures by Ion Exchange. ACS Appl Mater Interfaces 2016, 8(48): 33273–33279.
- Penzo E, Loiudice A, Barnard ES, Borys NJ, Jurow MJ, Lorenzon M, et al. Long-Range Exciton Diffusion in Two-Dimensional Assemblies of Cesium Lead Bromide Perovskite Nanocrystals. ACS Nano 2020, 14(6): 6999–7007.
- Giovanni D, Righetto M, Zhang QN, Lim JWM, Ramesh S, Sum TC. Origins of the long-range exciton diffusion in perovskite nanocrystal films: photon recycling vs exciton hopping. Light Sci Appl 2021, 10(1).
- Rettie AJE, Chemelewski WD, Emin D, Mullins CB. Unravelling Small-Polaron Transport in Metal Oxide Photoelectrodes. J Phys Chem Lett 2016, 7(3): 471–479.
- Cho N, Li F, Turedi B, Sinatra L, Sarmah SP, Parida MR, et al. Pure crystal orientation and anisotropic charge transport in large-area hybrid perovskite films. Nat Commun 2016, 7(1).
- Rossi D, Liu X, Lee Y, Khurana M, Puthenpurayil J, Kim K, et al. Intense Dark Exciton Emission from Strongly Quantum-Confined CsPbBr3 Nanocrystals. Nano Letters 2020, 20(10): 7321–7326.
- Rossi D, Qiao T, Liu X, Khurana M, Akimov AV, Cheon J, et al. Size-dependent dark exciton properties in cesium lead halide perovskite quantum dots. J Chem Phys 2020, 153(18): 184703.
- Tong Y, Bladt E, Aygüler MF, Manzi A, Milowska KZ, Hintermayr VA, et al. Highly Luminescent Cesium Lead Halide Perovskite Nanocrystals with Tunable Composition and Thickness by Ultrasonication. Angew Chem Int Ed 2016, 55(44): 13887–13892.
- Protesescu L, Yakunin S, Bodnarchuk MI, Krieg F, Caputo R, Hendon CH, et al. Nanocrystals of Cesium Lead Halide Perovskites (CsPbX3, X = Cl, Br, and I): Novel Optoelectronic Materials Showing Bright Emission with Wide Color Gamut. Nano Lett 2015, 15(6): 3692–3696.
- Raino G, Becker MA, Bodnarchuk MI, Mahrt RF, Kovalenko MV, Stoferle T. Superfluorescence from lead halide perovskite quantum dot superlattices. Nature 2018, 563(7733): 671–675.
- Köhler A, Bässler H. Electronic Processes in Organic Semiconductors, 2015.
- Shcherbakov-Wu W, Saris S, Sheehan T, Wong NN, Powers ER, Krieg F, et al. Persistent Enhancement of Exciton Diffusivity in CsPbBr3 Nanocrystal Solids. arxiv: 220914412 2022.
- Gramlich M, Lampe C, Drewniok J, Urban AS. How Exciton-Phonon Coupling Impacts Photoluminescence in Halide Perovskite Nanoplatelets. J Phys Chem Lett 2021, 12(46): 11371–11377.
- Baldwin A, Delport G, Leng K, Chahbazian R, Galkowski K, Loh KP, et al. Local Energy Landscape Drives Long-Range Exciton Diffusion in Two-Dimensional Halide Perovskite Semiconductors. J Phys Chem Lett 2021, 12(16): 4003–4011.
- Berghuis AM, Raziman TV, Halpin A, Wang S, Curto AG, Rivas JG. Effective Negative Diffusion of Singlet Excitons in Organic Semiconductors. J Phys Chem Lett 2021, 12(4): 1360–1366.
- Rosati R, Perea-Causín R, Brem S, Malic E. Negative effective excitonic diffusion in monolayer transition metal dichalcogenides. Nanoscale 2020, 12(1): 356–363.
- Becker MA, Vaxenburg R, Nedelcu G, Sercel PC, Shabaev A, Mehl MJ, et al. Bright triplet excitons in caesium lead halide perovskites. Nature 2018, 553(7687): 189–193.
- Tamarat P, Bodnarchuk MI, Trebbia J-B, Erni R, Kovalenko MV, Even J, et al. The ground exciton state of formamidinium lead bromide perovskite nanocrystals is a singlet dark state. Nat Mater 2019, 18(7): 717–724.
- Becker MA, Bernasconi C, Bodnarchuk MI, Raino G, Kovalenko MV, Norris DJ, et al. Unraveling the Origin of the Long Fluorescence Decay Component of Cesium Lead Halide Perovskite Nanocrystals. ACS Nano 2020, 14(11): 14939–14946.
- Sercel PC, Lyons JL, Wickramaratne D, Vaxenburg R, Bernstein N, Efros AL. Exciton Fine Structure in Perovskite Nanocrystals. Nano Lett 2019, 19(6): 4068–4077.
- Gramlich M, Swift MW, Lampe C, Lyons JL, Doblinger M, Efros AL, et al. Dark and Bright Excitons in Halide Perovskite Nanoplatelets. Adv Sci 2022, 9(5): e2103013.
- Chen L, Li B, Zhang C, Huang X, Wang X, Xiao M. Composition-Dependent Energy Splitting between Bright and Dark Excitons in Lead Halide Perovskite Nanocrystals. Nano Lett 2018, 18(3): 2074–2080.
- Hofmann FJ, Bodnarchuk MI, Dirin DN, Vogelsang J, Kovalenko MV, Lupton JM. Energy Transfer from Perovskite Nanocrystals to Dye Molecules Does Not Occur by FRET. Nano Lett 2019, 19(12): 8896–8902.
- Klingshirn C. Optical Properties of Bound and Localized Excitons and of Defect States. In: Klingshirn C (ed). Semiconductor Optics. Springer Berlin Heidelberg: Berlin, Heidelberg, 2007, pp 351–369.
- Seitz M, Magdaleno AJ, Alcazar-Cano N, Melendez M, Lubbers TJ, Walraven SW, et al. Exciton diffusion in two-dimensional metal-halide perovskites. Nat Commun 2020, 11(1): 2035.
- Seitz M, Melendez M, Alcazar-Cano N, Congreve DN, Delgado-Buscalioni R, Prins F. Mapping the Trap-State Landscape in 2D Metal-Halide Perovskites Using Transient Photoluminescence Microscopy. Adv Opt Mater 2021, 9(18).
- Folie BD, Tan JA, Huang JM, Sercel PC, Delor M, Lai ML, et al. Effect of Anisotropic Confinement on Electronic Structure and Dynamics of Band Edge Excitons in Inorganic Perovskite Nanowires. J Phys Chem A 2020, 124(9): 1867–1876.
- He H, Yu Q, Li H, Li J, Si J, Jin Y, et al. Exciton localization in solution-processed organolead trihalide perovskites. Nat Commun 2016, 7(1): 10896.
- Zhang T, Zhou C, Feng X, Dong N, Chen H, Chen X, et al. Regulation of the luminescence mechanism of two-dimensional tin halide perovskites. Nat Commun 2022, 13(1): 60.
- Lichtenegger MF, Drewniok J, Bornschlegl A, Lampe C, Singldinger A, Henke NA, et al. Electron–Hole Binding Governs Carrier Transport in Halide Perovskite Nanocrystal Thin Films. ACS Nano 2022, 16(4): 6317–6324.
- Yao EP, Bohn BJ, Tong Y, Huang H, Polavarapu L, Feldmann J. Exciton Diffusion Lengths and Dissociation Rates in CsPbBr3 Nanocrystal–Fullerene Composites: Layer-by‐Layer versus Blend Structures. Adv Opt Mater 2019, 7(8).
- Akkerman QA, Nguyen TP, Boehme SC, Montanarella F, Dirin DN, Wechsler P, et al. Controlling the nucleation and growth kinetics of lead halide perovskite quantum dots. Science 2022, 377(6613): 1406–1412.
- Dong Y, Qiao T, Kim D, Parobek D, Rossi D, Son DH. Precise control of quantum confinement in cesium lead halide perovskite quantum dots via thermodynamic equilibrium. Nano letters 2018, 18(6): 3716–3722.
Acknowledgments
This project was funded by the European Research Council Horizon 2020 through the ERC Grant Agreement PINNACLE (759744), by the Deutsche Forschungsgemeinsschaft (DFG) under Germany's Excellence Strategy EXC 2089/1-390776260 and by the Bavarian State Ministry of Science, Research and Arts through the grant "Solar Technologies go Hybrid (SolTech)".
Author Contributions
A. J. B. and M. F. L. contributed equally to this work. A. J. B. and M. F. L designed the study.
M. F. L. led the experimental work and processing of experimental data. A. J. B. set up the diffusion measurement technique with the assistance of M. F. L.. L. L. and M. F. L. performed the Monte Carlo simulations. C. L. and M. I. B. prepared the perovskite materials. A. S. U. and
M. V. K. supervised the project. A. J. B., M. F. L. and A. S. U. wrote the original draft of the paper.
Competing Interests
The authors declare no competing interests.
Additional Information
Supplementary information is online
There is NO Competing Interest.
- GraphicalAbstract.jpg
- BornschlegletalSI.docx
Supplementary Information for Dark-Bright Exciton Splitting Dominates Low-Temperature Diffusion in Halide Perovskite Nanocrystal Assemblies