3.1 Morphology and Structural Characterization
ZnO-SnO2 structures exhibited a belt-type morphology, as shown in the SEM image in Fig. 1a. The belt morphology resulted from the differences in solvent evaporation and higher affinity of additive polymers toward one of the co-solvent components [10–11]. The present work used a co-solvent comprising ethanol (fast evaporating) and DMF (slow evaporating) solvents. During electrospinning, Zn2+ and Sn4+ ions migrate with the evaporating co-solvent, and the migration intensifies with the stretching of the electrospun fibers by the applied electric field. Fast evaporation of ethanol relative to DMF creates a dry layer on the fiber surface, unstable to maintain the integrity of the cylindrical morphology. The formed ribbon-like structure gradually transforms into a belt when the entrapped DMF evaporates. SEM images shown in Fig. 1a-c show the morphologies of 10% ZnO-SnO2 BLs, 20% ZnO-SnO2 BLs and 30% ZnO-SnO2 BLs achieved after calcining the as-synthesized belts. The TEM image of the 20% ZnO-SnO2 BLs in Fig. 1d and the magnified image in Fig. 1e confirm the formation of numerous small surface pores during calcination. High-resolution TEM (HRTEM) analysis of the 20% ZnO-SnO2 BLs showed the existence of separated phases of ZnO and SnO2 (Fig. 1f). The lattice fringes of 0.282 nm in the HRTEM image matched well with the crystallographic (100) planes of hexagonal wurtzite (zincite) ZnO, whereas the fringes spaced at 0.266 and 0.345 nm matched the (101) and (110) planes of the tetragonal cassiterite structure of SnO2, respectively [7]. Energy-dispersive X-ray spectroscopy (EDS) analysis showed that the calcined samples were composed of homogeneously distributed Zn, Sn, and O elements throughout the belt structure, with no noticeable impurities (Fig. 1g).
Thermogravimetric and differential scanning calorimetry (TG/DSC) analyses were conducted by heating the as-spun belts in air from room temperature to 800°C at a heating rate of 5°C/min (Fig. 2a). Weight loss below 150°C was ascribed to the evaporation of unbound moisture and loss of water molecules from the precursors contained in the belts. The exothermic peak from 180 to 320°C resulted from the thermal decomposition of polyvinylpyrrolidone and anhydrous zinc acetate in forming ZnO [12]. The observed exothermic peak from 320 to 480°C resulted from the thermal decomposition of stannous chloride during the formation of the SnO2 nanocrystals [13–14]. In a temperature range of 480–510°C, the weight loss was due to the decomposition of organic residues in the belts. Beyond 550°C, the weight loss remained stable, suggesting a complete removal of organic residues from the precursors and polyvinylpyrrolidone. Microstructural XRD characterization was conducted over 2θ = 20 − 80° to examine the phases of ZnO-SnO2 BLs. As shown in Fig. 2b, 10% ZnO-SnO2 BLs and 20% ZnO-SnO2 BLs indicated diffraction peaks ascribed to cassiterite SnO2 (JCPDS No. 41-4145). The absence of ZnO peaks was due to a smaller amount of ZnO. The XRD patterns of 30% ZnO-SnO2 BLs were indexed to a mixture of hexagonal wurtzite ZnO (JCPDS no. 36-1451) and tetragonal cassiterite SnO2 (JCPDS no. 41-1445). Diffraction patterns ascribed to (100) and (101) of zincite ZnO were detected in 30% ZnO-SnO2 BLs, with no traces of Zn2SnO3 or Zn2SnO4 ternary phases. The SnO2 crystallite sizes were estimated using the Scherrer equation (D = 0.9λ/βcosθ, where D is the average crystallite size, λ is the X-ray wavelength equal to 0.15406 nm, β is the Bragg angle, and θ is the full width at half maximum of the X-ray diffraction liner) based on the (100), (101) and (211) planes. The average crystallite sizes were 14.3, 9.2, and 11.5 nm for 10% ZnO-SnO2 BLs, 20% ZnO-SnO2 BLs, and 30% ZnO-SnO2 BLs, respectively. The results showed that the crystallite size decreased with the amount of ZnO. Crystallite sizes of ZnO were larger than for SnO2 due to the crystallization of ZnO before SnO2, and the associated inhibition of the SnO2 crystal growth [15].
XPS provided information on the chemical composition and binding states of ZnO-SnO2 BLs. The spectrum of Zn 2p was fitted by two peaks at 1021.84 and 1044.86 eV for Zn 2p3/2 and Zn 2p1/2 of ZnO, respectively (Fig. 3a) [7]. The splitting of the Sn 3d XPS spectrum into symmetric Sn 3d3/2 and Sn 3d5/2 spectral peaks was evident at 494.84 and 486.45 eV, respectively, and was assignable to the doublet signature of Sn4+ in SnO2 (Fig. 3b) [16]. As shown in Fig. 3c, the O 1s peak of oxygen was deconvoluted into three Gaussian peaks at 530.3 eV corresponding to O2− of lattice oxygen in ZnO and SnO2 crystals, 531.2 eV for chemisorbed O− and 532.6 eV for physisorbed O2− species [17]. The findings were consistent with the results of XRD, TEM and EDS maps of ZnO-SnO2 BLs. The absence of other chemical states of Sn and Zn indicated that no impurities were incorporated into the lattice of ZnO and SnO2.
3.2 GasSensing Results
The gas-sensing performance of ZnO–SnO2 BLs was investigated at a temperature range of 350–450°C. For the 10% ZnO-SnO2 BLs and 20% ZnO-SnO2 BLs, maximum response (Ra/Rg) at 5 ppm H2 gas was observed at a temperature of 400°C. The response of the 10% ZnO-SnO2 BLs, 20% ZnO-SnO2 BLs, and 30% ZnO-SnO2 BLs to 5 ppm of H2 at 400°C was 5.2, 6.7, and 4.1, respectively (Fig. 4a). The 30% ZnO-SnO2 BLs did not respond to H2 at 350°C because their baseline resistance exceeded the capacity of the sensing instrument. The results indicated that optimal ZnO loading was 20 mol% for enhanced sensing at 400°C in dry condition. Before sensing tests, ZnO-SnO2 BLs were exposed to air for 3.5 h to stabilize the baseline resistances at each operating temperature. The baseline resistances in air at 400°C are shown in Fig. 4b. The resistances stabilized approximately within 2.5 h of exposure to air. The baseline resistances of 10% ZnO-SnO2 BLs, 20% ZnO-SnO2 BLs, and 30% ZnO-SnO2 BLs were 6.15, 6.4, and 7.18 MΩ, respectively. The increase in the baseline resistance of the ZnO-SnO2 BLs with the amount of ZnO was attributed to intrinsic defects and low carrier concentration in ZnO [18]. The base resistances of the ZnO-SnO2 BLs decreased upon exposure to H2 and increased upon exposure to air, suggesting that the ZnO-SnO2 BLs exhibited an n-type property. The H2 sensing transients of 10% ZnO–SnO2 BLs, 20% ZnO–SnO2 BLs, and 30% ZnO–SnO2 BLs at 400°C in dry conditions are shown in Fig. 4c. The H2 response decreased monotonically with the decrease in H2 concentration. The response and recovery times were determined from the graph of normalized sensor resistance at ΔR/ΔRmax = 0.9 and ΔR /ΔRmax = 0.1, where ΔR is the instantaneous change in resistance relative to the base resistance, and ΔRmax is the difference between the sensor base resistance in air and the minimum resistance upon H2 exposure. The 20% ZnO-SnO2 BLs sensor exhibited the fastest response (3.6 sec) upon exposure to 5 ppm of H2, compared to 10% ZnO-SnO2 BLs (7.6 sec) and 30% ZnO-SnO2 BLs (6.3 sec), as shown in Fig. 4d. The recovery times were 83.1, 94.2, and 56.7 sec for 10% ZnO-SnO2 BLs, 20% ZnO-SnO2 BLs, and 30% ZnO-SnO2 BLs, respectively (Fig. 4e).
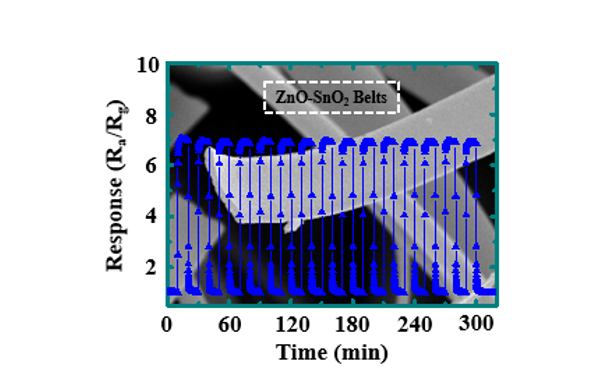
The determination of sensor selectivity is critical for their potential application. The response of the 20% ZnO-SnO2 BLs to formaldehyde (HCHO), methane (CH4), ammonia (NH3), carbon monoxide (CO), and carbon dioxide (CO2) was also determined at 400°C to ascertain the cross-sensitivity of the sensor. Figure 4f shows the response of the sensor to 5 ppm of H2 and interfering gases at 400°C. The response of the 20% ZnO-SnO2 BLs (Ra/Rg = 6.7) to H2 was higher than HCHO, CH4, NH3, CO, and CO2. A 1.3- and 1.47-fold decrease in response of 20% ZnO-SnO2 BLs toward 5 ppm H2 was observed when the relative humidity (RH) increased to 55 and 80%, respectively, at 400°C (Fig. 5a). The results showed a small difference in response at 55 and 80% RH. The difference can be explained by the desorption of moisture from ZnO-SnO2 belts surfaces at 400°C, in agreement with reported findings [13]. The 20% ZnO-SnO2 BLs showed a repeatability of response for 15 cycles of H2 exposure (5 ppm) at 400°C in dry condition (Fig. 5b), suggesting that the sensor can achieve stable H2 sensing measurements.
Hydrogen-sensing performance of ZnO-SnO2 BLs can be explained by the ZnO–SnO2 heterojunctions, surface electron depletion, and grain boundary mechanisms. In air, the oxygen molecules chemisorb in the vacant oxygen sites of ZnO and SnO2 grain surfaces because of their high electron affinity (Eq. 1). The chemisorption of oxygen enlarges the electron-depleted region of ZnO and SnO2 grains, increasing the resistance and bending of the energy band. The smaller crystallite size (9.2 nm) of SnO2 in 20% ZnO-SnO2 BLs implies that the crystallites can be entirely depleted of electrons when exposed to air. H2 reacts with the chemisorbed oxygen to decrease the electron-depleted region and the inter-grain resistance to electron flow (Eq. 2) [19]. At the ZnO-SnO2 interface, electrons can transfer from SnO2 (work function Φ = 4.9 eV) to ZnO (work function Φ = 5.2 eV) to equilibrate the Fermi levels, followed by charge redistribution and band bending at the interface [20]. The resulting potential barrier prevents further transport of charge carriers across the ZnO–SnO2 interface. The consumption of electrons at the n-n heterojunction and in the electron accumulation (ZnO) and depleted (SnO2) regions by H2 increases the response. The metallization ZnO by H2 further reduces the resistance at the ZnO–SnO2 interface and offers selectivity to H2 [6]. Metallization of ZnO is caused by back-donation of electrons from neighboring O atoms to the Zn 4s states after adsorption of H2 on ZnO [21].
O2 (g) + 2e– → 2O–(ads) (1)
H2 (ads) + O− → H2O + e − (2)
In addition, H2 exhibits a smaller kinetic diameter (0.29 nm) [22], compared to HCHO (0.37 nm) [23], CH4 (0.38 nm) [24], NH3 (0.33 nm) [23], CO (0.376 nm) [25], and CO2 (0.33 nm) [26]. As a result, nanopores in ZnO–SnO2 BLs favor the diffusion of H2 molecules by molecular sieving effect, resulting in a high H2 response [27].