Animals
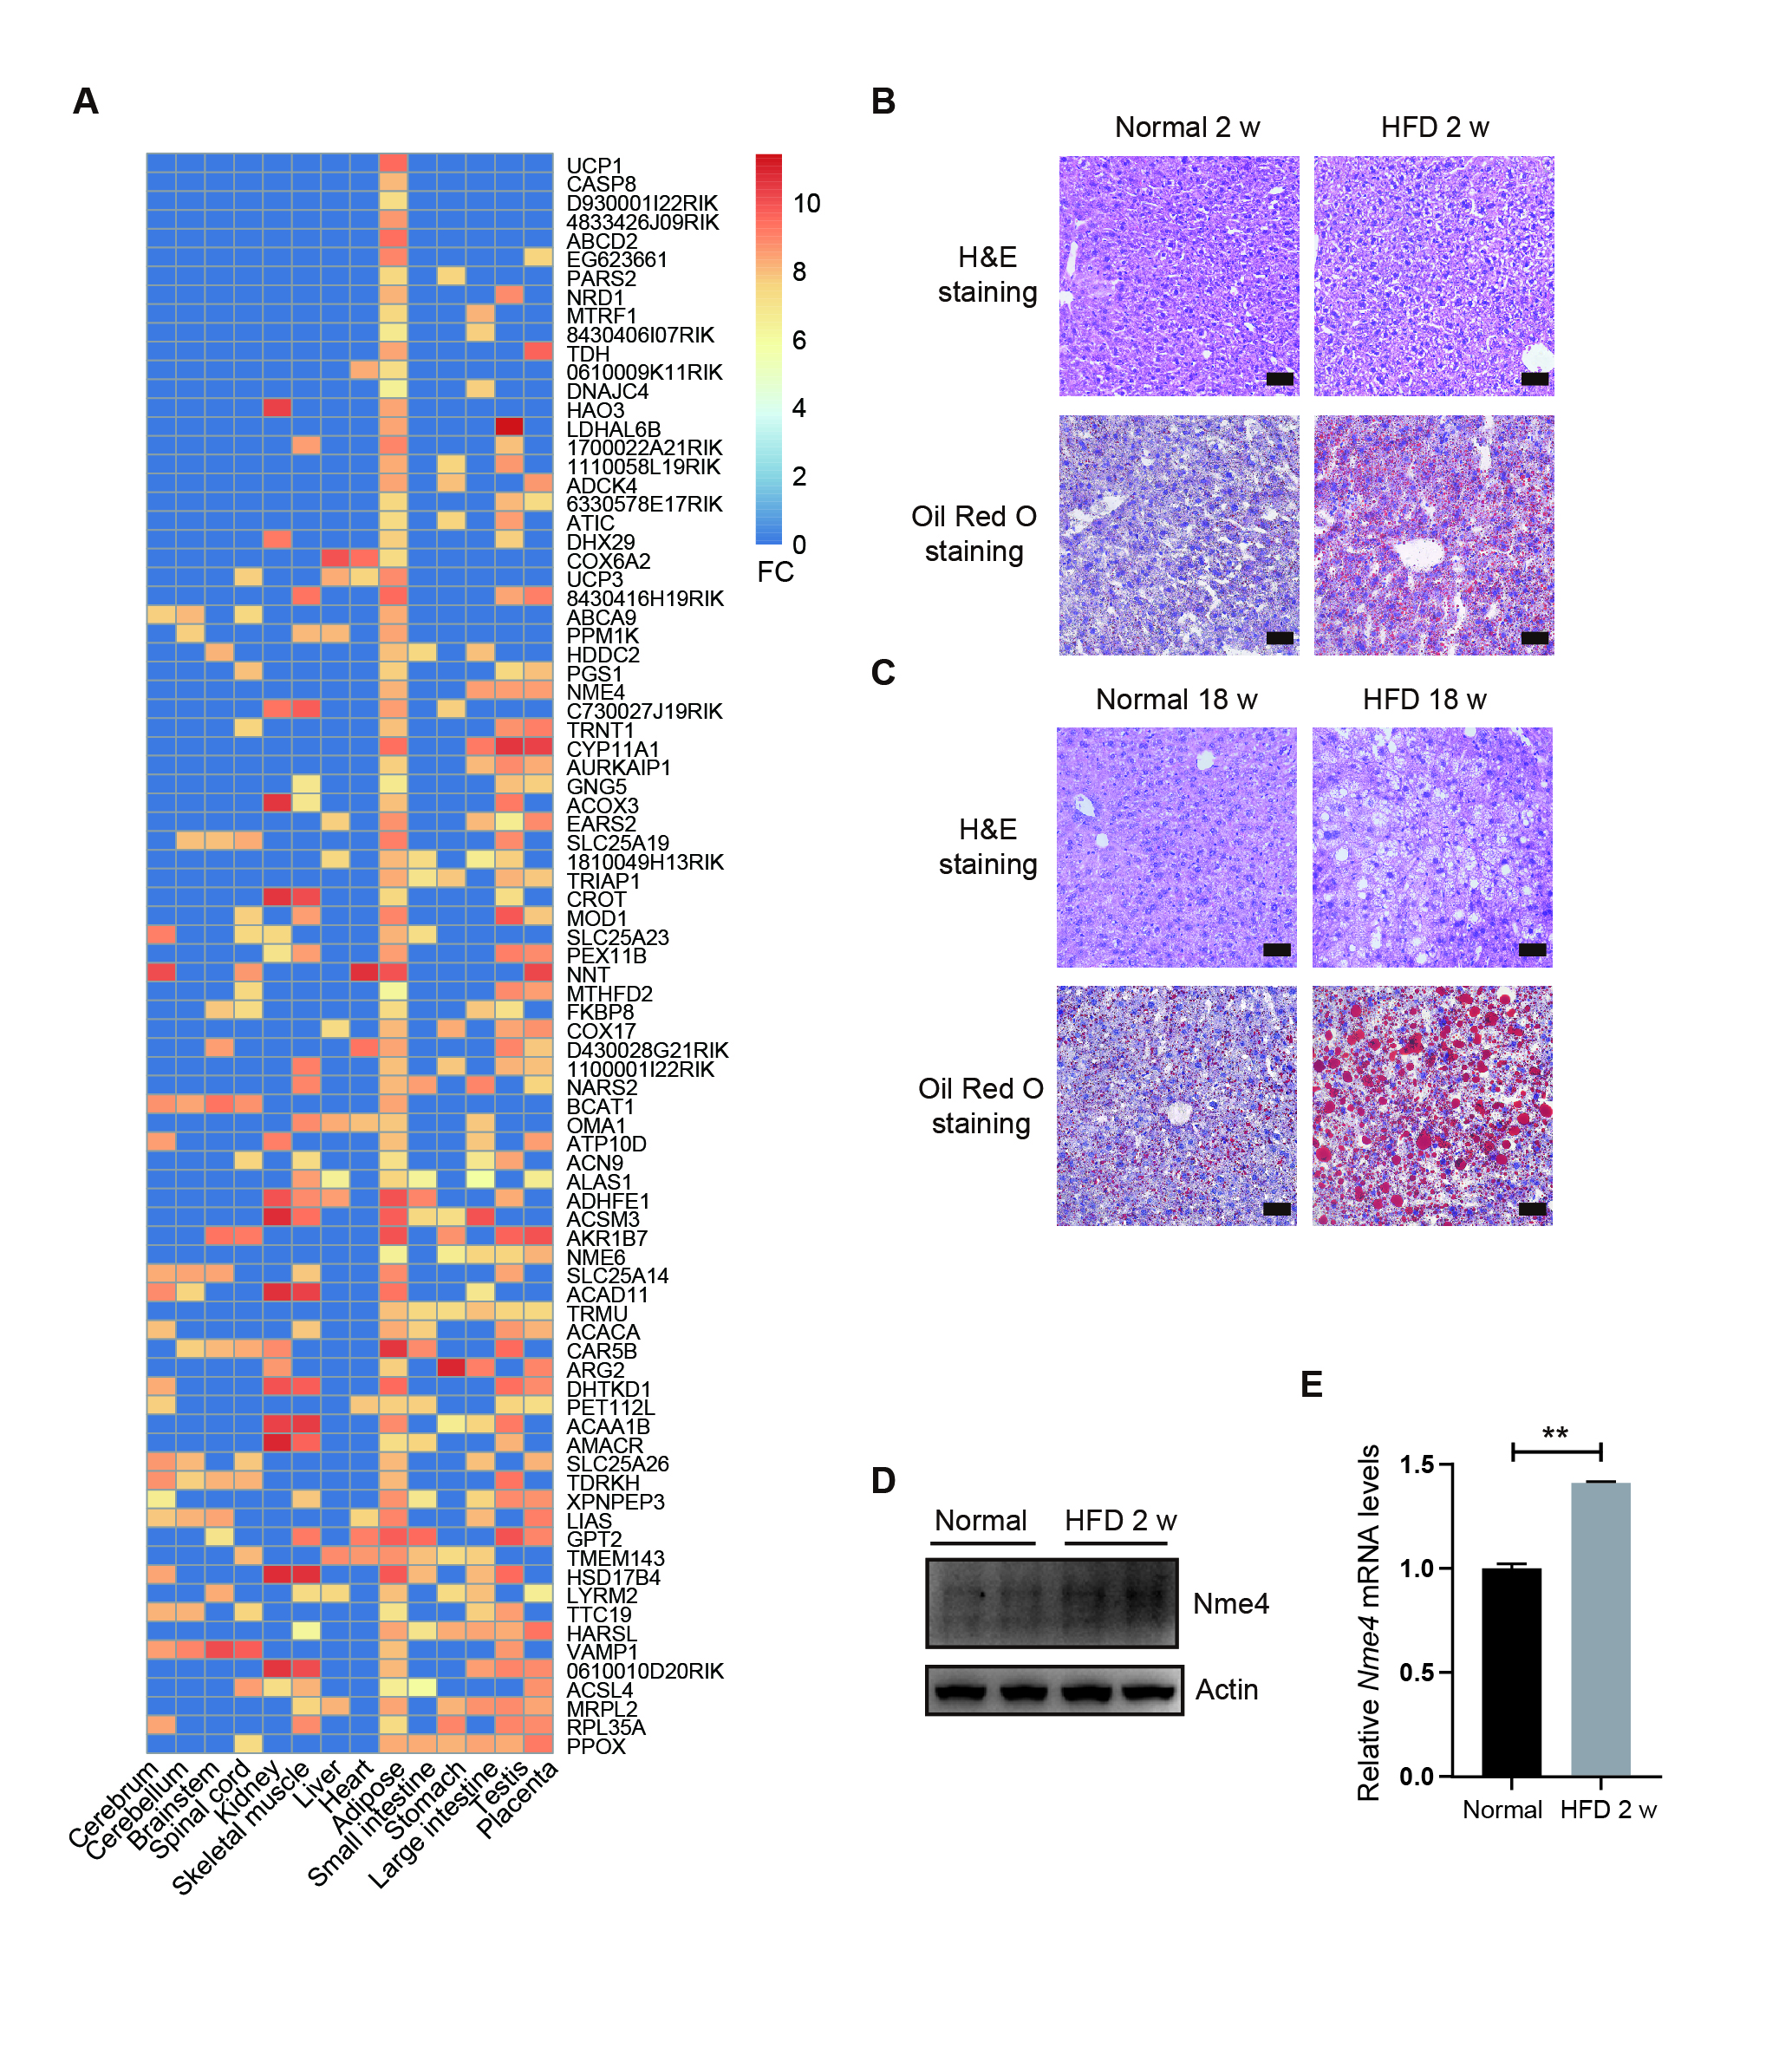
All the animal experiments were performed in accordance with a protocol that was approved by the Institutional Animal Care and Use Committee of Westlake University. The mice were maintained on a 12/12 h light/dark cycle at 22-26°C with free access to sterile pellet food and water. A mouse model of NAFLD was established by feeding 6- to 8-week-old male C57BL/6J mice a HFD (60 kcal% fat, 20 kcal% protein, 20 kcal% carbohydrate; PD6001; Sysebio, China) for the indicated time periods.
For AAV8 transduction in mice hepatocytes, AAV-NC/AAV-shNme4 (2 × 10¹² genome copies/mouse; Obio Technology, China) was delivered by tail vein injection for 2 weeks, then followed by 12 weeks of HFD feeding. The mice were then sacrificed for analysis. The mouse Nme4 shRNA sequence that was used as follows: 5′- CCTCTGTCAACAAGAAGTCAA -3′.
Cell culture
HEK293T cells (ATCC: CRL-3216), HepG2 cells (ATCC: HB-8065), PLC/PRF/5 cells (ATCC: CRL-8024) and SK-Hep1 cells (ATCC: HTB-52) were purchased from American Type Culture Collection (ATCC, USA). HL-7702, Bel-7402, and SMMC-7721 cells were generous gifts from Dr. Qinfeng Yan, Zhejiang University. Hepa1-6 cells were purchased from Procell Life Science & Technology, China. All the cell lines were maintained in Dulbecco’s modified Eagle’s medium (DMEM, BasalMedia, China) supplemented with 10% fetal bovine serum (FBS, EXCEL, China) and 1% penicillin and streptomycin (Thermo Fisher Scientific, USA) at 37°C in 5% CO2 (v/v).
Plasmid construction, transfection and lentivirus packaging
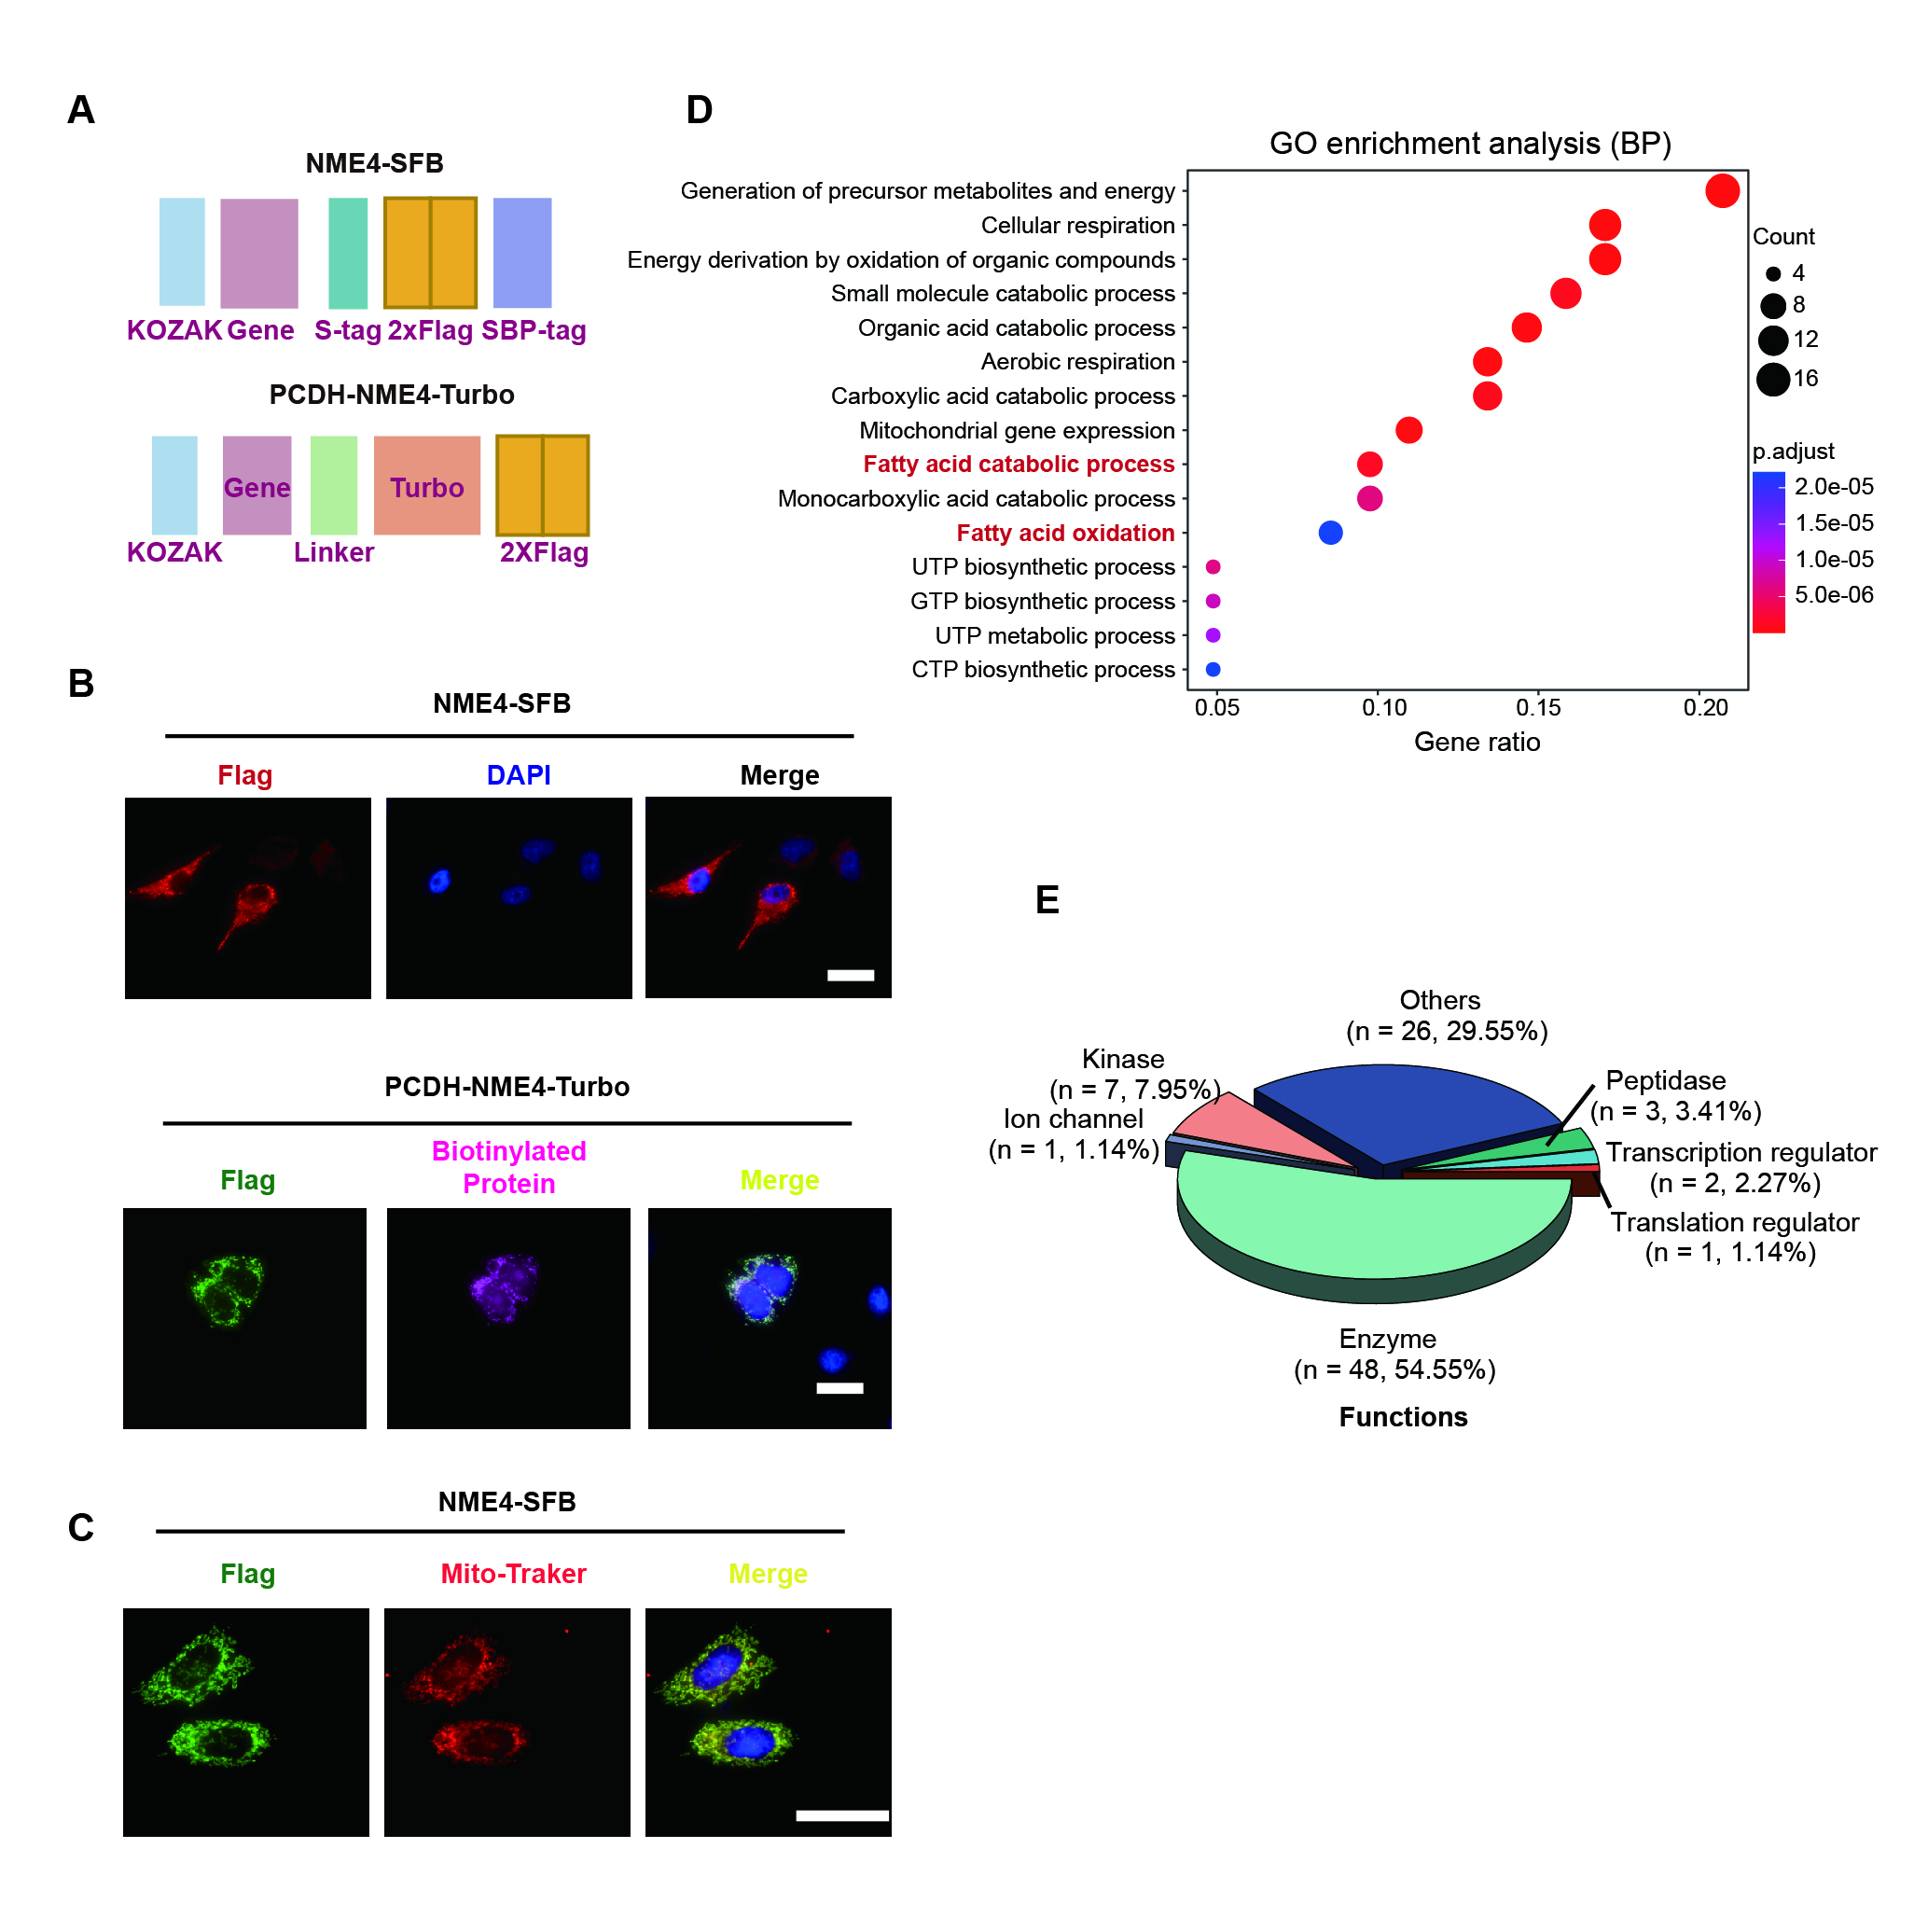
Plasmids encoding the indicated genes were amplified from the cDNA of HEK293T cells using RT‒PCR. For TAP, all the constructs were subcloned into a pDONOR201 vector using Gateway Technology (Thermo Fisher Scientific, USA) and used as entry clones. The entry clones were subsequently recombined into a gateway destination vector for the expression of S-, 2×FLAG-, and streptavidin-binding peptide (SBP)-tandem tag (SFB)–tagged fusion proteins. Gateway-compatible destination vectors with the indicated SFB tag and Myc tag were used to express the various fusion proteins. For TurboID, all the constructs were cloned into the PCDH-MCS-T2A-Puro-MSCV vector using the ClonExpress® II One Step Cloning Kit (Vazyme, China). Plasmid transfection was performed using Polyethylenimine (PEI, Ott Scientific, USA) as the transfection reagent.
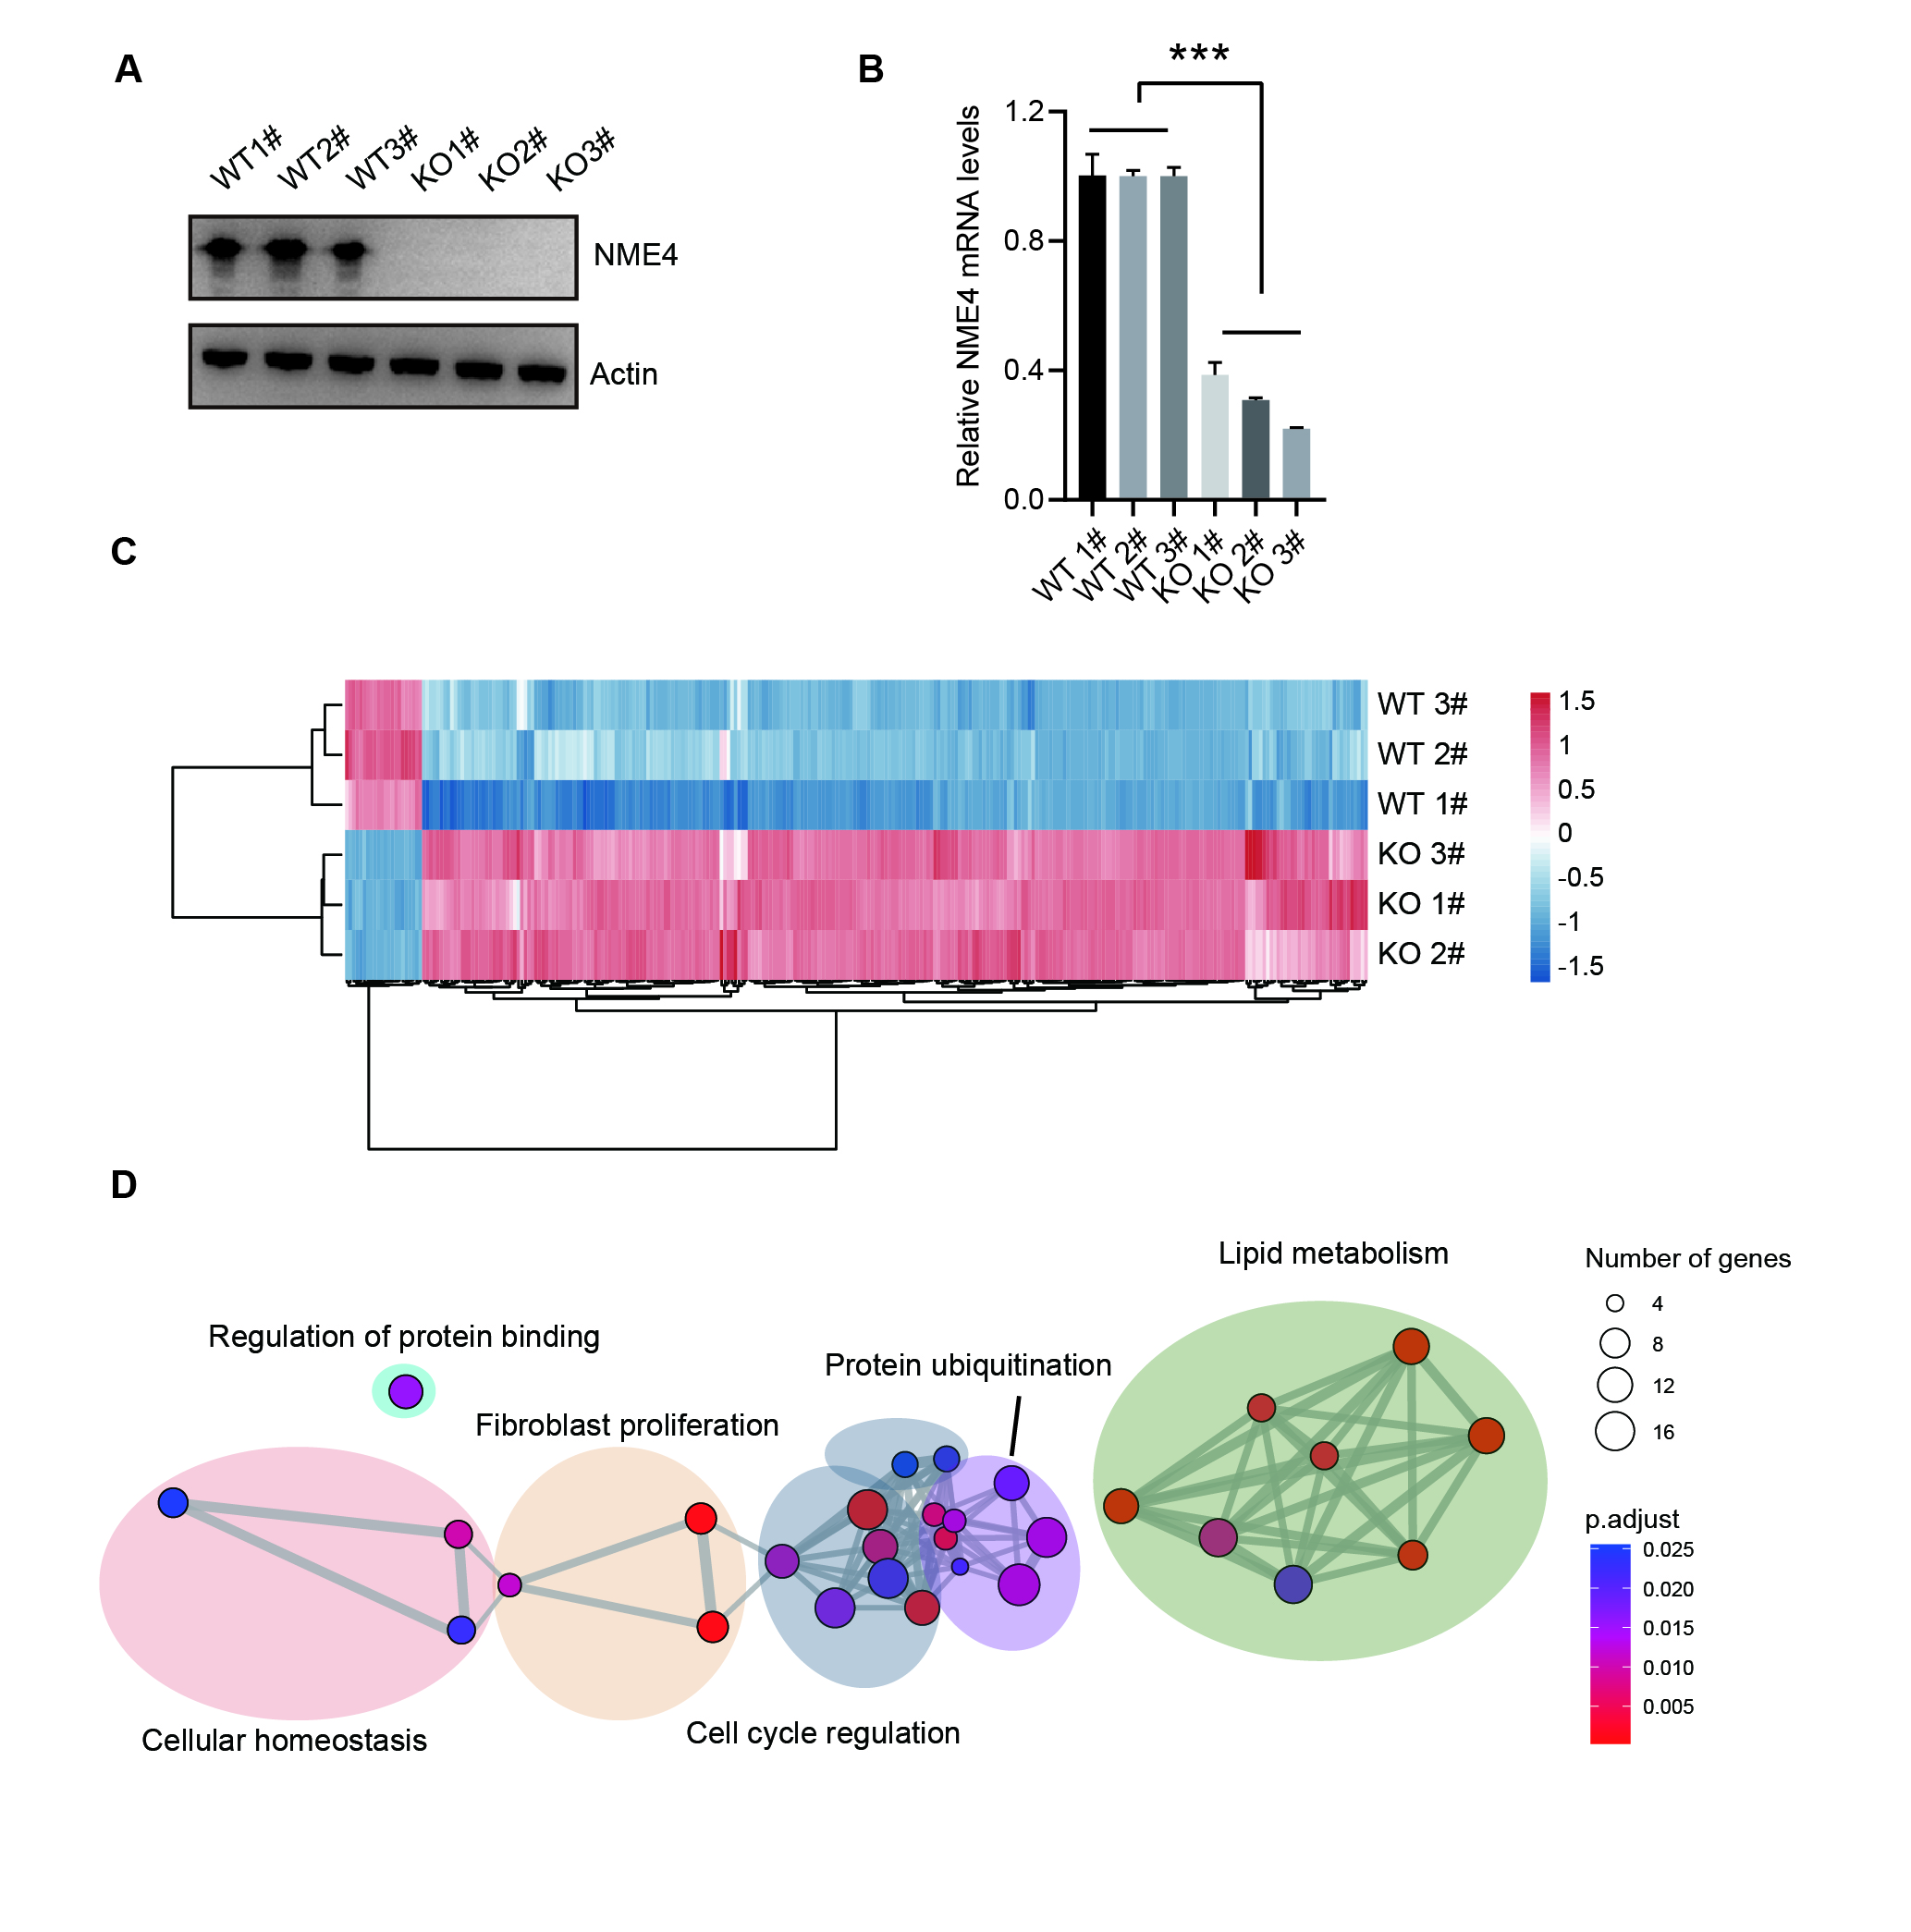
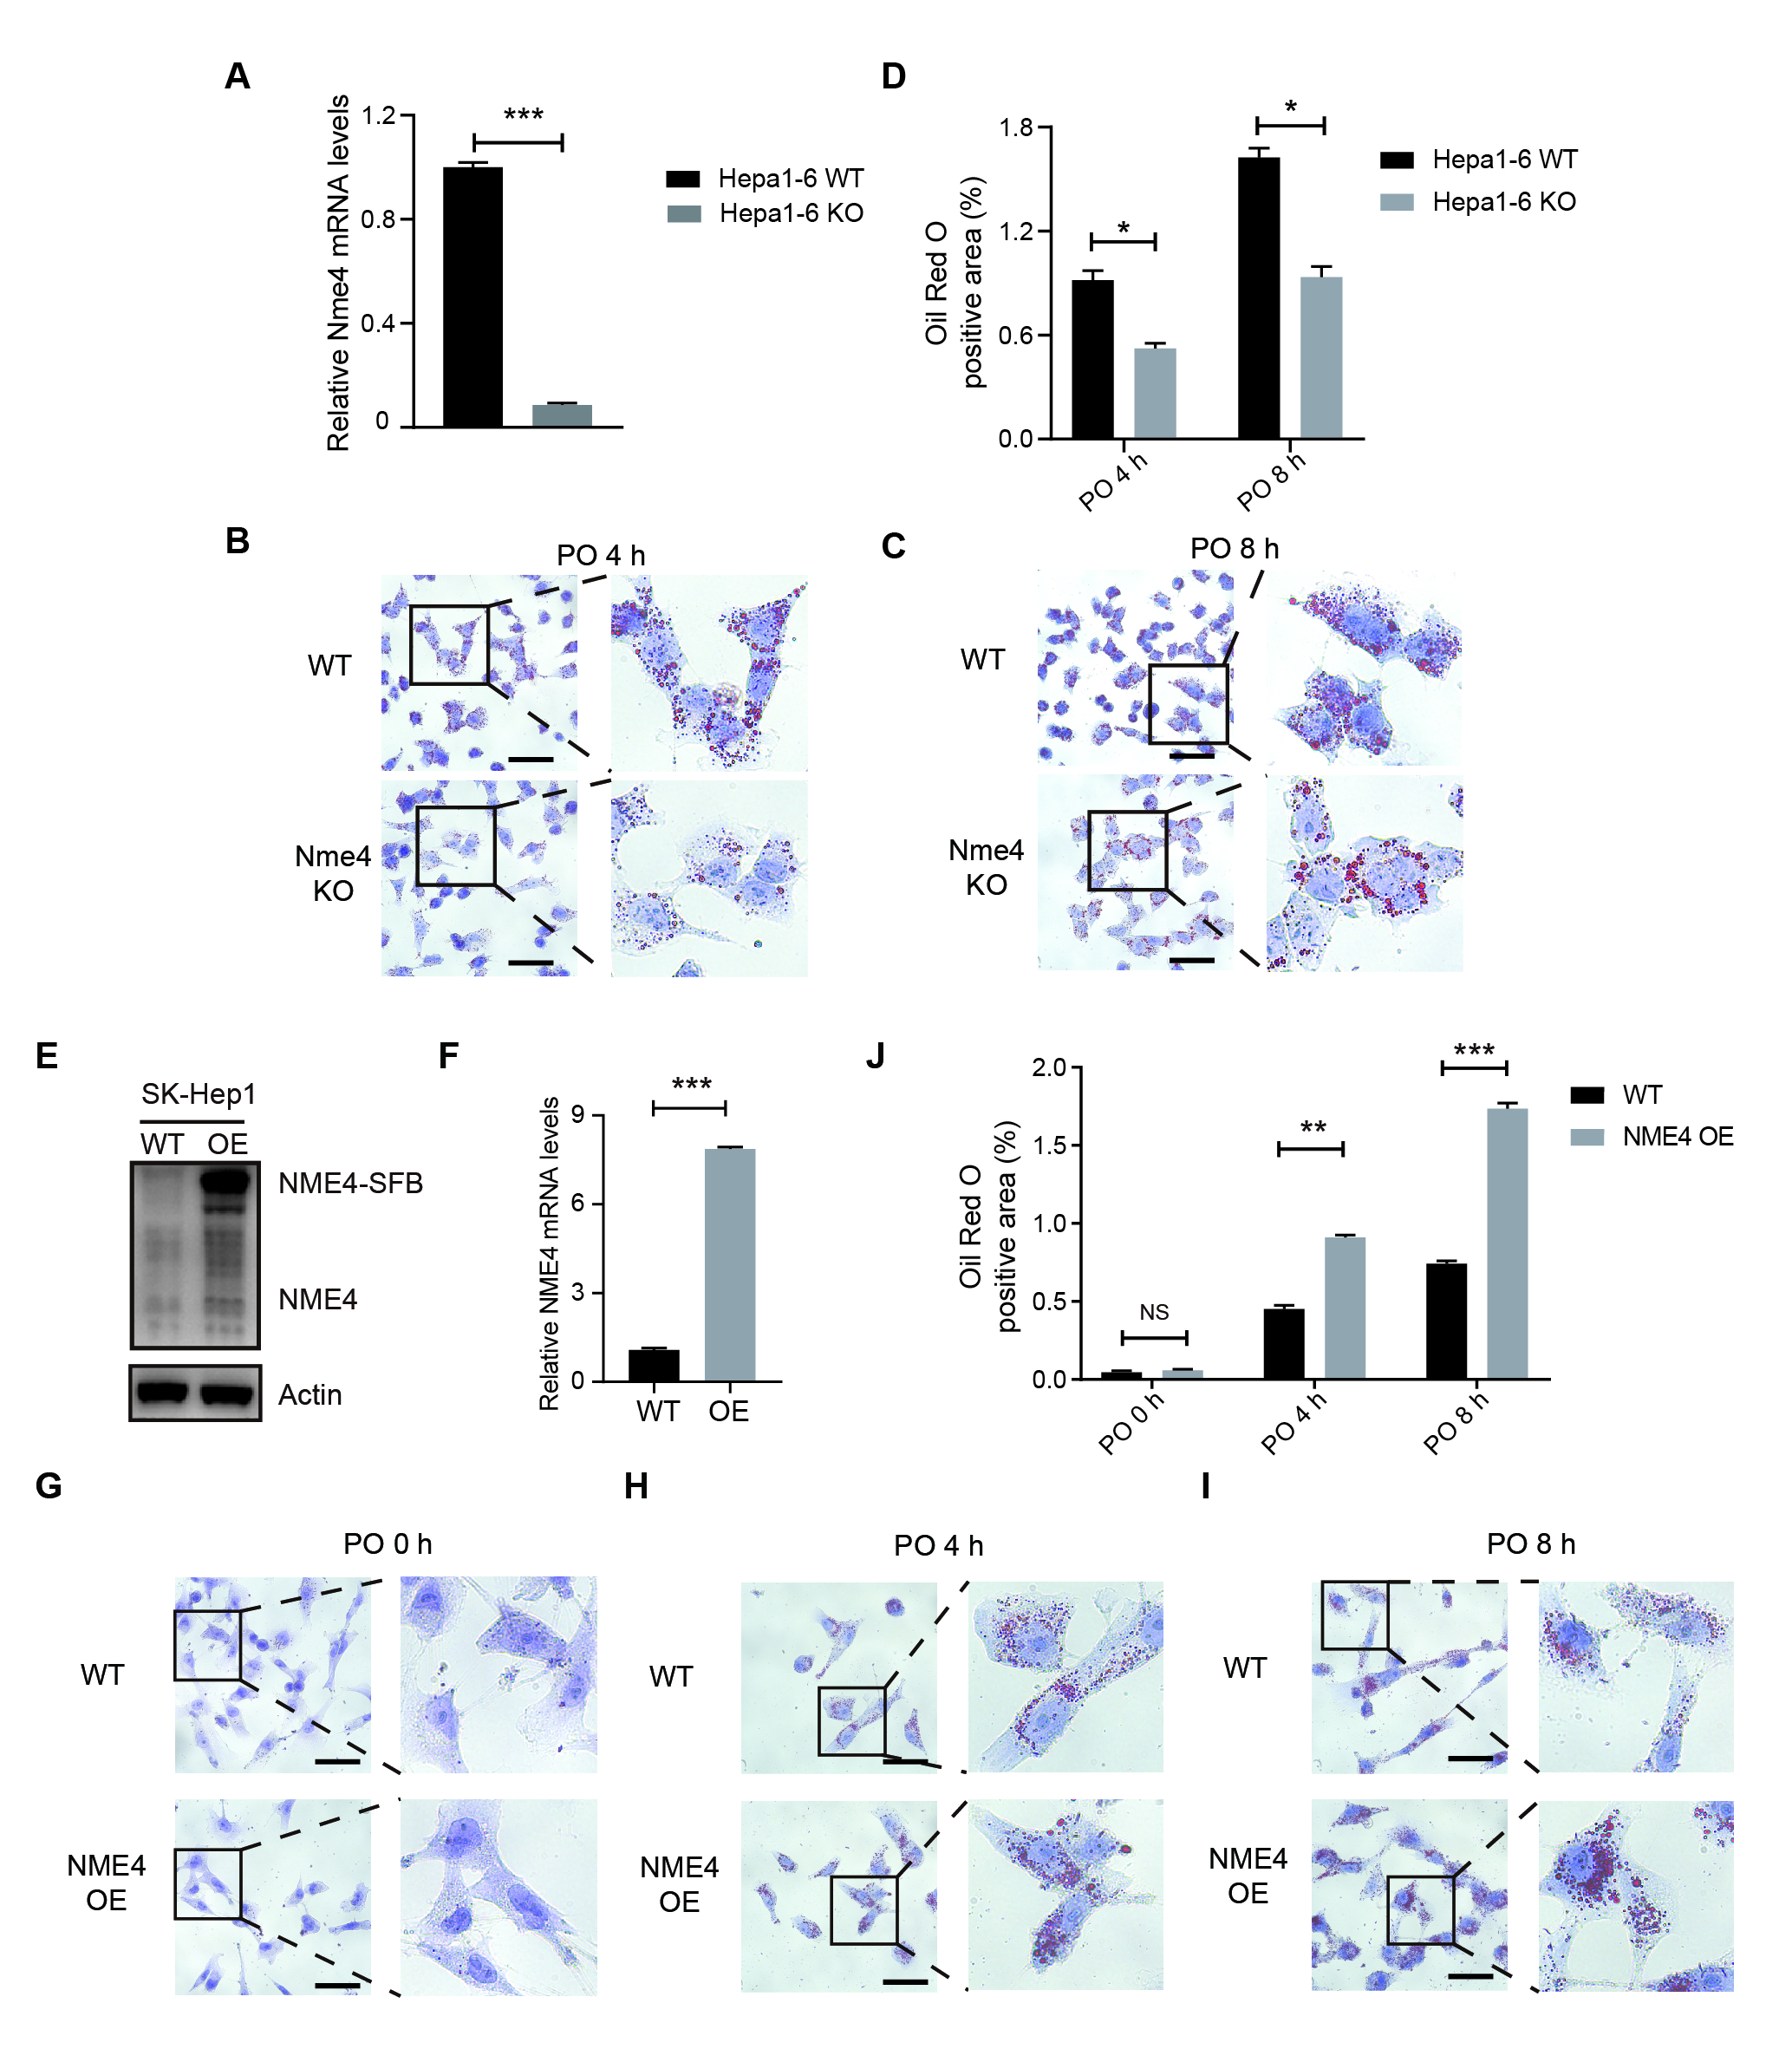
To generate NME4-knockout cells, four distinct single-guide RNAs were designed using the Benchling website (https://benchling.com). The sgRNAs were cloned into a lentiCRISPRv2 vector (Addgene plasmid # 98290) that contains a gRNA scaffold and Cas9, followed by transfection into HEK293T cells with pMD2.G and pSPAX2 to generate lentivirus. Forty-eight hours after transfection, the supernatant was collected and used to infect HEK293T , Bel-7402 and Hepa1-6 cells. Stably transfected cells were selected by incubation with medium supplemented with 2-5 µg/mL puromycin for 2 days. Overexpression or knockout efficiencies were confirmed using Western blotting and qRT-PCR analysis. The human NME4-specific guide sequences that were used are as follows: 5′-CAGGCCCAGAGCTCATGTAG-3′ or 5′-GGTCCTGGTAGTGCTCGGCA-3′.
Western blotting, in cell pull-down and co-immunoprecipitation
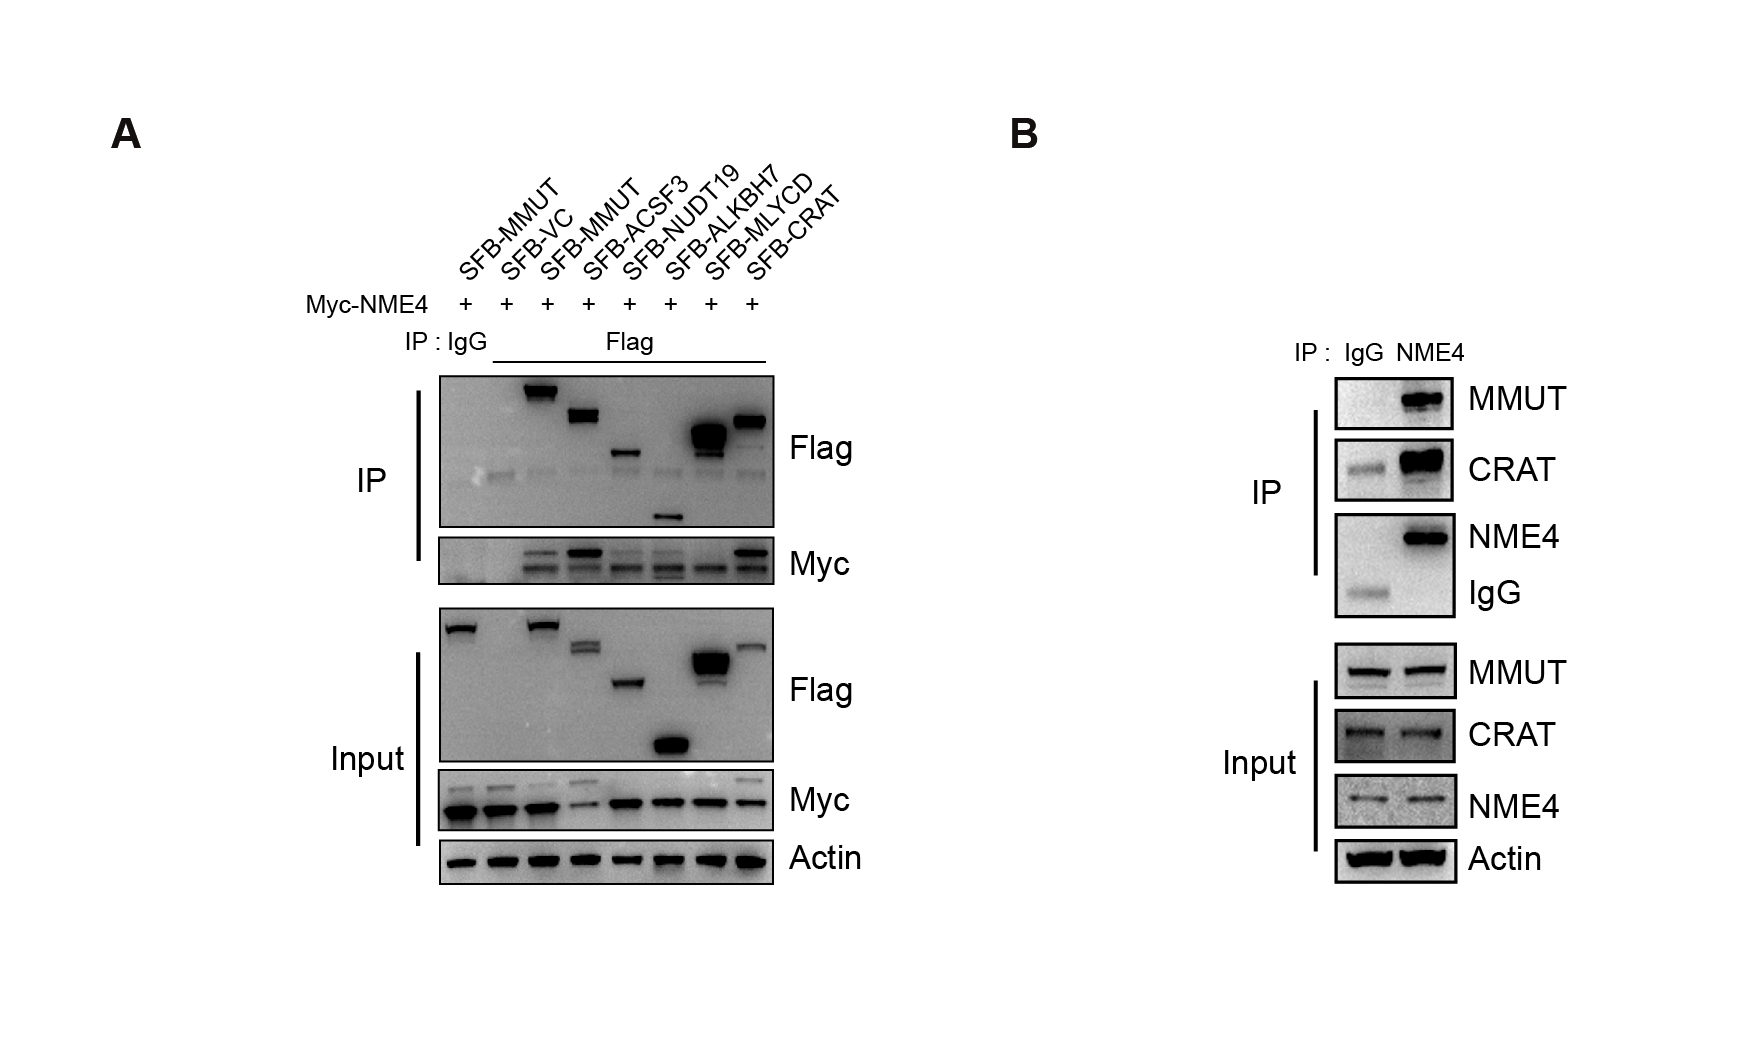
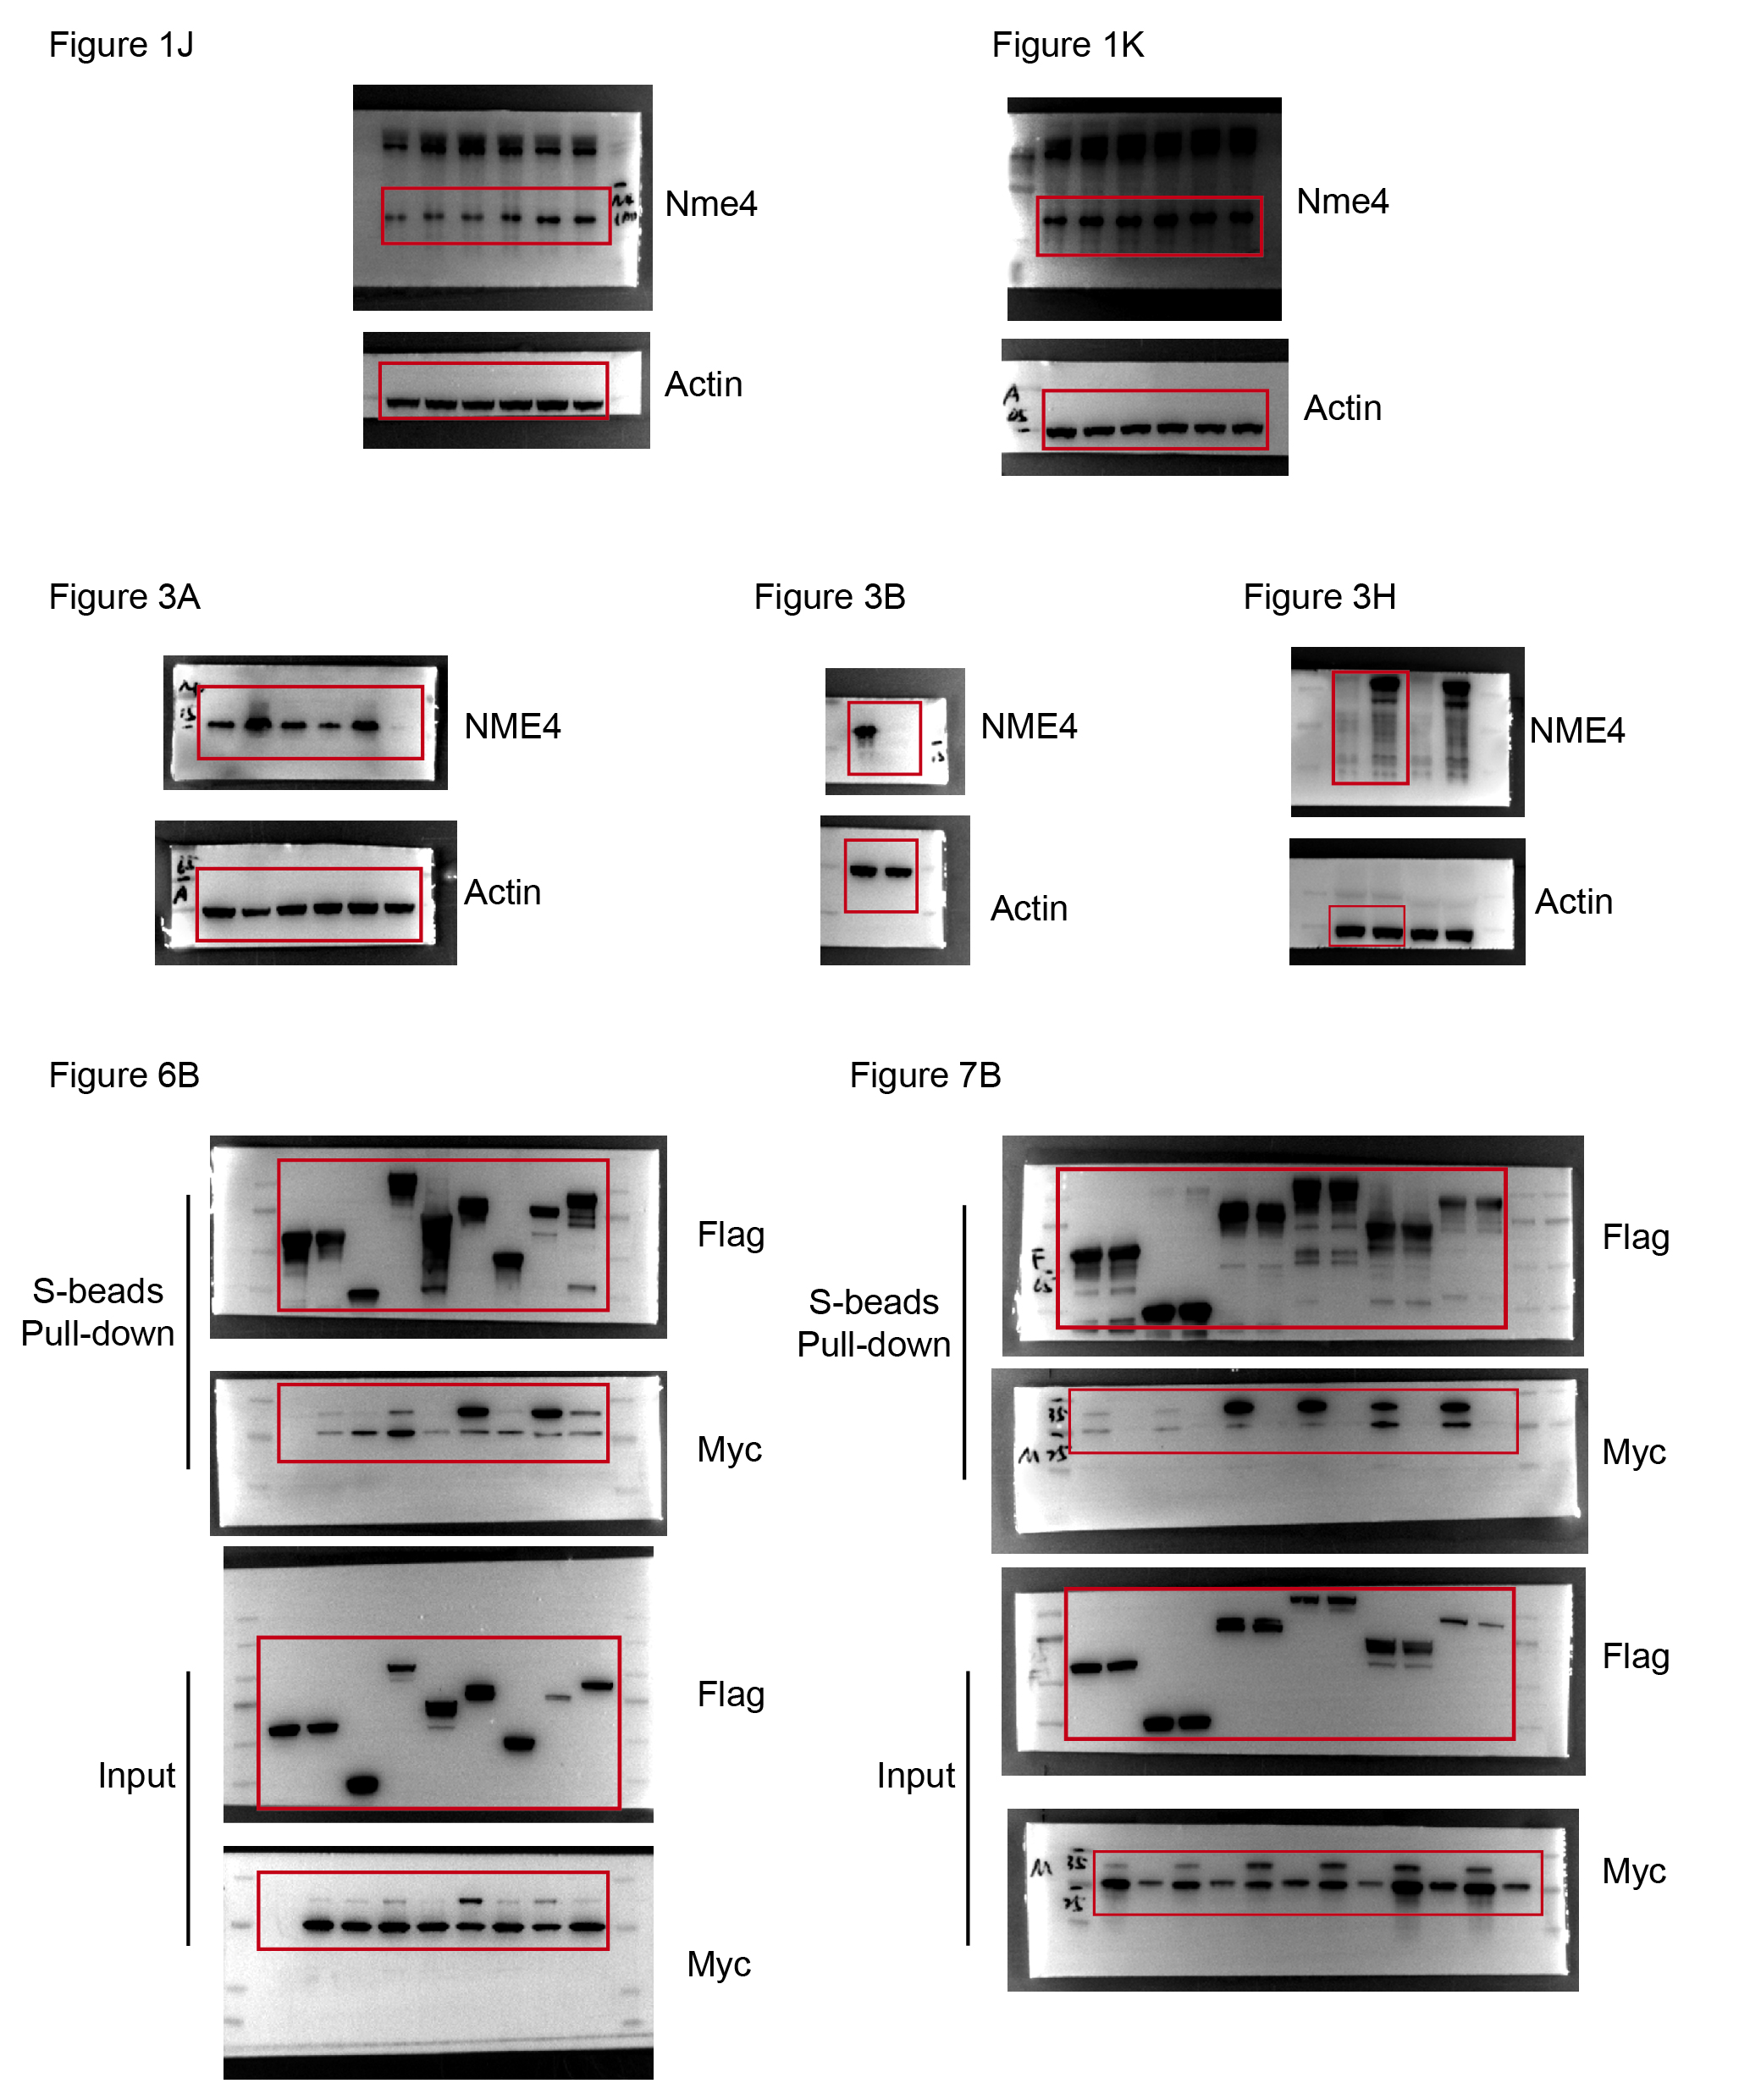
Whole-cell lysates were prepared by lysing cells with NETN buffer (20 mM Tris-HCl, pH 8.0, 100 mM NaCl, 1 mM EDTA, 0.5% Nonidet P-40) on ice for 30 min and then boiling the lysates in 2× Laemmli buffer in a 100°C metal bath for 15 min. The lysates were subjected to SDS‒PAGE followed by immunoblotting with antibodies against various proteins as indicated. The following antibodies were used: anti-Flag (M2) (F1804-1MG, 1:5000) and anti-Streptavidin-HRP (#911, 1:1000) monoclonal antibodies (Sigma‒Aldrich, USA); anti-Myc (M20002, 1:5000) monoclonal antibody (Abmart, China); anti-β-Actin (AC026, 1:10000) polyclonal antibody (Abclonal Technology, China); anti-NME4 (TA501110S, 1:1000) monoclonal antibody (OriGene, China); anti-CRAT (A6365, 1:500) and anti-MMUT (A3969, 1:1000) polyclonal antibodies (Abclonal Technology, China).
For in cell pull-down and co-immunoprecipitation assays, 1 × 10⁷ cells were lysed with NETN buffer on ice for 30 min. The lysates were then incubated with 20 ml of conjugated beads (for SFB-tagged pull-down) for 2 hours at 4°C or incubated with antibodies against endogenous proteins for 2 hours at 4°C, followed by the addition of 20 μl of protein A/G agarose and incubation for 2 hours at 4°C. The beads were washed three times with NETN buffer and boiled in 2 × Laemmli buffer. The lysates were subjected to SDS‒PAGE followed by WB.
Immunofluorescence
For immunofluorescence assays, cells were cultured on coverslips, fixed with 4% paraformaldehyde at 25°C for 15 min, and then permeabilized with 0.5% Triton X-100 in PBS for 5 min. After blocking with 5% bovine serum albumin, the cells were incubated with the indicated primary antibodies for 1 h at 25°C. The cells were then washed with PBS twice and incubated with goat anti-rabbit or goat anti-mouse fluorescently -labeled IgG (1:1000, Abcam, UK) for 1 h. The cells were counterstained with 100 ng/mL 4′,6-diamidino-2-phenylindole (DAPI) staining solution (Sigma‒Aldrich, USA) for 2 min to visualize nuclear DNA. The coverslips were mounted onto glass slides with FluorSave™ Reagent (Millipore, USA) and visualized under an Olympus IX73 Microscope Imaging System (Olympus, Japan).
Purification of NME4-associated protein complexes (TAP and TurboID)
HEK293T cells stably expressing SFB-tagged NDPK proteins were isolated by culturing in medium supplemented with 2 μg/mL puromycin, and their expression of these proteins was validated by immunostaining and Western blotting as described 51. For TAP, HEK293T stable cells were lysed using 5 mL NETN buffer supplemented with protease and phosphatase inhibitors at 4°C for 30 min. The crude lysates were centrifuged at 14,000 × g at 4°C for 15 min. The supernatants were incubated with 100 μL streptavidin-conjugated beads (GE Healthcare, USA) at 4°C for 2 h. The beads were then washed three times with 5 mL NETN buffer, and the bound proteins were eluted twice with 1.5 mL NETN buffer supplemented with 2 mg/mL biotin (Sigma‒Aldrich, USA) at 4°C for 2 h. The eluates were incubated with 30 μL S protein beads (Millipore, USA) at 4°C for 2 h. The beads were then washed three times with 1 mL NETN buffer and subjected to SDS–APGE. Each sample was run into the separation gel for 1 cm so that the whole bands could be excised as one sample for in-gel trypsin digestion and LC‒MS.
For TurboID proximity labeling and affinity purification, HEK293T stable cells were grown to 70% confluence in 10 cm dishes before treatment with 500 μM biotin in the culture medium for 10 min. The cells were collected, and affinity purification was performed as described above.
LC and MS
LC and MS were performed as described previously 51, 52. Briefly, the excised gel bands described above were cut into approximately 1-mm3 pieces, which were then subjected to in-gel trypsin digestion 53 and dried. The samples were reconstituted in 5 ml of high-performance liquid chromatography solvent A (2.5% acetonitrile and 0.1% formic acid). A nanoscale reverse-phase high-performance liquid chromatography capillary column was generated by packing 5-mm C18 spherical silica beads into a fused silica capillary (100 mm inner diameter × ~20 cm length) using a flame-drawn tip. After the column was equilibrated, each sample was loaded onto the column using an autosampler. A gradient was formed, and the peptides were eluted with increasing concentrations of solvent B (97.5% acetonitrile and 0.1% formic acid).
As the peptides were eluted, they were subjected to electrospray ionization and then analyzed by an Orbitrap Fusion Lumos Tribrid Mass Spectrometer (Thermo Fisher Scientific, USA). The source was operated at 1.9 kV, with no sheath gas flow and with the ion transfer tube at 350°C. The data-dependent acquisition mode was used. The survey scan was conducted from m/z 350 to 1,500, with a resolution of 60,000 at m/z 200. The 20 most intense peaks with charge states of 2 and greater were acquired with collision-induced dissociation with a normalized collision energy of 30% and one microscan; the intensity threshold was set to 1,000. MS2 spectra were acquired with a resolution of 15,000. The peptides were detected, isolated, and fragmented to produce a tandem mass spectrum of specific fragment ions for each peptide.
TMT6-plex quantitative proteomics
Cells were lysed in RIPA buffer (50 mm Tris-HCl, pH 7.5, 1 mm EDTA, 150 mm NaCl, 1% N-octylglycoside, 0.1% sodium deoxycholate, complete protease inhibitor mixture) and incubated for 30 min on ice with occasional vortexing. The crude lysates were cleared by centrifugation, and protein concentrations were measured by BCA assay (Thermo Scientific, USA). One hundred micrograms of protein sample was reduced with DTT, alkylated with iodoacetamide, and precipitated by acetone precipitation at -20°C for 2 h. The precipitated protein samples were collected by centrifugation, washed with ethanol twice, redissolved in 200 ml 0.1 M TEAB buffer supplemented with 2 μg trypsin and incubated at 37°C for 16 h. The samples were then repeatedly frozen and thawed in liquid nitrogen to inactivate trypsin. TMT6-plex Isobaric Label Reagent (90061, Thermo, USA) was added to the polypeptide samples at 25°C for 1 h, followed by the addition of hydroxylamine and incubation for 15 min at 25°C. The labeled samples were mixed together, desalted through C18 cartridges and dried in a SpeedVac.
RP-HPLC was performed. Briefly, the first dimension RP separation by micro-LC was performed on a U3000 HPLC System (Thermo Fisher Scientific, USA) by using a BEH RP C18 column (5 μm, 300 Å, 250 mm × 4.6 mm i.d., Waters Corporation, USA). Mobile phase A (2% acetonitrile, adjusted pH to 10.0 using NH3·H2O) and phase B (98% acetonitrile, adjusted pH to 10.0 using NH3·H2O) were used to develop a gradient. The solvent gradient was set to follows: 5–8% B, 1 min; 8–50% B, 6 min; 50–80% B, 14 min; 80–95% B, 1.5 min; 95% B, 7 min; 95–5% B, 2 min; 5% B 5 min. The tryptic peptides were eluted and separated at a flow rate of 1.0 mL/min and monitored at 214 nm. The column oven was set to 45°C. Eluent was collected every 90 s. Forty fractions were collected, and the samples were dried under vacuum and reconstituted in 15 μl of 0.1% (v/v) formic acid.
Fractions from the first dimension RPLC were dissolved with loading buffer and then separated by a C18 column (75 μm inner-diameter, 360 μm outer-diameter × 15 cm, 2 μm C18). Mobile phase A consisted of 0.1% formic acid in water solution, and mobile phase B consisted of 0.1% formic acid in 80% acetonitrile solution; a series of adjusted linear gradients according to the hydrophobicity of fractions eluted in 1D LC with a flow rate of 300 nL/min was applied. The MS conditions were as follows. For Orbitrap Fusion Lumos, the source was operated at 1.9 kV, with no sheath gas flow and with the ion transfer tube at 350°C. The mass spectrometer was programmed to acquire data in data-dependent mode. The survey scan was from m/z 350 to 1500 with a resolution of 60,000 at m/z 200. The 20 most intense peaks with charge state 2 and above were acquired with collision-induced dissociation with a normalized collision energy of 30% and one microscan, and the intensity threshold was set at 1000. The MS2 spectra were acquired with 15,000 resolution. The peptides were detected, isolated, and fragmented to produce a tandem mass spectrum of specific fragment ions for each peptide.
MS data analysis and bioinformatics analysis
MS peptide sequences and protein identity were determined by matching the fragmentation patterns in protein databases using the Mascot software program (Matrix Science, USA). Enzyme specificity was set to partially tryptic with two missed cleavages. The modifications of the peptides included carboxyamidomethyl (cysteines, variable) and oxidation (methionine, variable). The mass tolerance was set to 20 ppm for both precursor ions and fragment ions. The database searched was Swiss-Prot (Homo sapiens). Spectral matches were filtered to maintain the false-discovery rate at less than 1% at the peptide level using the target-decoy method 54, and protein inference was considered following the general rules 55 with manual annotation applied when necessary. This same principle was used for protein isoforms when they were present. Generally, the longest isoform was reported.
AP-MS data analysis was performed using the MUSE algorithm as described previously 32, 37 to assign quality scores to the identified PPIs. Seventy-four unrelated TAP-MS experiments were conducted under identical experimental conditions and were used as controls for the MUSE analysis. An MUSE score was assigned to each identified interaction, and any interacting protein with an MUSE score of at least 0.8 and raw spectral counts greater than 1 was considered to be an HCIP. TurboID-MS data were compared with the unrelated TurboID-MS experiments under identical conditions.
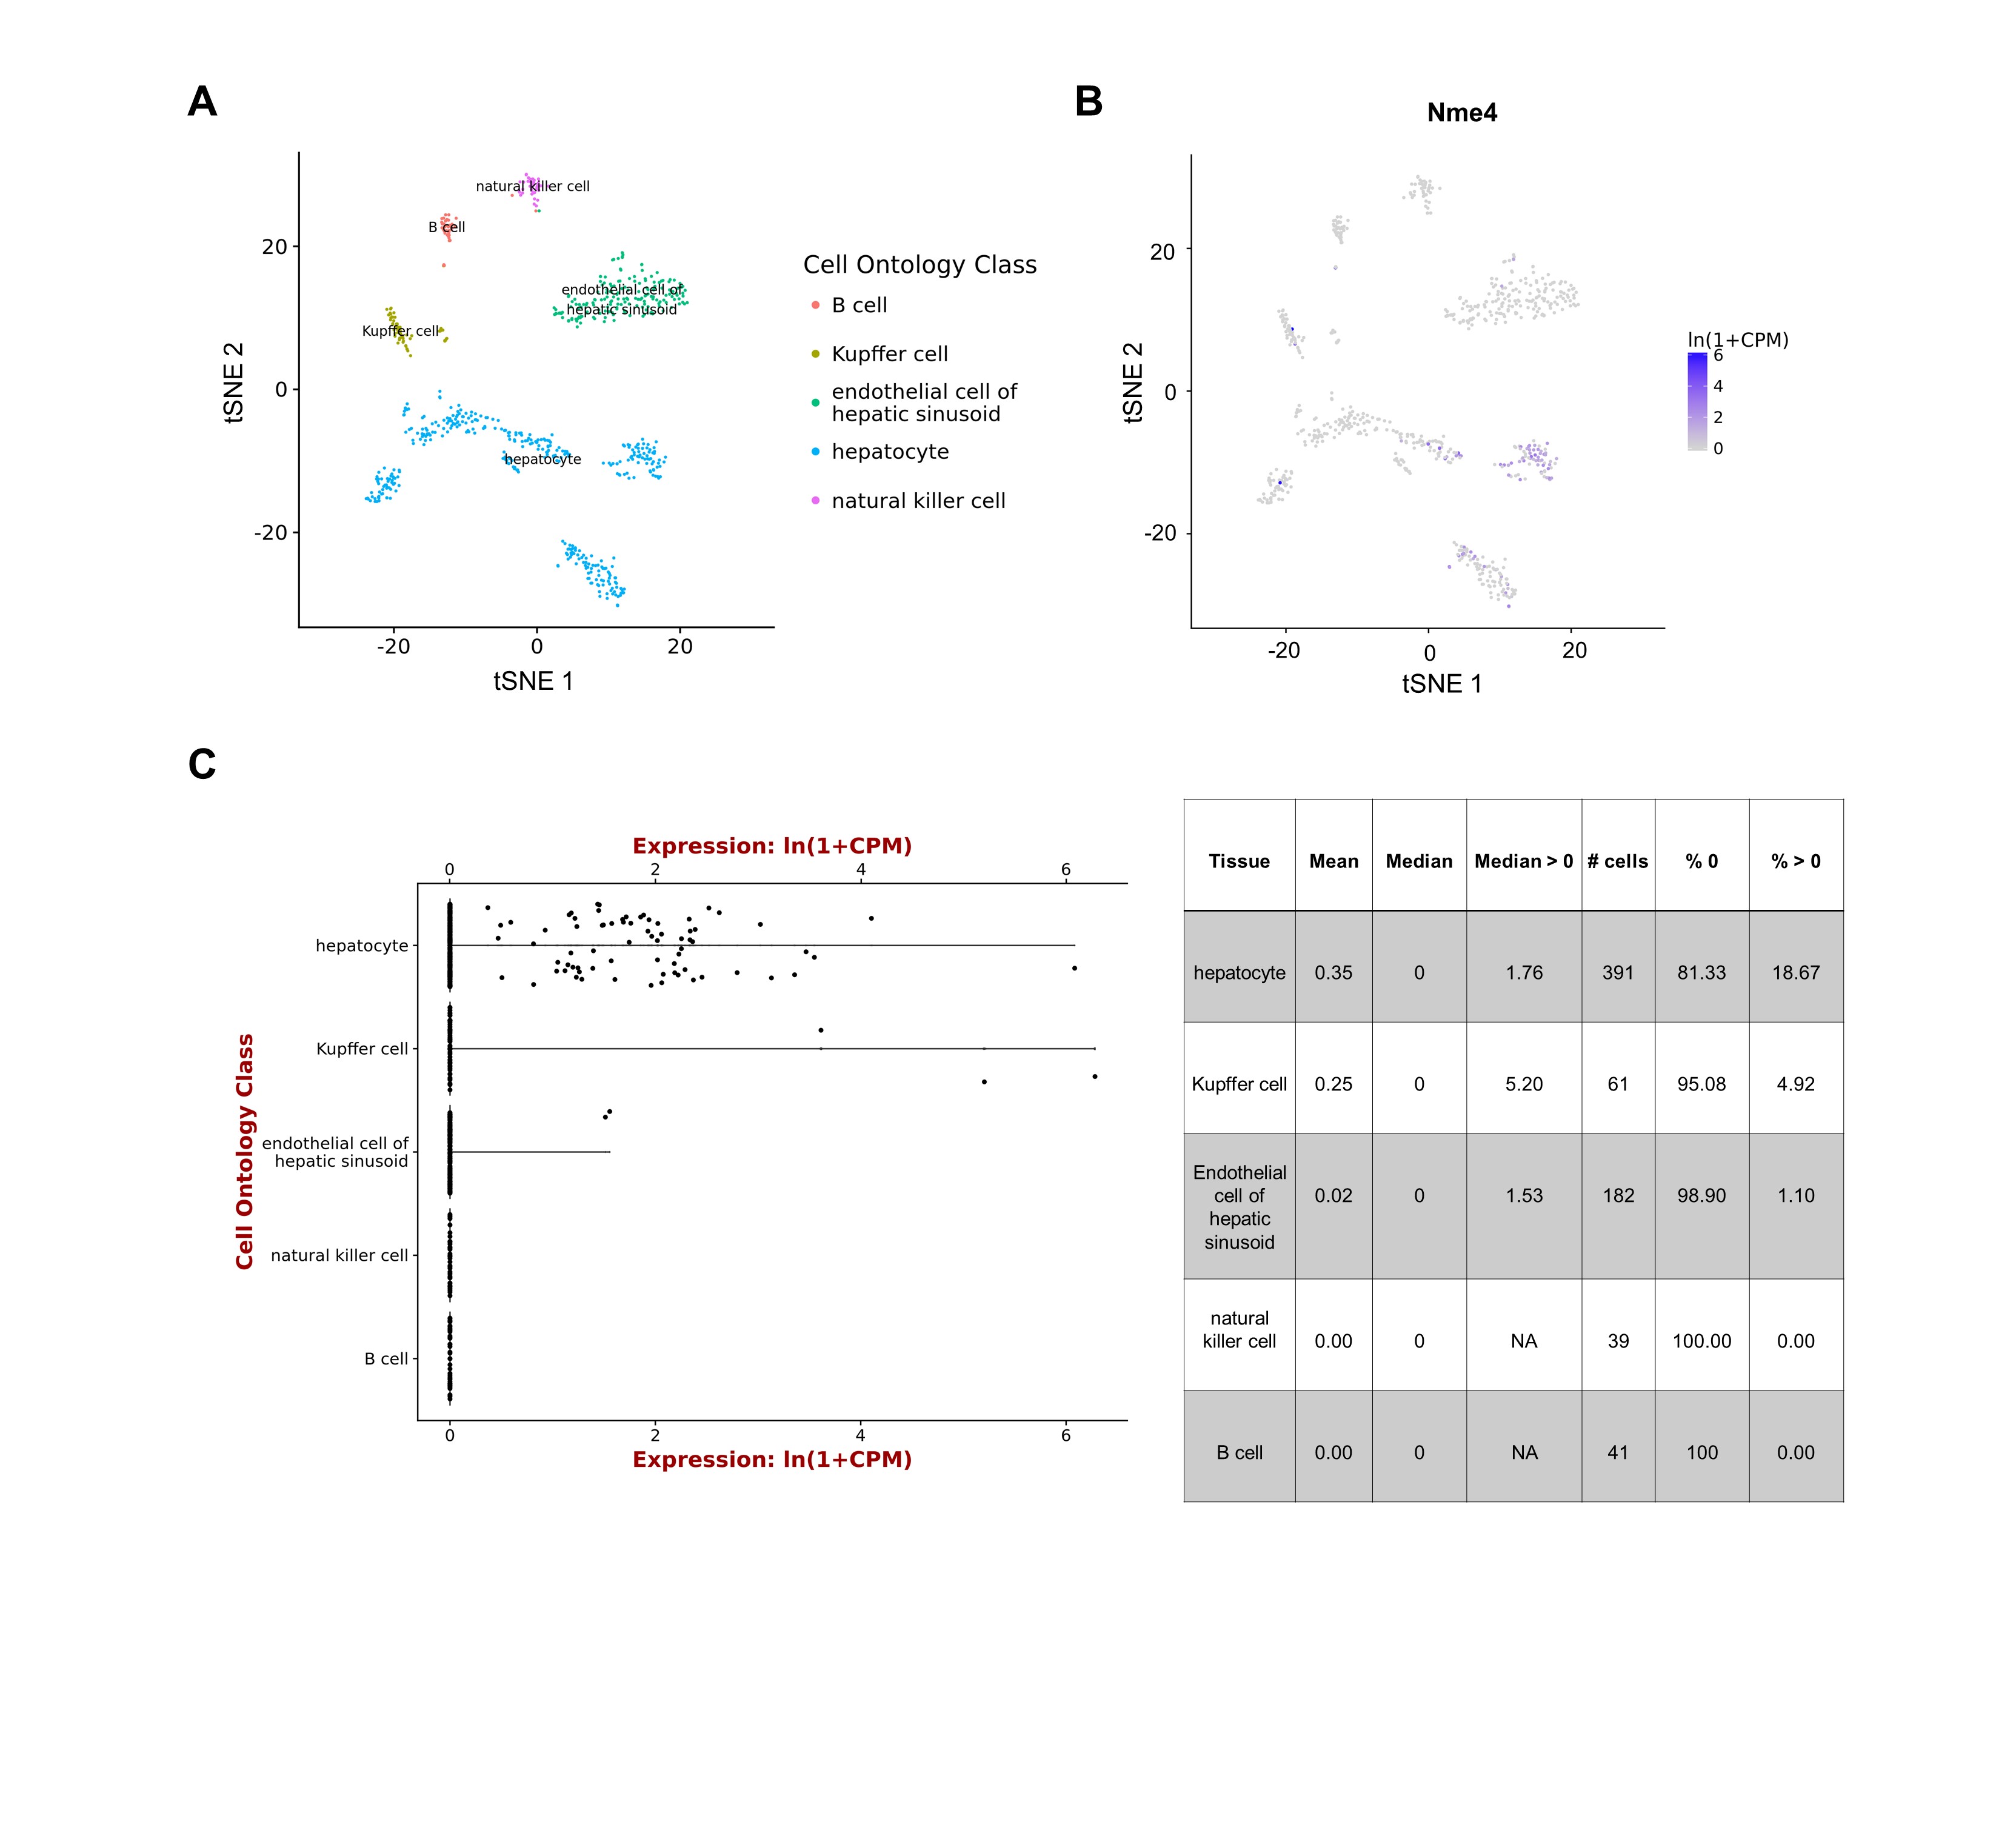
The overall and individual groups of proteins were enriched in signaling pathways, functional categories and diseases as indicated. P values were estimated using the Knowledge Base included with the Ingenuity Pathway Analysis software program (Ingenuity Systems, USA), Gene Ontology, and KEGG pathways. Only statistically significant correlations (P < 0.05) are shown. The -log (P value) for each function and related proteins is listed. Proteomaps that indicate protein abundance and related signaling pathways were drawn by Bionic visualization 56. Network enrichment was performed using Metascape, which provides a biologist-oriented resource. The 2750 NAFLD genes were downloaded from the Comparative Toxicogenomics Database 18. The collection of mitochondrial proteins and their expression across 14 mouse tissues were downloaded from a previous study 19.
Isolation and culture of primary hepatocytes
Primary hepatocytes were isolated from male C57BL/6J mice at 6-8 weeks of age. The mice were anesthetized and perfused with perfusion buffer and collagenase IV (1 mg/mL, Yeasen, China) through the portal vein at 37°C. The liver of each mouse was cut, dispersed, filtered through a 70 μm cell strainer (Thermo Fisher Scientific, USA) and centrifuged at 1,000 × g for 5 min at 4°C. The cells were resuspended in DMEM supplemented with 10% FBS and incubated at 37°C in 5% CO2. After incubation for 24 h, the hepatocytes were attached to the culture plate, and the other unattached cells were removed by replacing the culture medium.
Quantitative real-time PCR (qPCR)
qRT‒PCR was performed as described previously 57. Briefly, total RNA was extracted using TRIzol reagent (Takara, Japan) according to the manufacturer’s instructions. The concentration of the RNA was determined using a NanoDrop 3000 (Thermo Fisher Scientific, USA). RNA from each sample was reverse-transcribed into cDNA using the HiScript® II 1st Strand cDNA Synthesis Kit (Vazyme, China). The mRNA levels of specific genes were quantified by qPCR using TB Green Premix Ex Taq (Takara, Japan) on a Quant studio 5 qPCR system (Applied Biosystems, USA). The data were normalized to the Actin expression level in each sample.
Oil Red O staining and histological analyses
For Oil Red O staining, cells were cultured in a confocal cell culture dish in the presence of 0.8 mM oleic acid (OA, MCE, China) and 0.4 mM palmitic acid (PA, MCE, China) for the indicated time points. The medium was aspirated, and the cells were rinsed twice with PBS, fixed with 4% formaldehyde for 15 min, and dehydrated with 100% 1,2-propanediol for 10 min. Then, prewarmed 0.25% Oil Red O (BBI, China) was added directly to the cells and incubated at 25°C for 1 h. The residual dye was washed away using 85% 1,2-propanediol followed by ddH2O. The nuclei were stained with hematoxylin (Solarbio Life Sciences, China) at 25°C for 5 min. The microscopy studies were performed with a microscope equipped with a digital camera. The cells were visualized under an Olympus IX73 Microscope Imaging System (Olympus, Japan).
Mouse liver sections were embedded in paraffin and then stained with hematoxylin (Solarbio Life Sciences, China) to visualize the pattern of lipid accumulation and the inflammatory status. Lipid droplet accumulation was visualized using Oil Red O staining of frozen liver sections that were prepared in Tissue-Tek OCT compound (SAKURA, USA). Paraffin-embedded mouse liver sections were immunostained. After quenching the endogenous peroxidase activity by incubating the sections with 3% H2O2 for 30 min at 37°C, the sections were processed for antigen retrieval in a microwave and then blocked with 5% BSA for 60 min at room temperature. Primary antibodies were used to detect the expression of the indicated proteins. After incubation with horseradish peroxidase (HRP)-conjugated secondary antibodies, the sections were visualized with DAB (Servicebio Technology, Wuhan, China). The slides were stained with hematoxylin, dehydrated, and mounted for bright-field microscopy.
Metabolite extraction and measurement
Bel-7402 cells were cultured in six-well cell culture plates in the presence of OA:PA (2:1) for 24 h. The medium was aspirated, and the cells were washed twice with cold PBS. The cells were scraped with 800 µl of cold isopropanol using a cell scraper, and the cell debris and isopropanol were transferred to a 1.5 mL centrifuge tube. The extracts were allowed to incubate at 4°C for 1 h, followed by 1 min of continuous vortexing. The tubes were centrifuged, and the supernatants were transferred to a new tube and then stored on ice for MS analysis.
For metabolic analysis, Bel-7402 cells were cultivated in six-well cell culture plates in the presence of OA:PA (2:1) for 24 h. The medium was aspirated as soon as possible, and the cells were washed twice with cold PBS. The cells were scraped with 800 µl cold methanol using a cell scraper and transferred to a new 1.5 mL centrifuge tube. The extracts were incubated at -80°C for 1 h with occasional vortexing and then centrifuged at 14,000 × g at 4°C for 15 min. The supernatants were transferred to a new tube for MS analysis.
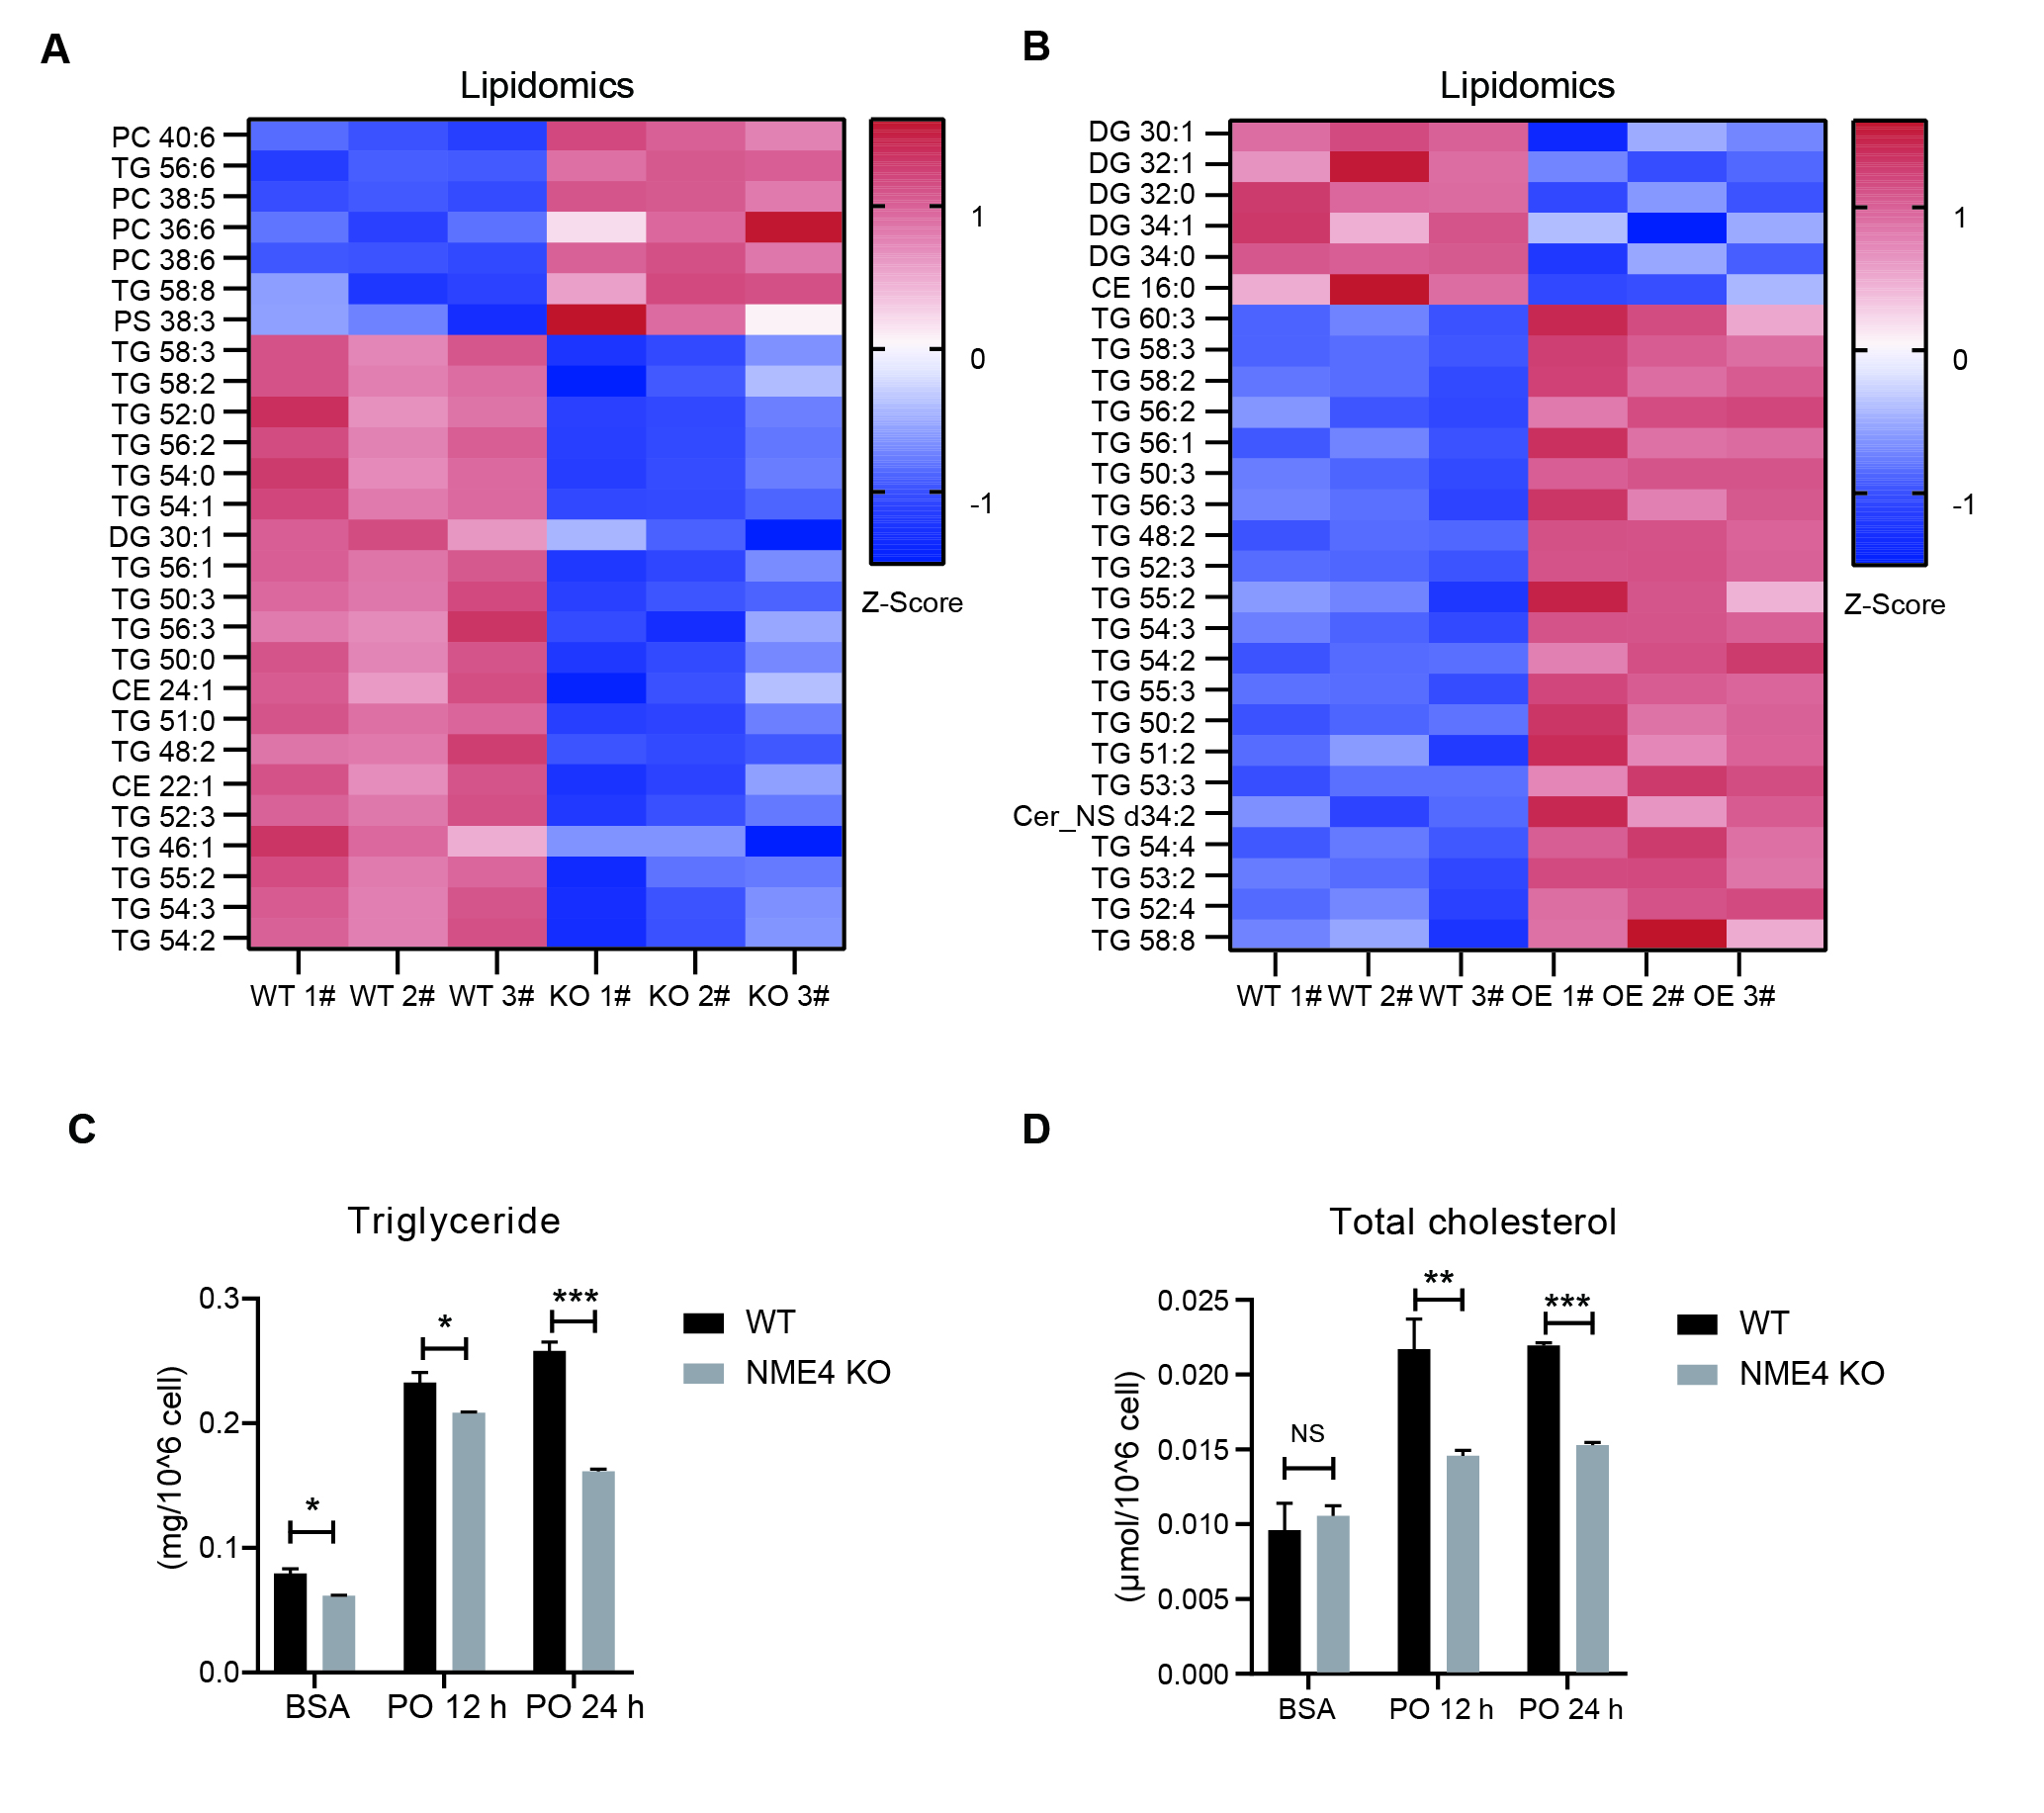
TG and TC contents were analyzed using TG/TC detection kits (Solarbio Life Sciences, China) according to the manufacturer’s instructions. TG and TC concentrations were measured by using a microplate reader at 420 nm and 500 nm wavelengths, respectively.
Statistical analysis
No preprocessing of the data was performed. All Western blotting, immunofluorescence and RT‒qPCR data were obtained from at least three repeated experiments. The data were analyzed using Prism 5.0 software (GraphPad, USA) and are presented as the mean values (standard error of the mean, ± SEMs). Statistical significance between two groups was determined by unpaired two-tailed Student’s t test. Multiple-group comparisons were analyzed using one-way analysis of variance (ANOVA). Differences were considered to be significant at P < 0.05 (indicated with an asterisk (*)). This study was approved by the Ethics Committee of Westlake University.