Reagents
The poly lactic-co-glycolic acid (PLGA) (50:50, MW: 12,000 Da) was purchased from Daigang BIO Engineer Co., Ltd. (Shan Dong, China). Ferric chloride hexahydrate (FeCl3·6H2O), TA, and polyvinyl alcohol (PVA) were purchased from Sigma-Aldrich Chemical Co. (St. Louis, MO, USA). Chlorin e6 (Ce6) was purchased from meilunbio (Dalian, China). Other reagent kits were: Singlet Oxygen Sensor Green (SOSG) (Invitrogen, Massachusetts, USA). Calcein-AM (CAM), propidium iodide (PI), and CCK-8 assays were purchased from Dojindo Laboratories (Kumamoto, Japan). JC-1 assay kit, 2′,-7′-dichlorodi-hydrofluorescein diacetate (DCFH-DA), 4,6-diamidino-2-phenylindole (DAPI) were all purchased from Beyotime Biotechnology Ltd., Co. (Shanghai, China).
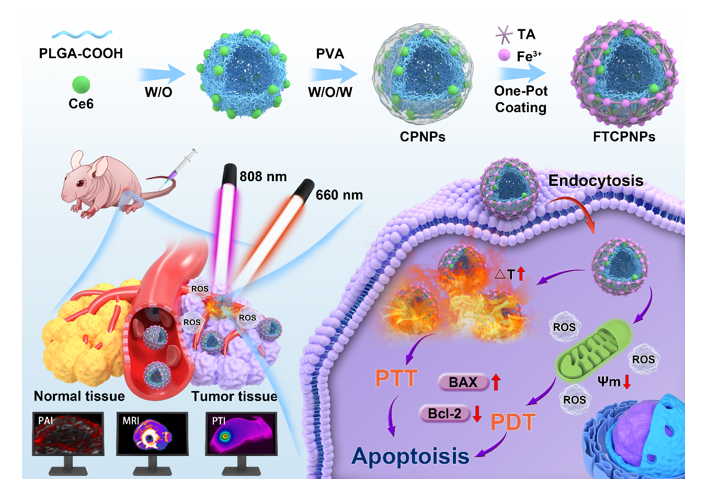
Synthesis Of Ftcpnps
First, PLGA (50 mg) was dissolved in dichloromethane (2 mL), Ce6 solution (0.5 mL, 5 mg/mL dissolved in methanol) was added, and the mixture was placed in an ultrasonic cleaning instrument for 5 min and completely dissolved. After that, ultra-pure water (200 µL) was added, and the probe sonicator (Sonics & Materials, Inc., USA) was used to emulsify the mixture for 3 minutes at an intensity of 45 W. For the second emulsion, 4% PVA solution (8 mL) was added to the above-emulsified solution and homogenized using the same sonicator at an intensity of 35 W for 3 min. After that, 2% isopropanol solution (10 mL) was added and stirred with a magnetic agitator for 3 h to remove CH2Cl2 in a well-ventilated fume hood. Then, the samples were centrifuged for 5 min (10,000 r/min) and washed with ultra-pure water 3 times to obtain PLGA/Ce6 nanoparticles.
Finally, PLGA/Ce6 nanoparticles (0.5 mg/mL), were added to TA solution (5 µL, 40 mg/mL) and FeCl3 solution (5 µL, 10 mg/mL) in turn, placed in a vortex apparatus for 15 s to mix evenly, centrifuged and washed 3 times. The FeIIITA/PLGA/Ce6 nanoparticles were complete.
Characterization Of Ftcpnps
Transmission electron microscope (TEM, Hitachi-7500, Japan) and scanning electron microscopy (SEM, Thermo Apreo S HiVac FEI, USA) were utilized to analyze the morphology and structure of the FTCPNPs. An FEI-Talos F200S electron microscope was used to confirm the presence of Fe in FTCPNPs using area-elemental mapping. Dynamic light scattering (DLS, Brookhaven, USA) was used to determine the size distributions and zeta potentials. The colloidal stability of FTCPNPs dissolved in 5% glucose solution was monitored in 7 d, respectively. A confocal laser scanning microscope (CLSM, A1, Nikon, Tokyo, Japan) was applied to observe the fluorescence of FTCPNPs. The absorption spectrum of FTCPNPs, CPNPs, FeIII-TA, free Ce6, and PLGANPs aqueous solutions was measured by UV–vis spectroscopy (Shimadzu, UV-3600, Japan) to observe the presence of Ce6 and FeIII-TA in the FTCPNPs. The amounts of free Ce6 and FTCPNPs were monitored using a UV-vis spectrometer and the inductively coupled plasma optical emission spectrometer (ICP-OES, Agilent 5110, USA). Moreover, the loading efficiency of Ce6 and FeIII were calculated by UV–vis spectroscopy and ICP-OES. Magnetization hysteresis loops of FTCPNPs were detected by Vibrating Sample Magnetometer (VSM, LakeShore7404, USA).
In Vitro Photothermal Effects
Different concentrations (0.25, 0.5, 0.75, 1.0, and 1.25 mg/mL) of FTCPNPs were added to 96-well plates to measure their thermal profiles under 808 nm laser (2.0 W/cm2, 10 min) illumination. A concentration of 1.25 mg/mL FTCPNPs was irradiated for 10 minutes at various intensities (2, 1.5, 1.0, and 0.5 W/cm2). To evaluate the practical components of photothermal properties, 200 µL of sample aqueous solution of FTCPNPs, FeIII-TA aqueous solution, FeCl3, TA, and free Ce6 with identical concentration was added to 96-well plates, and the thermal profiles of these samples were measured under irradiation with 808 nm laser at 2.0 W/cm2 for 10 minutes. An infrared thermal imaging camera (Fotric 226, Shanghai, China) was utilized to record the temperature change over time. To detect the photothermal stability of FTCPNPs, the FTCPNPs aqueous solution was irradiated by 808 nm laser for repeated heating and cooling cycles. The photothermal conversion efficiency was calculated for 10 min continuous irradiation with FTCPNPs (200 µL, 1 mg/mL).
Cell Culture And Establishment Of Tumor-bearing Animal Model
The human choroid melanoma cells (C918) and Adult retinal pigment epithelial cell line-19 (ARPE-19) were purchased from Procell Life Science&Technology Co., Ltd (Wuhan, China). C918 and ARPE-19 cells were cultured in RPMI-1640 medium containing 10% FBS and 1% penicillin/streptomycin in an incubator at 37°C and 5% CO2. Healthy male nude mice (6–8 weeks old) were obtained from the Beijing HFK Bioscience CO., LTD. The Animal Ethics Committee approved all the animal experiments at Chongqing Medical University. To establish C918 tumor xenograft, 100 µL (3×10⁶ C918 cells suspended in PBS solution) suspension was injected into each mouse's subcutaneous tissue of the root of the right thigh.
Cellular Uptake Behaviors Of Ftpcpnps
C918 cells (5×10⁴ per dish) were seeded in confocal laser scanning microscopy (CLSM) dishes for 24 h and coincubated with FTCPNPs (1 mL, 10 µg/mL, the fluorescence signal comes from Ce6) for different time points (0.5, 1, 3 and 6 h) to observe intracellular uptake. Then, fresh RMPI-1640 was used to wash the confocal dishes 3 times, and 4% paraformaldehyde (1 mL) was added to fix the C918 cells for 15 min and dyed with DAPI (200 µL) for 8 min. Finally, cellular uptake was observed by CLSM. Flow cytometry (BD FACSVantage SE, USA) was used to determine the intracellular uptake of FTCPNPs at various time points.
Determination Of Ros Levels
In vitro ROS levels were measured using SOSG (λex/λem = 504 nm/525 nm). As a brief overview, different concentrations of FTCPNPs and SOSG (5 µM) were added to cuvettes and irradiated with 660 nm laser (Stone Laser, China) at a power density of 5 mW/cm2 for different time intervals. A multimode reader (Shimadzu RF-5310PC, Japan) was used to observe changes in the intensity of SOSG fluorescence. Intracellular ROS levels were determined using the fluorescent probe DCFH-DA (λex/λem = 488 nm/525 nm). C918 cells were seeded in CLSM dishes at a density of 5×10⁴ cells per dish. They were divided into four groups: control group (Control), Laser only group (660 nm + 808 nm laser, Laser), FTCPNPs only group (FTCPNPs), FTCPNPs + 660 nm laser group (FTCPNPs + Laser). After 24 h of incubation, the cells of FTCPNPs and FTCPNPs + 660 nm Laser group were coincubated with FTCPNPs at the same Ce6 concentration of 8 µg/mL. After 8 h of co-incubation with the corresponding FTCPNPs, the dishes were rinsed with fresh RMPI-1640, and DCFH-DA was added staining for 20 min. Cells in the Laser and FTCPNPs + Laser group were irradiated with 660 nm laser (5 mW/cm2, 3 min). Samples were fixed in 4% formaldehyde for 15 min. Formaldehyde was washed away with PBS. Intracellular ROS levels were observed by CLSM. Flow cytometry was used to analyze the collected cells.
1.8 Synergistic therapeutic effects in vitro
First, the safety performance of FTCPNPs was estimated by CCK-8 assay. Typically, C918 and A-RPE cells were seeded in a 96-well plate at a concentration of 1×10⁴ cells per well for 24 h. Then, different concentrations of FTCPNPs (0, 0.0625, 0.125, 0.25, 0.5, 1, 2 mg/mL) were added followed by 48 h of incubation. After coincubation with 10 µL of CCK-8 solution for 45 min, cytotoxicity was detected. Finally, at an absorbance of 450 nm, the viability of the cells was determined using a microplate reader.
C918 cells were seeded in 96-well plates at a density of 1×10⁴ cells per well for 24 h. These cells were randomly divided into the following groups: control group (Control), Laser only group (660 nm + 808 nm laser, Laser), FTCPNPs group (FTCPNPs), FTCPNPs + 808 nm laser (2 W/cm2, 5 min) group (PTT), FTCPNPs + 660 nm laser (5 mW/cm2, 3 min) group (PDT), FTCPNPs + 808 nm + 660 nm laser group (PTT + PDT). The cells of FTCPNPs, PTT, PDT, and PTT + PDT group were coincubated with FTCPNPs at the same concentration of 0.5 mg/mL. As described above, different treatments were applied after 8 h of coincubation. Finally, the viability of C918 cells was assessed using a microplate reader at an absorbance of 450 nm after 45 min of co-incubation with 10 µl of CCK-8 solution.
Similarly, live-dead cell staining was used to assess the antitumor efficacy in vitro. C918 cells were seeded into 6-well plates (2×10⁵ cells per well) for 24 h, then co-cultured with FTCPNPs (0.5 mg/mL) for 8 h. After that, C918 cells were treated according to different groups: they were further irradiated sequentially with 808 nm laser (2 W/cm2, 5 min) at room temperature and/or a 660 nm laser (100 mW/cm2, 3 min) in an ice bath (to avoid photothermal effects). Finally, to quantify living/dead cells by CLSM, Calcein-AM (2 µM)/PI (4 µΜ) dye solution was used.
Different groups of cells were treated in the same way and incubated with annexin V-FITC/PI for 20 min before conducting flow cytometry analysis.
1.9 Detection of mitochondrial depolarization
Mitochondrial membrane potential (MMP) changes were monitored using the mitochondrial dye JC-1. First, C918 cells were seeded into CLSM dishes at a density of 5×10⁴ cells per dish, incubated for 24 h, and then cocultured with FTCPNPs for 8 h. The C918 cells were divided into the following groups: control group (control), Laser only group (laser), FTCPNPs group (FTCPNPs), FTCPNPs + 808 nm Laser group (PTT), FTCPNPs + 660 nm Laser group (PDT), FTCPNPs + 808 nm + 660 nm Laser group (PTT + PDT), and each group was treated separately. In the positive control group, cells were treated for 15 min with CCCP (MMP inhibitor). As a next step, JC-1 probe staining solution was added to fresh medium containing cells of each group for 20 minutes in the dark and observed by CLSM. Flow cytometry was used to quantify the levels of MMP in cells treated as described above.
Rna-sequencing And Bioinformatics Analysis
C918 cells were seeded into T25 cell culture bottles (1×10⁶ cells per bottle) for 24 h. The PTT/PDT group was cocultured with FTCPNPs for 8 h. Then, the C918 cells were treated with 808 nm and 660 nm laser. Wash off the culture medium with PBS. C918 cells collected by centrifugation dissolved rapidly in TRIzol cleavage. We used DNBSEQ-T7 (MGI Tech Co., Ltd, China) to perform RNA sequencing.
Western Blot
Western blot
The C918 cells were cocultured with FTCPNPs for 8 h, and the cell culture conditions were similar to those of the cytotoxicity test. For the extraction of total protein, the C918 cells (1 × 10⁶ cells per group, 0.5 mL) were collected and then lysed on ice in a RIPA buffer containing 1% phenyl methane sulfonyl fluoride (PMSF) for 30 min. A BCA protein assay kit was used to determine the protein concentration. 8% SDS-PAGE gels were used to separate the proteins, which were then transferred onto a polyvinylidene fluoride (PVDF) membrane. The membranes were incubated with specific antibodies (Bax antibody 1: 10000, Bcl-2 antibody 1: 1000) overnight at 4 ℃. Following blocking with 3% BSA for 1 h, the membrane was incubated with a secondary antibody (HRP conjugated goat anti-rabbit IgG) for 1 h at room temperature. An enhanced chemiluminescence system (Pierce, USA) was used to visualize the membranes.
Mr/pa Imaging And Biodistribution Of Ftcpnps
MR imaging in vitro, the prepared FTCPNPs aqueous solution at concentrations of 0.0375, 0.075, 0.3, 0.6, and 1.2 mg/mL were placed in plastic tubes. An MRI system (Siemens Medical System, Chongqing People's Hospital) provided the corresponding images at 3.0 T with a gradient echo sequence, and the corresponding T1 relaxation time was obtained. The MRI parameters were as follows: a gradient echo sequence (repetition time (TR)/echo time (TE)) of 790/11 ms, and a slice thickness of 2.00 mm. PA imaging in vitro, serial concentrations of 0.25, 0.5, 0.75, 1.0, and 1.25 mg/mL were used to detect PA signals and evaluate linearity as a function of FTCPNP concentrations. VEVO LAZR PA imaging system (FUJIFILM Visual Sonics, Inc, Canada) was used to obtain the PA images. To evaluate the accumulation of FTCPNPs in tumors, T1-weighted MR imaging and PA imaging (λex = 690 nm) of C918-tumor-bearing mice were performed. FTCPNPs solution (200 µL, 5 mg/mL) was injected into the tail vein, and the corresponding MR and PA images were collected at different time points (4, 8, 24, 48 h).
FTCPNPs were labeled with DIR and injected into C918-tumor-bearing nude mice through the tail vein. Fluorescence images were obtained using a fluorescence system (λex/λem = 740 nm/790 nm) at different time points (2, 12, 24, and 48 h). Finally, tumors and major organs of mice were imaged with fluorescence, and the related fluorescence signals were analyzed.
In Vivo Anticancer Efficacy Under Pti Guidance And Biosafety Of Ftcpnps
C918-tumor-bearing nude mice were randomly divided into 6 groups (n = 6) after the tumor volume reached 60mm3 after intravenous injection of FTCPNPs: (a) control group (control), (b) laser-only group (laser), (c) FTCPNPs-only group (FTCPNPs), (d) FTCPNPs + 808 nm laser group (PTT), (e) FTCPNPs + 660 nm laser group (PDT), (f) FTCPNPs + 660 nm laser + 808 nm laser group (PDT/PTT). Mice in (a) injected with 200 µL 5% glucose solution were set as the control group. Mice in (c) (d) (e) (f) were injected with FTCPNPs (200 µL, 5 mg/mL). For group (d), the tumors were irradiated with an 808 nm laser (2 W/cm2, 10 min) at 24 h postinjection. For group (e), the tumors were irradiated with a 660 nm laser (95 mW/cm2, 10 min), and for the group (b) and (f) the tumors were irradiated with an 808 nm laser and a 660 nm laser for 10 min. To avoid PTT effects during treatment, an infrared thermal camera was used to monitor temperature variations in the group (e). The PDT process was completed immediately following the PTT process. Each mouse’s tumor volume and weight were recorded every 2 days during a 14-day observation period. The tumor volume was calculated as follows: V = length×width2/2. Tumor volume change was represented by V/V0 (V0 was set as the initial tumor volume). All PDT processes were performed immediately after PTT. In each group, one mouse was sacrificed 24 hours after the treatment. For H&E staining, tumors, livers, spleens, lungs, and kidneys were harvested and preserved in paraformaldehyde at 4%. TUNEL and PCNA staining were performed on tumor tissues to determine tumor proliferation. In addition, the tumor tissues were stained with Bax and Bcl-2 immunofluorescence.
1.14 In Vivo Evaluation of the Toxicity of FTCPNPs
FTCPNPs (200 µL, 5 mg/mL) were injected into healthy Kunming mice (n = 25, 6 weeks). In the control group (n = 5, 6 weeks), mice were injected with 5% glucose solution. After a specified time (1, 3, 7, 14, and 28 d postinjection), the mice were euthanized and their blood was collected for blood biochemistry and routine blood examinations. Major organs of mice were removed and fixed with 4% polyoxymethylene before H&E staining.
1.15 Statistical Analysis
All data are expressed as the mean ± standard deviation (SD), and the significance of differences among groups was evaluated with one-way ANOVA and Student’s t-test (*p < 0.05, **p < 0.01, ***p < 0.001). The main paragraph text follows directly on here.