Expression pattern of IGF2BP3 in CESC and clinical relevance
We explored the expression profile of IGF2BP3 in pan-cancer across all TCGA tumors by TIMER: Tumor IMmune Estimation Resource. As shown in Fig. 1A, IGF2BP3 was over-expressed in multiple tumor tissues, for example, bladder urothelial carcinoma, esophageal cancer and cholangiocarcinoma, including CESC. To further verify the expression pattern of IGF2BP3 in CESC, we analyze the expression level between tumor and adjacent normal tissues using and TCGA and GTEx data. The expression of IGF2BP3 was higher in tumors than in normal tissues in CESC (Fig. 1B). The survival contribution of IGF2BP3 in CESC was shown in the survival map (Fig. 1C). We plotted survival probability versus time (months) showing two curves, blue for low IGF2BP3 and red for high IGF2BP3. In Fig. 1C, survival probability of blue curve was higher than that of red at the same time point. Therefore, the progress free interval survival (PFS) was certainly associated with IGF2BP3, even though the association was not statistically significant (P > 0.05). The ROC curve shows that IGF2BP3 level could be sensitivity to CESC (AUC > 0.8) (Fig. 1D), indicating that IGF2BP3 was associated with poor prognosis of CESC patients.
Igf2bp3 Was Associated With Hpv Infection In Hpv Related Cesc
HPV infection was admitted to be a causative factor in malignant cervical lesions[24]. In the following part, to further illustrate the relationship between HPV infection and IGF2BP3 expression, we used CESC data with detailed HPV infection status[25]. IGF2BP3 expression was higher in patients with HPV compared to without HPV infection (Fig. 2A). The expression of IGF2BP3 varies according to CLIN: e6_cat_k4 and CLIN: e6ratio_cat_k4. (Fig. 2B). IGF2BP3 expression was higher in CLIN:e6_cat_k4_C2 and CLIN: e6ratio_cat_k4_C2. E6 category (32 = C1, 33 = C2, 31 = C3, 32 = C4), E6 ratio category (33 = C1, 34 = C2, 30 = C3, 31 = C4)
Igf2bp3 Was Involved In Cell-cell And Cell-ecm Interactions In Hpv-related Cesc
To investigate the role of IGF2BP3 expression levels on HPV-associated CESC, patients were ranked according to IGF2BP3 expression, and the top 50% of patients were in the IGF2BP3 high group, otherwise, they were in the IGF2BP3 low group. Then, GO/KEGG enrichment analysis was performed on the differentially expressed genes (DEGs) between the IGF2BP3 high group and IGF2BP3 low group in CESC. GO analysis showed enrichment of DEGs can be found in several pathways related to intrinsic cell-cell contacts and cell-extracellular matrix (ECM) interactions, including receptor ligand activity, signaling receptor activator activity, carboxylic acid binding and peptidase inhibitor activity (Fig. 3A). Neuroactive ligand receptor interaction, calcium signaling pathway, chemical carcinogenesis receptor activation and retinol metabolism were identified as differentially enriched pathway in KEGG (Fig. 3B). Following that, Gene Set Enrichment Analysis (GSEA) analysis in CESC was performed to further understand the enrichment of DEGs in cell-cell or cell-ECM interactions. These DEGs could be found to be significantly associated with extracellular matrix organization, genes encoding structural ECM glycoproteins, transmission across chemical synapses, ensemble of genes encoding core extracellular matrix, neuronal system, nuclear receptors meta-pathway and neuroactive ligand-receptor interaction (Fig. 3C). Therefore, IGF2BP3 was involved in cell-cell contacts and cell-ECM interactions in HPV related cancer.
Igf2bp3 Was Related To The Tight Junctions In Hpv-related Cesc
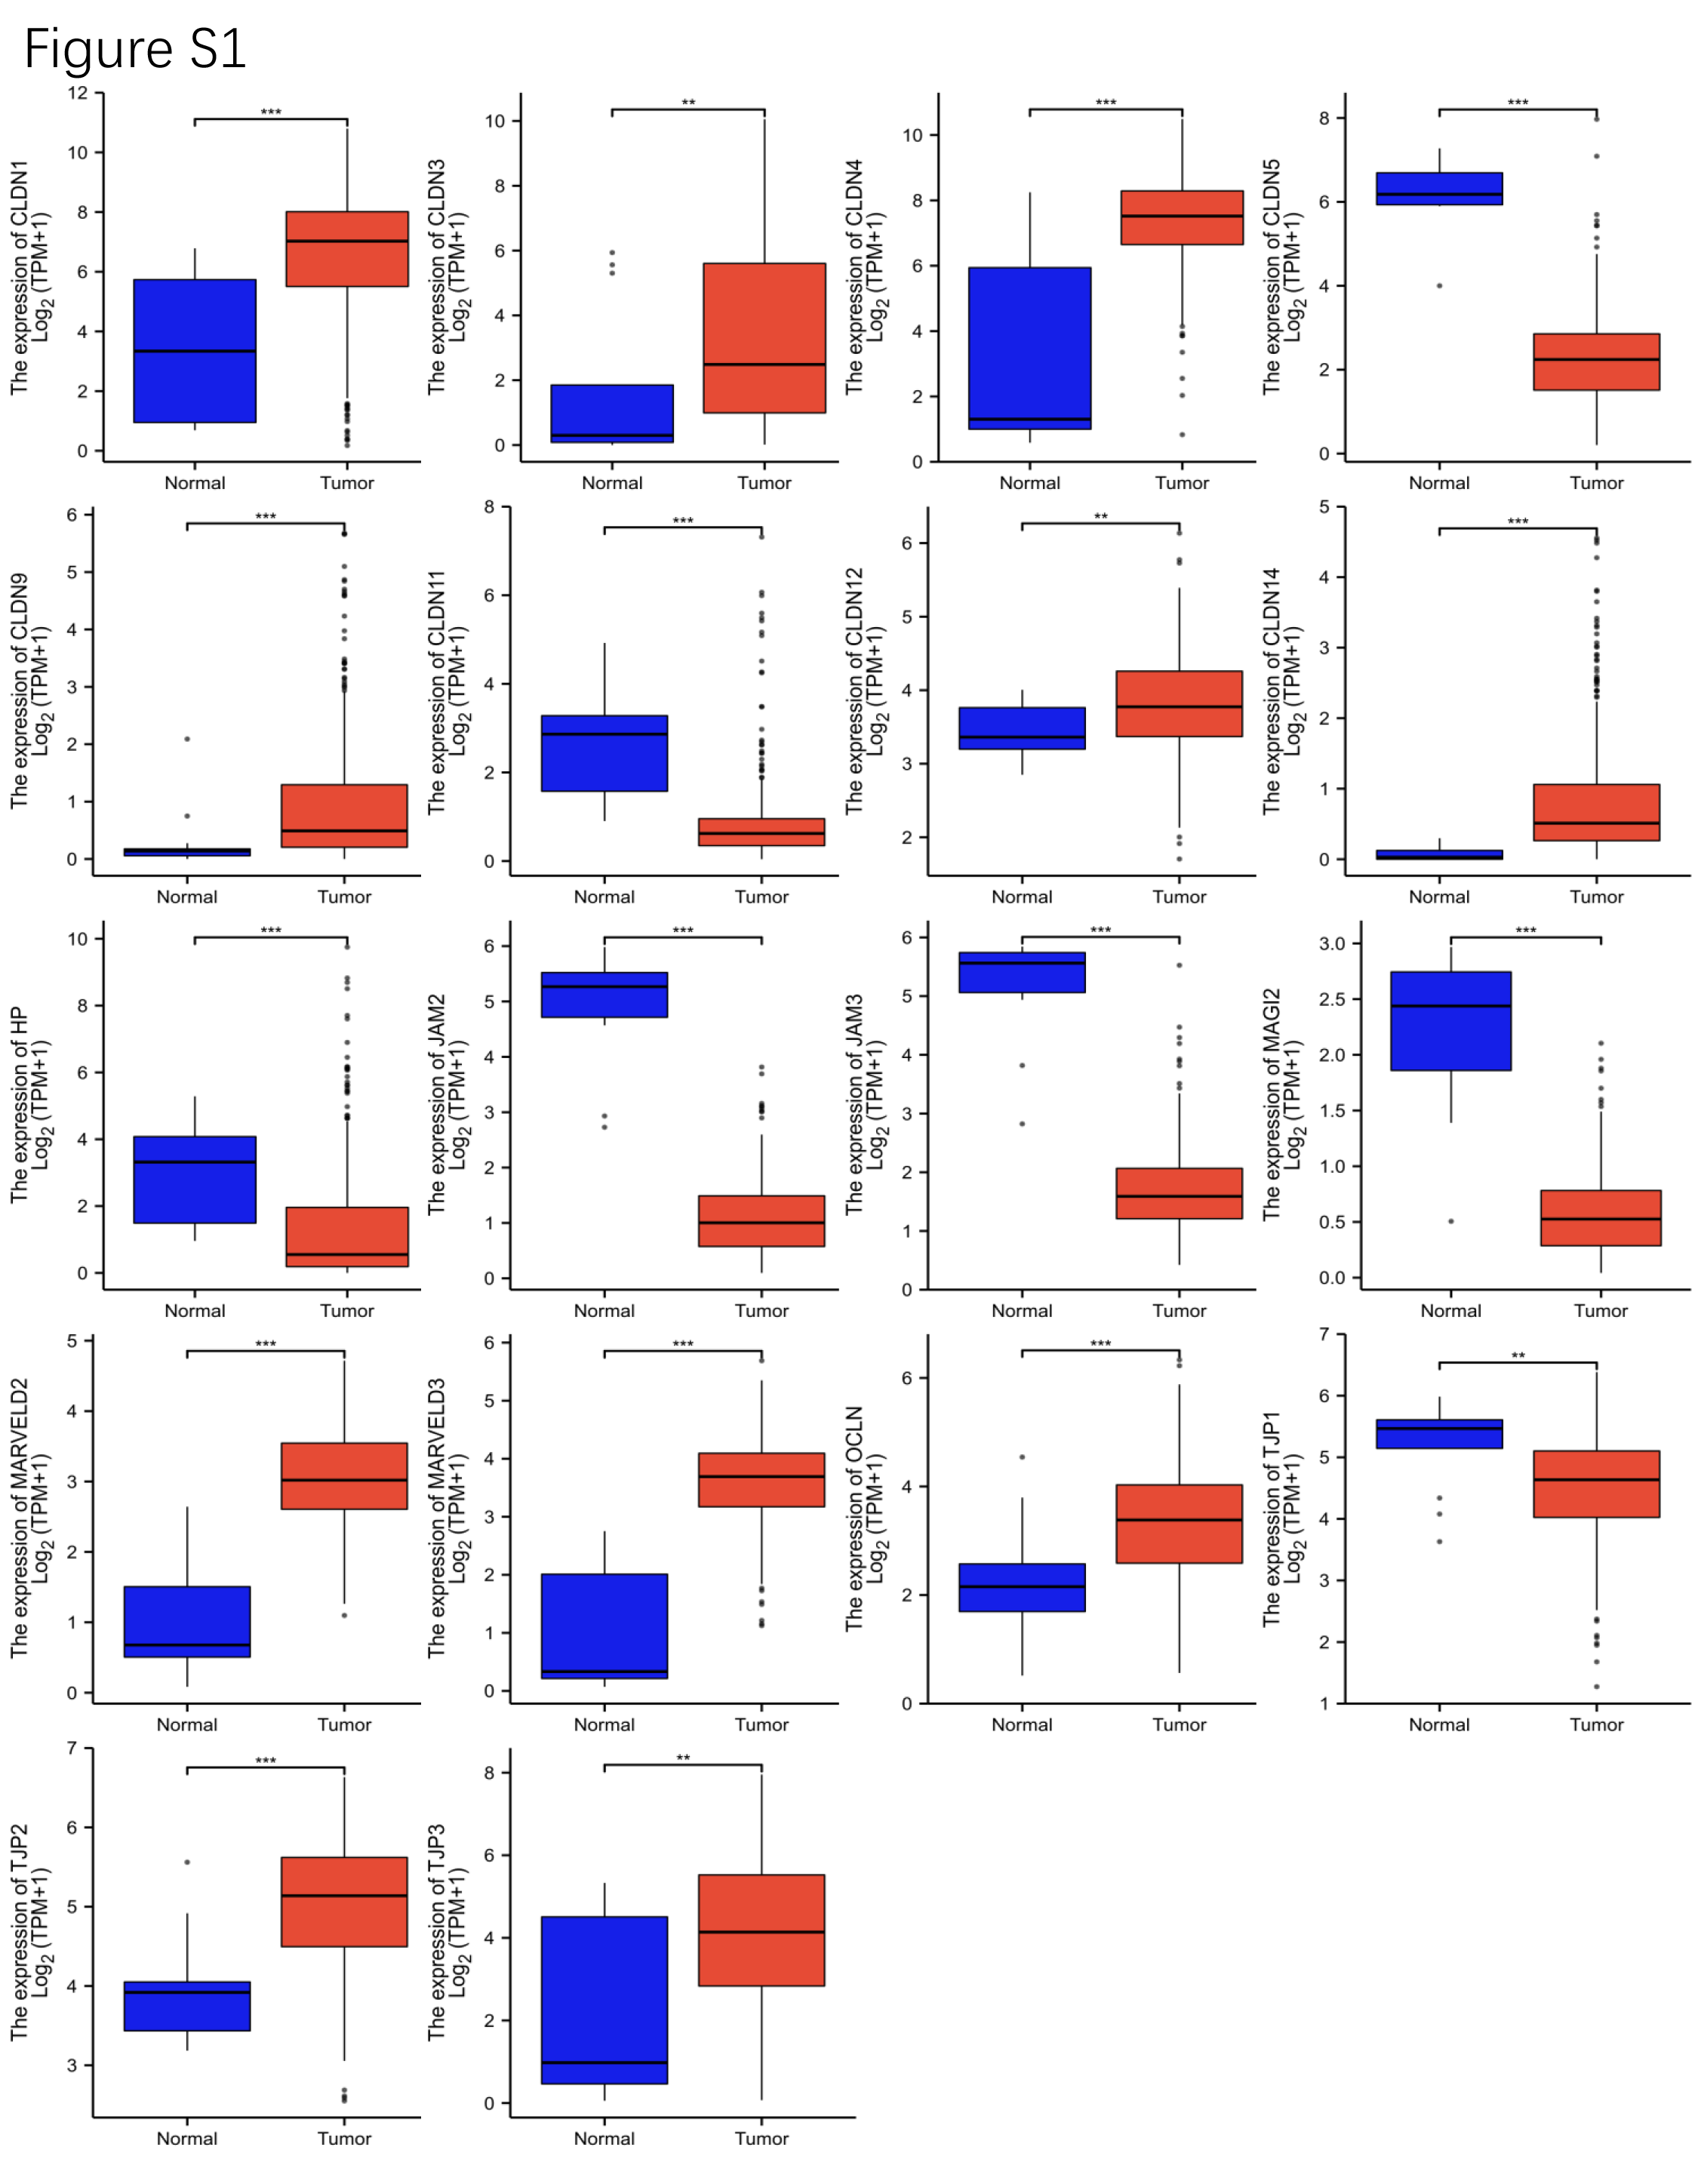
The above enrichment analysis suggested that IGF2BP3 was associated with receptor ligand activity, extracellular matrix organization and transmission across chemical synapses, which played some role in cell-cell contacts and cell-ECM interactions [26, 27]. Since tight junctions always accompany cell-cell contacts and cell-extracellular matrix interactions throughout the plasticity of the endometrium[28, 29], we analyzed the relationship between IGF2BP3 expression and TJs to investigate how IGF2BP3 affected the above interactions. We explored the expression profile of 27 TJ molecules in CESC using TCGA data (Fig. 4A). There were 17 DEGs identified in CESC (Fig. 4A). The expression levels of these 17 DEGs between norma and tumor were shown in Figure S1. The expression profile of these TJs molecules was similar to that of IGF2BP3 in CESC according to the co-expression heatmap (Fig. 4B). Furthermore, using TCGA data, correlation analyses of the expression of these TJs molecules and IGF2BP3 in CESC were performed (Fig. 4C). Patients were ranked according to IGF2BP3 expression, and the top 50% of patients were IGF2BP3 high status, otherwise, they were IGF2BP3 low status. In CESC samples, IGF2BP3 high samples showed higher TJP1, TJP2, CLDN11, CLDN12, MARVELD2, MARVELD3, OCLN, MAGI2, LAMA3, LAMC2, ITGB4 and TJAP1.