Complex 1 is a dinuclear complex with six benzoates ligands. Out of six, four benzoates exhibit syn, syn bridging modes and two benzoates ligands act as a monodentate. Both copper metal ions are connected with each other via oxygen of the benzoate ligands. Each copper atom is five coordinated and geometry can best have described as square pyramid.
In complex 2, each asymmetric unit contains one copper(II) atom, one ppa ligand and one free water molecule. In this structure, ppa ligand is work as a bridging ligand via nitrogen and monodentate carboxylate group. The copper(II) is present in octahedral geometry satisfied by two nitrogen atoms, two trans monodentate carboxylate groups of ppa ligands and two oxygen’s from water molecules (Fig. 2).
In this structure, four ppa ligands are connected through copper metal ions to generate [Cu(ppa)]4 rings thus constructing a 2-D layer network via ppa edges and copper(II) joints (Fig. 3).
Compound 3 is a chain like structure with three different types of bridges. The copper (II) ions are connected by azide, carboxylate and oxygen of methanol to generate 1D chain (Figure-4).
Hirshfeld surface investigation is a very useful technique for analysing molecular attractions other than covalent in molecular structure [37, 38]. The dnorm sarface was determined by linked to the normalised displacement of the nearest particle in the surface (di) and out of the surface (de) to the Hirshfeld surface analysis, showing all of the supramolecular communications of the crystal arrangement. The deep red colour portion on dnorm related to the smaller intermolecular attractions than the van der Walls (vdW) radii of the substances, while the blue and white portions related to greater intermolecular interactions and more close to the vdW radii are represented through the colours blue and white, respectively.
The Hirshfeld surfaces analysis of 1 is shown in Fig. 5, revealing surfaces drawn over a dnorm range of -0.068 to 1,608 Å, di range 1.0 to 2.89 Å, de range 1.0 to 3.012 Å, shape file range − 1.000 to 1.000 Å and curvedness range − 4 to 0.400 Å. Similarly, from Fig. 6 and Fig. 7, showing surfaces drawn over a dnorm range of -1.198 to 1.175 and − 0.654 to 1.522 Å, di range 0.283 to 2.402 and 0.957 to 2.851 Å, de range 0.286 to 2.395 and 0.745 to 2.780 Å, for 2 and 3, respectively.
The shape index is a feature of Hirshfeld surface that is very useful for exploring the π∙∙∙π stack attractions in the crystal framework, where the pattern of the blue and red triangles shows the area in which the stacking arrangement is observed.
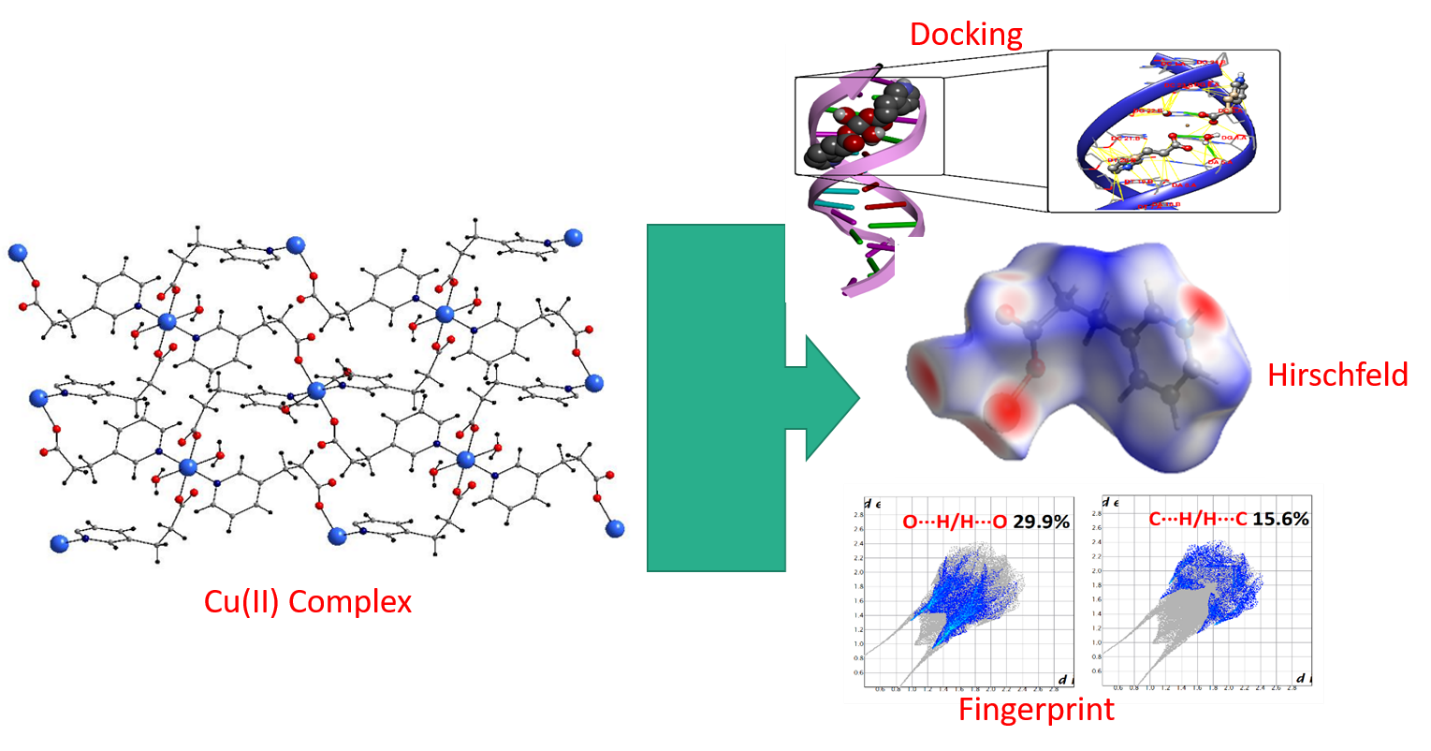
Moreover, the curvedness described as the determining of the structure of the surface region of the compound [39, 40]. On other hand, plots of 2D identification graph give quantitative data about the decayingn of the Hirshfeld investigation into participations from the different intermolecular attractions found in crystal framework [41–43] as seen in Figs. 5–7. It can be observed that the 2D graphs of 1 and 2 are alike, showing the H∙∙∙H, O∙∙∙H/H∙∙∙O and C∙∙∙H/H∙∙∙C are the major participation of the crystal pattern of arrangement of these molecules, with the H∙∙∙H and O∙∙∙H/H∙∙∙O attachments contributing with 42.4%, 41.6% and 9.9%, 8.9% for 1 and 2, accordingly, while the C∙∙∙H/H∙∙∙C attractions participating with 18% for 1 and 19.6% for 2 (Fig. 5 and Fig. 6). Moreover, in 7, the 2D plot is decayed to show H∙∙∙H (33%), N∙∙∙H (13.5%) and O∙∙∙H/H∙∙∙O (5.9%), interactions specific region while C∙∙∙H/H∙∙∙C has 13% of intermolecular interactions as shown in Fig. 7. The importance of 2D identification graph is to illustrate specific related molecule-couple attraction enable to explain the participations from different attractions other than covalent that overlap in the full graph [44].
These molecular interactions in which one substance behaves like as a giver (de>di) while second as an accepting substance (di>de) are complementary region shown able onto the dnorm regions and also in the identification graphs.
Molecular docking studies
Molecular docking investigation of aforementioned metal complexes (1–3) have been performed by DNA of the arrangement d(CGCGAATTCHGCG)2 dodecamer in the way to understand the decideable dimension of the compounds between the DNA spiral strand and to corroborate the lightening study data [45, 46]. The best suppporting authentication of the docked way of complexes with lowest energy deciphered that complexes fitted comfortably into the curved contour of the pointed DNA. Complex 1 was found in close proximity to A-5, A-6, T-7, C-15, G-16, A-17 and A-18 base pairs (Fig. 8(a)) and 2 was in C-3, G-4, A-5, A-6, T-7, T-20, C-21, G-22, C-23 and G-24 (Fig. 8(b)) whereas 3 was close to G-4, A-5, A-6, C-21, G-22 and C-23 (Fig. 8(c)). The smaller furrow is specifically a smart goal for minor compounds as the quicker nearness of the strands permit more cherished get in touch with in surface region and strongly attached with best arrangement. The hydrogen bonding has been played a vast role in linking the compounds with DNA. Furthermore, the resultant minimum relative interaction energies of the three docked complexes were found to be -6.2, -7.8 and − 7.6 kcal/mol for complexes 1 to 3, respectively; these negative values suggest greater binding potentials of the complexes to DNA. Complex 1 has the lower interaction energy due to its bigger size demonstrates lesser efficiency to bind with DNA. Hydrophobic interactions and van der Waals forces of metal complexes with DNA that characterize the groove binding could also contribute to the stability of docked conformations [47].