3.1 Characteristics of the Patients
The cohort of 38 patients initiating CTH for colorectal or non-small cell lung cancer without primary prevention of FN included 14 (36.8%) women and 26 (68.4%) subjects at least 65 years old. Eighteen (47.4%) patients had a diagnosis of cardiovascular disease. The most common were hypertension (N = 15; 39.5%) and coronary artery disease (N = 6; 15.8%). Moreover, eight (21.0%) participants had diabetes. Before the CTH, significant weight loss was noted in 15 (39.5%) patients (Table 1).
Initially, 15 (62.5%) patients had reduced eGFR (< 90 ml /min/1.73m2). Values below 60 ml/min/1.73m2 were found only in five (13.1%) patients.
The median duration of follow-up of the study (until the onset of neutropenia or completion of CTH) was 76 days (lower and upper quartiles 50 and 161 days, respectively). The maximum observation time was 330 days. In seven patients, the scheduled treatment was discontinued without the occurrence of neutropenia. The reasons for the unscheduled CTH termination were disease progression (N = 9), deterioration in physical function (N = 2), stroke (N = 1), and in one case, death. In two cases, contact with the patient was lost. There was any case of G-CSF use before the onset of at least G2 neutropenia.
Sixteen (42.1%) patients developed the primary endpoint (neutropenia G2 − 4) during the follow-up. In this group, G2 neutropenia occurred in three, G3 in nine, and G4 in four patients. There were no episodes of FN. The median time to onset neutropenia was 57 days (lower and upper quartiles 42 and 91 days, respectively), with a maximum time of 193 days.
Initially, anemia occurred in six patients (15.8%). It persisted for the first two visits in four, and in further two also included the third and fourth visits. During the follow-up, at least one episode of G2 anemia occurred in five (13.2%) patients.
Thrombocytopenia (< 150 x 10^9 /L ) was initially found in two (5.3%) patients and any patient developed at least G2 thrombocytopenia during the follow-up.
3.2 Comparison of the Group of Women and Men
Table 1 compares women and men regarding comorbidities and the baseline clinical data. Features such as lower body weight, BMI, hemoglobin and eGFR values, and smaller body surface area were more frequent in women. No other statistically significant differences between both groups were found, except for the more frequent occurrence of coronary artery disease in men (a tendency to statistical significance).
Table 1
Baseline patients' characteristics and comparison of clinical parameters between women and men.
| | Whole Group N = 38 | Men N = 24 (63.2%) | Women N = 14 (36.8%) | p-value |
| Age [years] | 68 ± 6 | 68 ± 6 | 69 ± 7 | 0.63 |
| Age ≥ 65 years [N (%)] | 26 (68.4) | 16 (66.7) | 10 (71.4) | 0.76 |
| Body weight [kg] | 75.3 ± 17.0 | 81.4 ± 17.4 | 64.6 ± 9.5 | < 0.001 |
| Weight loss before CHT [N (%)] | 15 (39.5) | 9 (37.5) | 6 (42.9) | 0.74 |
| Body surface [m2] | 1.86 ± 0.23 | 1.95 ± 0.22 | 1.69 ± 0.16 | < 0.001 |
| BMI [kg/m2] | 26.7 ± 4.6 | 28.0 ± 4.6 | 24.6 ± 4.0 | < 0.05 |
| Comorbidities | | | | |
| Diabetes [N (%)] | 8 (21.1) | 7 (29.2) | 1 (7.4) | 0.21 |
| Hypertension [N (%)] | 15 (39.5) | 11 (45.8) | 4 (28.6) | 0.33 |
| Coronary artery disease [N (%)] | 6 (15.8) | 6 (25.0) | 0 | 0.07 |
| Cardiovascular disease [N (%)] | 18 (47.4) | 14 (58.3) | 4 (28.6) | 0.10 |
| Baseline laboratory work-ups | | | | |
| Serum creatinine [mg/dL] | 0.90 ± 0.27 | 0.94 ± 0.25 | 0.84 ± 0.28 | 0.22 |
| eGFR [ml/min/1.73m2] | 90.8 ± 28.8 | 97.9 ± 31.8 | 78.8 ± 18.2 | < 0.05 |
| eGFR < 90 [ml/min/1.73m2] | 22 (57.9) | 12 (50.0) | 10 (71.4) | 0.20 |
| Erythrocytes [106/µL] | 4.3 ± 0.6 | 4.5 ± 0.5 | 3.9 ± 0.5 | < 0.01 |
| Thrombocytes [103/µL] | 284 ± 118 | 276 ± 128 | 298 ± 100 | 0.58 |
| Leukocytes [103/µL] | 7.6 ± 2.1 | 7.9 ± 2.1 | 7.1 ± 1.9 | 0.23 |
| Neutrophils [103/µL] | 4.7 ± 1.8 | 4.9 ± 1.9 | 4.2 ± 1.6 | 0.29 |
| Hemoglobin [g/dL] | 12.5 ± 1.8 | 13.1 ± 1.8 | 11.5 ± 1.0 | < 0.01 |
| Anemia (Hb < 11 g/L) | 6 (15.8) | 3 (12.5) | 3 (21.4) | 0.65 |
| Hb < 12 g/L | 15 (39.5) | 5 (20.8) | 10 (71.4) | < 0.01 |
| Thrombocytopenia [N(%)] | 2 (5.3) | 2 (8.3) | 0 | 0.52 |
| Follow-up (at any time) | | | | |
| Neutropenia G2-4 [N (%)] | 16 (42.1) | 9 (37.5) | 7 (50.0) | 0.45 |
| Anemia [N (%)] | 9 (23.7) | 4 (16.7) | 5 (35.7) | 0.24 |
| Thrombocytopenia [N (%)] | 7 (18.4) | 6 (25.0) | 1 (7.1) | 0.23 |
Note: N, number of patients; CHT, chemotherapy; BMI, Body Mass Index; eGFR, estimated Glomerular Filtration Rate; Hb, hemoglobin.
3.3 Comparison of patients with and without neutropenia
Table 2 compares patients with and without neutropenia (at least G2 during CTH). Neutropenic patients were much more frequently older, had lower eGFR levels, and more often suffered from hypertension (a tendency to statistical significance). No other statistically significant differences were found.
Table 2
Comparison between patients with and without neutropenia (at least G2 during CTH).
| | Without neutropenia N = 16 (57.9%) | Neutropenia N = 22 (42.1%) | p-value |
| Women [N (%)] | 7 (31.8) | 7 (43.7) | 0.45 |
| Age [years] | 69 ± 4 | 68 ± 9 | 0.70 |
| Age ≥ 65 years [N (%)] | 18 (81.8) | 8 (50.0) | < 0.05 |
| Body weight [kg] | 72.7 ± 13.9 | 78.8 ± 20.4 | 0.28 |
| Weight loss before CHT [N (%)] | 10 (45.4) | 5 (31.2) | 0.51 |
| Body surface [m2] | 1.83 ± 0.22 | 1.89 ± 0.25 | 0.47 |
| BMI [kg/m2] | 23.7 ± 5.7 | 26.8 ± 7.5 | 0.16 |
| Comorbidities | | | |
| Diabetes [N (%)] | 5 (22.7) | 3 (18.7) | 1.00 |
| Hypertension [N (%)] | 6 (27.3) | 9 (56.3) | 0.07 |
| Coronary artery disease [N (%)] | 3 (13.6) | 3 (18.7) | 0.68 |
| Cardiovascular disease [N (%)] | 8 (36.4) | 10 (62.5) | 0.11 |
| Baseline laboratory work-ups | | | |
| Serum creatinine [mg/dL] | 0.82 ± 0.20 | 1.02 ± 0.31 | < 0.05 |
| eGFR [ml/min/1.73m2] | 99.4 ± 26.9 | 79.1 ± 27.9 | < 0.05 |
| eGFR < 90 [N (%)] | 8 (36.4) | 14 (87.5) | < 0.01 |
| Anemia (Hb < 11 g/L) [N (%)] | 5 (22.7) | 1 (6.2) | 0.37 |
| Hb < 12 g/L [N (%)] | 8 (36.4) | 7 (43.7) | 0.64 |
| Thrombocytopenia [N (%)] | 0 | 2 (12.5) | 0.17 |
| Follow-up (at any time) | | | |
| Anemia [N (%)] | 5 (22.7) | 4 (25.0) | 1.00 |
| Thrombocytopenia [N (%)] | 2 (9.1) | 5 (31.2) | 0.11 |
Note: N, number of patients; CHT, chemotherapy; BMI, Body Mass Index; eGFR, estimated Glomerular Filtration Rate; Hb, hemoglobin.
A significant change in the platelet counts over time was demonstrated, yet without clinical complications (pTime < 0.05; pTime x group = 0.42). There were no differences between both groups at individual observation time points. In neutropenic and non-neutropenic groups, the decrease in platelets was as follows: from baseline counts of 306 ± 100 to 225 ± 89 x 103/µL (p < 0.05) and from 282 ± 118 to 197 ± 40 x103/µL (p < 0.01), respectively.
There was also a significant change over time in blood counts of neutrophils, yet without negative consequences (pTime < 0.05; pTime x group = 0.59). No differences between both groups at individual observation time points were observed. In the group with neutropenia, the number of neutrophils at the fourth measurement was significantly lower than at the baseline (2.30 ± 1.83 vs. 4.57 ± 1.58 x 10³/µL; p < 0.05).
There were no statistically significant differences between both groups in serum creatinine (pTime = 0.81; pTime x group = 0.52) and the eGFR-EKD-EPI (pTime = 0.95; pTime x group = 0.71). However, during the observation period, patients with neutropenia had statistically significantly lower eGFR values than patients without neutropenia (p < 0.05 at each time point) shown in Fig. 1.
3.4 Risk factors for neutropenia
Table 3 presents the results of the univariable Cox proportional analysis. The critical risk factor for the occurrence of neutropenia was eGFR < 90 ml/min/1.73m2 (HR = 6.5), while surprisingly, the preventive factor was age ≥ 65 (HR = 0.26). Age ≥ 65 years and decreased eGFR were included in the multivariable analysis. The direction of the influence of variables remained unchanged. The elderly subjects had a lower risk of developing neutropenia (HR = 0.27; 95% CI: 0.10–0.77; p < 0.05), contrary to the higher risk of this complication in patients with reduced eGFR (HR = 6.33; 95% CI: 1.39–28.77; p < 0.05).
Table 3
One-way analysis of Cox proportional hazard – risk factors for neutropenia in the studied group of patients.
| | HR | ± 95% CI | p-value | PPH test |
| Women | 1.60 | 0.59–4.34 | 0.35 | 0.62 |
| Age [5 years] | 0.77 | 0.48–1.23 | 0.28 | 0.83 |
| Age ≥ 65 years | 0.26 | 0.09–0.70 | < 0.01 | 0.47 |
| Body weight [1 kg] | 1.02 | 0.99–1.06 | 0.22 | 0.23 |
| Weight loss before CHT | 0.59 | 0.20–1.70 | 0.33 | 0.41 |
| Body surface [1 m2] | 1.63 | 0.16–16.62 | 0.68 | 0.77 |
| Baseline BMI [1 kg/m2] | 1.04 | 0.93–1.17 | 0.49 | 0.96 |
| Diabetes | 0.80 | 0.23–2.81 | 0.72 | 0.78 |
| Cardiovascular disease | 1.93 | 0.70–5.35 | 0.20 | 0.08 |
| Hypertension | 2.06 | 0.76–5.56 | 0.16 | 0.12 |
| Coronary artery disease | 1.66 | 0.46–5.89 | 0.44 | 0.42 |
| eGFR [10 mL/min/1.73m2] | 0.79 | 0.62–0.99 | < 0.05 | 0.15 |
| eGFR < 90 mL/min/1.73m2 | 6.50 | 1.46–28.87 | < 0.05 | 0.35 |
| Hemoglobin [< 12 g/L] | 1.14 | 0.42–3.08 | 0.79 | 0.70 |
| Thrombocytes [103/µL] | 0.95 | 0.89–1.01 | 0.10 | 0.14 |
| Leukocytes [103/µL] | 0.82 | 0.61–1.10 | 0.18 | 0.36 |
| Neutrophils [103/µL] | 0.80 | 0.56–1.14 | 0.21 | 0.24 |
Note: N, number of patients; CHT, chemotherapy; BMI, Body Mass Index; eGFR, estimated Glomerular Filtration Rate; HR, hazard ratio; CI, confidence interval; PPH, Schoenfeld residuals test p-value.
3.5 Survival analysis for neutropenia
The Kaplan-Meier curves of the probability of neutropenia occurrence in the subgroups with normal and decreased eGFR are shown in Fig. 2.
The incidence of neutropenia in the whole group was 3.99 per 1000 person-days (95% CI: 2.44–6.52/1000). In the whole group, the lower quartile and median of neutropenic-free survival days were 70 and 193, while in the neutropenic group, there were 42 and 51 days, respectively.
There was a statistically significant difference in Kaplan-Meier curves between patients with and without decreased eGFR (log−rank < 0.01). The incidence of neutropenia in the group with and without decreased eGFR was 6.97 (95% CI: 4.13–11.77) and 1.00 (95% CI: 0.25–4.00) per 1000 person-days, respectively. The relative risk of neutropenia for patients with decreased eGFR values was more than six times higher than for patients with eGFR > 90 ml/min/1.73m2 (RR = 6.08; 95% CI: 1.45–27.29; p < 0.01). The median survival time without neutropenia in the group with decreased eGFR was 91 days; the lower and upper quartiles were 49 and 193 days, respectively. While the estimated mean survival time without neutropenia in the normal and low eGFR groups was 295 (95% CI: 207–309) and 125 (95% CI: 72–178) days, respectively.
3.6 Comparison of patients with and normal and lowered eGFR
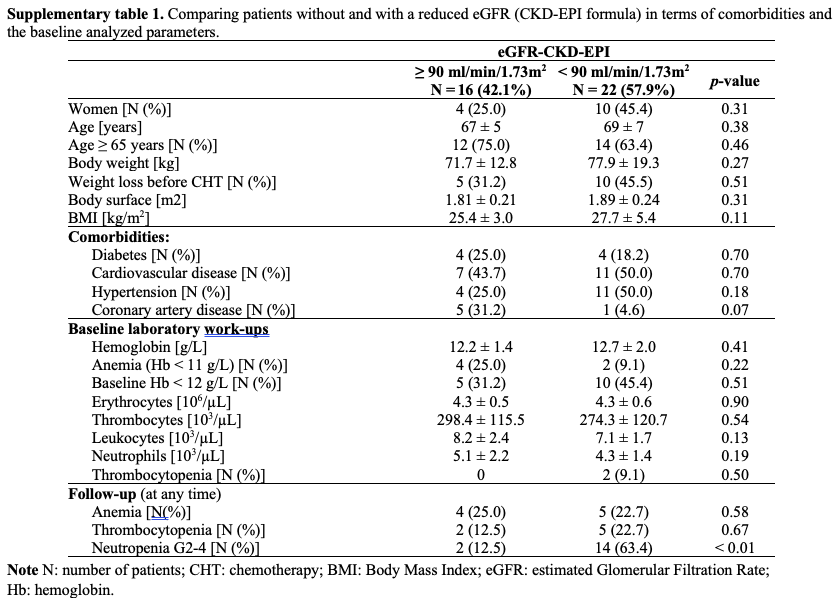
Patients with reduced eGFR did not differ in age and occurrence of comorbidities, except close to the statistically significant tendency for a lower occurrence of coronary artery disease (p = 0.07). Of note, subjects with reduced eGFR had a higher incidence of neutropenia (63.4% vs. 12.5%; p < 0.001). No other statistically significant differences were found (shown in Supplementary Table 1).