3.1. Structural and morphological analysis
Figure 1 displays the X-ray diffraction patterns of pure LTO and LTO-MWCNTs composite. Both XRD spectra showed Bragg’s reflections of distinctive peaks (111), (311), (400), (331), (333), (440), and (531) with origins at 2θ values of 18.35°, 35.57°, 43.28°, 47.44°, 57.27°, 62.83°, and 66.07° respectively, corresponding to the cubic structure of LTO with Fdm space group (JCPDS-49-0207). Both spectral lines showed no additional distinctive peaks, indicating the formation of phase-pure materials. The LTO-MWCNTs composite displays sharp and intense peaks, which denote the presence of MWCNTs and suggest that the addition of MWCNTs to the precursor has no effect on the synthesis of phase-pure LTO after heat treatment. The same tendency in the formation of composite and intensity in the peaks were observed in the case of Li2TiO3/CNTs composite and consistence with the literature [62, 63]. The average particle size of pristine LTO and LTO-MWCNTs nanocomposite was calculated from the Bragg’s peaks using well-known Scherrer’s formula Eq. 1.
Lc = Kλ/(β Cosθ)…………………………………….(1)
Where ‘Lc’ denotes the crystallite size, ‘K’ is the Scherrer’s constant (0.94), ‘λ’ denotes the X-ray radiation wavelength, ‘β’ is the full width at half maximum, and ‘θ’ denotes the diffraction angle. The typical crystallite size of pure LTO and LTO-MWCNTs nanocomposite is around 75 nm and 60 nm, respectively.
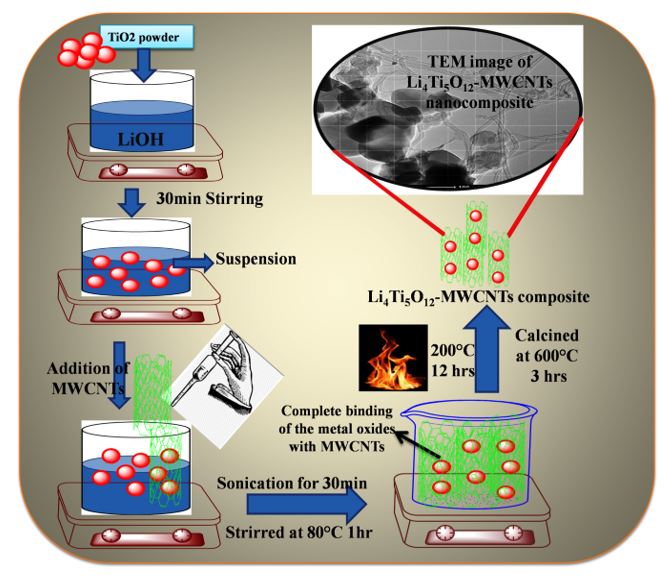
The surface morphology of pristine LTO and LTO-MWCNTs nanocomposite was studied using SEM and HRTEM analysis. Figure 2A and 2C depicts that the SEM images of LTO and LTO-MWCNTs nanocomposite. The irregular polyhedral smaller particles of the pure LTO nanoparticles are depicted in Fig. 2a. They are firmly aggregated, resemble a single bevel, and have a distinct cut. The SEM image of LTO-MWCNTs nanocomposite was shown in Fig. 2c, and it demonstrates the small size of the LTO particles grown in the presence of carbon nanotubes. The MWCNTs were wrapped around the LTO particles as shown in Fig. 2c, indicating that the well-connected MWCNTs are in intimate contact with the LTO particles and produced conductive network. This network enhances quick electron transport and enables strong binding between LTO nanoparticles, considerably improving the electrochemical performance of the electrode surface. Figure 2b and 2d show the EDX spectra of pure LTO and LTO-MWCNTs nanocomposite, respectively, which demonstrate the presence of Ti, C, and O elements in varying molar ratios. SEM micrographs of cable-like sheeted MWCNTs at various magnifications are shown in Fig. 2E and 2F.
The detailed microstructure of LTO-MWCNTs nanocomposite is shown in Fig. 3A–E observed in TEM, HRTEM and SAED micrographs. As shown in Fig. 3a–c (TEM images with different magnifications), MWCNTs are in intimate contact with LTO nanoparticles, which may enhance the electron transport pathway between adjacent LTO particles. The particle size range distribution of ~ 50–100 nm and this observation were in good agreement with the data of crystallites from XRD. HRTEM and SAED patterns provide more detailed structural information (Fig. 3d and 3e). As can be seen from Fig. 3D, the unique lattice edge distance in the range of approximately d = 0.28 nm corresponds to the (400) plane of the pristine LTO. The clear bright spots and diffuse diffraction rings can be seen in the SAED (Fig. 3e) image, which is further evidence, that the LTO-MWCNTs was made up of extremely crystalline, nanoscale particles. Figure 3f shows the EDX pattern of the LTO-MWCNTs with various Ti, O, and C element ratios.
Figure 1, Fig. 2 & Fig. 3
3.2. Electrochemical evaluation of modified electrodes
The kinetic barrier of the electrode and solution interface of the electroactive species can be evaluated using the CV approach [64]. Figure 4 depicts the CV responses of the bare (a), pristine LTO (b), pristine MWCNTs (c), and LTO-MWCNTs (d) modified electrodes in 0.1 M KCl/1 mM [Fe(CN)6]3−/4−. As can be seen in Fig. 4, the LTO-MWCNTs/GCE electrode showed a maximum peak current response compared to bare, LTO and MWCNTs, this was due to the presence of more electrochemical active sites on the surface of LTO-MWCNTs/GCE. Additionally, it was likely because MWCNTs have outstanding conductivity and electron transport capabilities. Moreover, the LTO-MWCNTs/GCE electrode had the smallest peak potential separation (Ep) of 74 mV when compared to bare GCE (Ep = 102 mV), LTO/GCE (Ep = 88 mV), and MWCNTs/GCE (Ep = 82 mV). The LTO-MWCNTs/GCE electrode surface response with the lowest peak potential interval (Ep = 74 mV), which suggests a rapid electron transfer rate [65]. On the other hand, the surface coverage area concentration (Γ) of LTO-MWCNTs/GCE was also calculated using Eq. (2) [66].
Ip = n2 F2A υ Γ/4RT.............................................................(2)
Here, Ip = peak current, n = number of electrons, A = active surface area and υ = scan rate, respectively. The other terms such as F, R, and T stand for the temperature, gas constant, and faraday constant, respectively. According to the results, the estimated ‘Γ’ values for LTO-MWCNTs, MWCNTs, pristine LTO, and bare GCE electrodes were 5.12×10− 8 mol cm− 3, 3.98×10− 8 mol cm− 3, 2.72×10− 8 mol cm− 3, and 1.42×10− 8 mol cm− 3 respectively. Higher ‘Γ’, maximum peak current and lowest peak separation potential was due to the faster electron transfer kinetics of LTO-MWCNTs/GCE. In order to evidence it, the fabricated electrodes were further subjected to EIS tests.
EIS technique is a powerful, non-destructive, and very useful technique for detecting molecules on the surface of the electrodes. It provides important information on the phenomenon of charge transfer through the properties of the electrode/electrolyte interface [67]. The EIS spectrum for bare (a), pristine LTO (b), pristine MWCNTs (c) and LTO-MWCNTs (d) modified electrodes in 0.1 M KCl/1mM [Fe(CN)6]3−/4− was displayed in Fig. 5. In general, the semicircular diameter at high frequencies in the EIS spectrum shows the electron transfer resistance (Rct) on the electrode surface [68]. As shown in Fig. 5, the indented semicircular diameter for LTO-MWCNTs/GCE was 35 Ω, which was smaller than the bare GCE (70 Ω), LTO/GCE (52 Ω) and MWCNTs/GCE (44 Ω). The electrode made of LTO-MWCNTs have the lowest Rct value, indicating that a strong electron conduction route has formed between the electrode surface and the electrolyte. Furthermore, the synergistic interaction between MWCNTs and nanoscale LTO was also responsible for the lowest Rct value LTO-MWCNTs/GCE. Additionally, the amalgamation of MWCNTs and LTO provided a high electronic conductivity and high active surface area. As can be seen in the inset of Fig. 5, the impedance spectrum was fitted using the Randles equivalent circuit. The circuit has four separate parameters: Zw, CPE, Rct, and Rs, which stand for Warburg impedance, constant phase element, charge transfer resistance, and solution resistance. According to the findings of CV and EIS, we conclude that the LTO-MWCNTs/GCE nanocomposite electrode has excellent conductivity in comparison with all fabricated electrodes.
Figure 4 & Fig. 5
3.3. Electrochemical behaviour of DA
Figure 6 illustrates the CVs obtained for the electrochemical response of DA at the LTO-MWCNTs (e), pristine MWCNTs (d), pristine LTO (c) and bare GCE (b), in 0.1 M PBS (pH 7.0). As shown in Fig. 6, each electrode demonstrated electrocatalytic oxidation in the direction of DA detection, the anodic and cathodic peak currents (Ipa/Ipc = 10.86×10− 6/-8.46×10− 6 A) at LTO-MWCNTs/GCE electrode were significantly higher than those of the other electrodes. The very low peak potential difference (ΔEp = 29 mV) and the higher peak currents with respect to LTO-MWCNTs/GCE towards DA detection can be explained by the high electrocatalytic activity of LTO-MWCNTs composite, which acted as highly conductive wires that contributed to the fast charge transfer kinetics. Additionally, LTO particle agglomeration was effectively reduced by MWCNTs, leading to an increase in the electrochemically active surface area, resulting in an improvement in redox peak currents [69]. However, compared to LTO-MWCNTs/GCE, the LTO/GCE (curve c) displayed reduced peak currents (Ipa/Ipc = 6.82×10− 6/-5.13×10− 6 A) and a change in peak potentials towards a higher value (Ep = 45 mV). The significant agglomeration of LTO particles was the cause of the poor electrocatalytic activity of LTO/GCE. The MWCNTs/GCE (curve d) showed increased peak currents (Ipa/Ipc = 8.32×10− 6/-6.34×10− 6 A) and a shift in peak potentials towards the lower value (ΔEp = 36 mV) when compared with LTO/GCE. This was due to the fact that the highly conductive cable-like structures of MWCNTs provided large surface area for the electrode, thereby attracting more analyte particles on the surface. Very weak peak currents (Ipa/Ipc = 3.54×10 − 6/-3.03×10− 6 A) and a shift of peak potentials towards a higher value (ΔEp = 93 mV) was seen in the case of bare GCE (peak b) compared with all the fabricated electrodes (peaks c, d and e). This was owing to GCE's low conductivity and tiny active surface area. Based on the foregoing findings, a synergistic effect of both LTO and MWCNTs in the composite was proposed to be considered. As a result, the LTO-MWCNTs/GCE electrode was chosen as an optimal composite electrode for further investigation.
Figure 6
3.4. Influence of pH buffer
CV was utilized to investigate the impact of pH on the redox behavior of DA in the presence of varying pH of the electrolytes at LTO-MWCNTs/GCE. In Fig. 7a, CVs with varying pHs (5.0–9.0) were produced at LTO-MWCNTs/GCE containing 1 mM DA. As shown in Fig. 7a, the pH of the buffer solution had an impact on the Ipa/Ipc and their ΔEp of DA. With an increase in pH, the peak potentials were linearly moved towards negative potentials, confirming the involvement of protons in the redox reaction, which suggests that the electrooxidation reaction of DA includes an electron transfer reaction followed by a proton transfer process [70]. The oxidation peak currents of DA steadily rose between pH 5.0 and pH 7.0. This came about because of the electrostatic interaction between the electrode surface and the charged DA molecules. At the same time, due to a deficiency in protons in the basic natured PBS, peak currents of DA progressively decreased from pH 7.0–9.0. Figure 7b exemplifies the effect of pH on the oxidation peak potential (Epa) and its peak current. The pH dependency vs. Epa relationship was expressed as Epa (V) = 0.3607 − 0.0539 pH (R2 = 0.9952) with a slope value of 0.053 V/pH for DA. The observed slope value nearly fits the theoretical Nernst value of -0.059 V/pH for two electrons and two protons participating in the oxidation process, which is in good accord with the reported literature [71, 72]. Based on the findings of the pH investigation, higher peak current was observed at pH 7.0, thus pH 7.0 was chosen as the optimal pH value for further research.
Figure 7a & Fig. 7b
3.5. Influence of scan rate
The electrocatalytic reaction of LTO-MWCNTs/GCE on the redox behavior of DA was investigated at various scan rates using CV. The CVs at various scan speeds over the range of 10 to 500 mV s− 1 (a–y) in 1 mM DA containing PBS with a pH of 7.0 at LTO-MWCNTs/GCE was shown in Fig. 8a. As can be seen in Fig. 8a, all the redox peaks of DA showed small and gradual shifts as the scan rate increased, and the peak current intensity gradually increased. This result confirms that the mechanism of electrochemical reaction is highly dependent on changes in scan speed. The relationship between the redox peak currents (Ipa/Ipc) and various scan speeds in a range of 10–500 mV s− 1 was represented in Fig. 8b. The relationship can be expressed as Ipa (A) = 0.2667 v (mV s− 1) + 0.0162 (R2 = 0.9991) and Ipc (A) = 0.2315 v (mV s− 1) + 0.0196 (R2 = 0.9986), respectively. This result confirms an adsorption-controlled mechanism at the modified electrode [73]. The electrochemical kinetic parameters (such as the heterogeneous rate constant (ks), electron transfer coefficient (α), and the number of electrons (n)) were also determined using the following Eqs. (3), (4). [74, 75].
Epc = Eo – m [0.78 + ln (D½/ks) – 0.5lnm] – 0.5mlnυ............................ (3)
m = RT/αnF.......................................................................................... (4)
The term ‘n’ was estimated using Eq. 4 and the plot of Ep vs ln, which found out to be 2.21. The plot of ln Ip vs Epa - Eo was used to estimate the value of ‘α’ to be 0.513. With the help of Eq. 3, the 'ks' at LTO-MWCNTs/GCE was determined to be 2.78 sec− 1, which was a greater value than that of the previously reported literatures [76, 77]. These results demonstrate that the electrode modified with LTO-MWCNTs exhibits good electrocatalytic activity in enhancing the detection of DA electron transfer during the electrochemical oxidation process.
Figure 8a & Fig. 8b
3.6. Sensitive determination of DA at LTO-MWCNTs/GCE sensor
Under optimum experimental conditions, the modified LTO-MWCNTs/GCE electrode was used for the sensitive determination of various concentrations of DA in aqueous PBS using highly sensitive DPV technique. The DPV response at various DA concentrations over the range of 5–260 µM (a-t) at LTO-MWCNTs/GCE in PBS (pH 7.0) was depicted in Fig. 9. As we expected, as DA concentration increased over the range of 5-260 µM, the oxidation peak currents gradually increased. The plot of Ipa vs. various concentrations (Inset Fig. 9) revealed the corresponding linear equation, which is Ipa (µA) = 0.6292 (µA) + 0.0609 (R2 = 0.9979). Using Eqs. (5) and (6), the detection and quantification limits of DA were computed and determined to be as 1.54 µM and 5.16 µM, respectively. In addition, the electrochemical characteristics of LTO-MWCNTs/GCE with respect to the detection of DA compared to other published literature were listed in Table-1 [78–86].
LOD = 3SD/M ............................................................(5)
LOQ = 10SD/M ...........................................................(6)
Where ‘M’ represents the slope value determined from the calibration graph and ‘SD’ represents the standard deviation of peak currents.
Figure 9 & Table-1
3.7. Selectivity study
The selective DA detection in the existence of 5-HT, and FA was examined at LTO-MWCNTs/GCE. The selectivity investigation involved changing the concentration of one species while keeping the concentrations of the other two species constant. As seen in Fig. 10a, the concentrations of DA were changed from 10–70 µM while the concentrations of the other two species remained constant. The concentrations of 5-HT (20–400 µM) and FA (20–310 µM) were adjusted in a similar manner, but the concentrations of the other two species remained constant (Fig. 10b and 10c). As shown in Fig. 10a–c, the peak currents of DA, 5-HT, and FA were proportionate to the different amounts of each substance. The peak potentials and peak currents of DA, 5-HT, and FA did not alter during the investigation. Hence, these findings suggest that the proposed LTO-MWCNTs/GCE method has good selectivity. The peak currents showed a strong linear relationship with different concentrations of DA, 5-HT, and FA (Insets Fig. 10a–c). The corresponding three linear equations were found as (7), (8), and (9) respectively.
Ip (A) = 3.4451 + 0.8301 C(DA) (µM) (R2 = 0.9994) ..................................(7)
Ip (A) = 0.5381 + 0.0235 C(5−HT) (µM) (R2= 0.9979) ..................................(8)
Ip (A) = 0.3752 + 0.0376 C(FA) (µM) (R2 = 0.9965) ....................................(9)
Figure 10
3.8. Reproducibility, stability, and analytical utilization of the fabricated sensor
Newly produced LTO-MWCNTs/GCE (ten times) were utilized to investigate the reproducibility of the method with the help of CV in 0.1 M PBS (pH 7.0) containing 1 mM DA (Fig. 11). The findings showed that the peak currents of the DA had a relative standard deviation (RSD) of about 3.5%, indicating that the established method's reproducibility was satisfactory [87]. Additionally, the CV responses of DA over a seven-day period were examined in order to assess the stability of the LTO-MWCNTs/GCE electrode (the CV response was measured on each day). According to these findings, the peak CV currents at the LTO-MWCNTs/GCE electrode were unaffected, indicating that the modified electrode has a high degree of stability [88]. To further investigate the applicability of LTO-MWCNTs/GCE, the DPV method was used to determine DA content in the injection sample. Before analysis, the commercial dopamine hydrochloride injection (40.0 mg/mL) sample was diluted in 0.1 M PBS (pH 7.0) and storing it in a refrigerator. The recoveries of DA were analyzed using the standard addition method and found to be 99.86%, 98.88%, 99.78%, and 97.92%, respectively. From these results, satisfactory recoveries were noticed. Hence, the suggested LTO-MWCNTs/GCE sensor demonstrated good electrocatalytic activity and sensitivity for DA assay in a pharmaceutical sample.
Figure 11
3.9. Galvanostatic Charge-Discharge (GCD) tests
As synthesized samples were characterized by charge-discharge experiments in an aqueous cell at a rate of 1 C between the potential window of -0.4 to + 0.4 V. (vs SCE). The GCD profiles of LTO-MWCNTs (a), MWCNTs (b), pristine LTO (c) modified GCEs, and bare GCE (d), which were performed at 25°C, are shown in Fig. 12a. All the electrodes have flat plateaus in their charge/discharge curves, as shown in Fig. 12a, which agrees well with the CV data. The estimated initial discharge capacities of electrodes a, b, c, and d were 176 mAh g− 1, 158 mAh g− 1, 142 mAh g− 1, and 132 mAh g− 1, respectively. These results showed that the initial discharge capacity at the LTO-MWCNTs (a) nanocomposite electrode was greater than the initial discharge capacities at the other three electrodes (b, c, and d), as well as good comparable with the previously published literatures [33–36]. The high initial discharge capacity at LTO-MWCNTs electrode can be explained by the fact that i) The LTO spinal structure's ionic intercalation and de-intercalation are correlated with the redox behavior of Ti+ 4/Ti+ 3 [89]. ii) A conductive network is created when well-bonded MWCNTs cling firmly to the surface of LTO nanoparticles. This network offers LTO nanoparticles robust binding, which improves initial discharge capacity to a higher degree. iii) In addition, the increased active surface area and improved electrochemical activity of LTO-MWCNTs/GCE were achieved in comparison to the above electrodes [90, 91].
The cycling stability with retained discharge capacities were determined to be 167 mAh g− 1, 148 mAh g− 1, 130 mAh g− 1, and 118 mAh g− 1 for LTO-MWCNTs (a), MWCNTs (b), and pristine LTO (c) and bare GCE (d), respectively. We found capacity retention rates of 95%, 94%, 92%, and 90%, respectively, even after 30 discharge cycles (Fig. 12b). These findings support the LTO-MWCNTs nanocomposite as a superior anode material for LIBs with high-capacity retention.
Figure 12a & Fig. 12b