Association of TNM stages and six clinical indicators
For the six clinically indicators related to lung adenocarcinoma, the TNM staging
of the patients was investigated, and the Wilcoxon rank sum test was used to obtain
the significant p values of the indicators at different stages(Figure 1). The results
indicated that there were significant differences in the 6 indicators between the
early stage(TNM I and TNM II) and the late stage(TNM III and TNM IV). The significance
of two stages(early and late) was obviously better than that of four stages. So the
subsequent analysis was carried out in two stages.
Figure 1: Association of TNM stages and six clinical indicators
The higher the column in the graph, the more significant it is. The red line represents
the 0.05 threshold.
Association of PD-1 SNPs with lung adenocarcinoma in different models
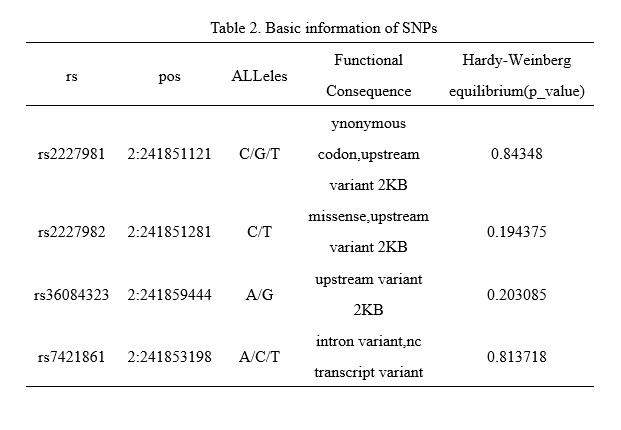
For the four SNPs(rs2227981, rs2227982, rs3608432, rs7421861), we used chi-square
test of three models (allele model, dominant model, recessive model) to test the difference
of SNP genotypes between two stages in all lung adenocarcinoma samples, male samples,
and female samples separately (Figure 2). These results demonstrated that rs2227981
was significantly correlated with lung adenocarcinoma stages in allele model and recessive
model. The women samples were significantly correlated with lung adenocarcinoma stages
in all three models. rs2227982 and rs36084323 were significantly correlated with lung
adenocarcinoma staging in all three models. The rs7421861 in male samples were significantly
correlated with lung adenocarcinoma stages in allele model and dominant model. Therefore,
rs2227981, rs2227982, rs3608432, and rs7421861 were expected to be markers to distinguish
lung adenocarcinoma stages.
Figure 2: Association of PD-1 SNPs with lung adenocarcinoma in different models
A: allele model
B: dominant model
C: recessive model
The dotted red line indicates p_value=0.05
Furthermore, the correlation between lung adenocarcinoma stages and SNP genotypes,
smoking, sex, and age were analyzed by logistic regression model under dominant and
recessive models, respectively (Figure 3). Except for rs7421861, the other three SNPs
were significantly correlated with the staging of lung adenocarcinoma in both dominant
and recessive models.
Figure 3: P_value of logistic regression model under dominant and recessive models
The dotted red line indicates p_value=0.05
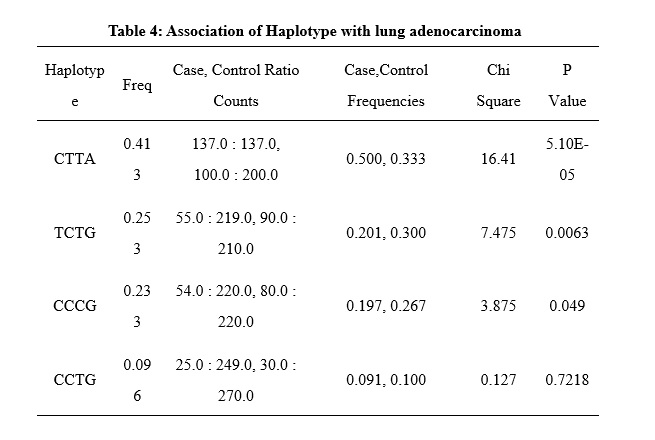
In addition, we also used Haploview software to test the correlation between SNP haplotypes
and lung adenocarcinoma staging (Table 3 and Table 4 in the Supplementary Files).
Among the four haplotypes, three showed a significant correlation with lung adenocarcinoma
stages. This further indicated that the four SNPs on PD-1 can be used as potential
markers for lung adenocarcinoma staging.
The difference of Six Clinical Indicators in different Stages and different SNP genotyping
We examined the difference of six clinical indicators in the staging of lung adenocarcinoma(Figure
4). There were significant differences in the six indicators between the early stage
and late stage samples, either using the whole sample or the male and female samples
were used separately.
Figure 4: Difference of Six Clinical Indicators in different Stages
A: CEA
B: NLR C: LYM D: GRAN E: WBC F: LDH
Then the association between each SNP and clinical indicators were examined in the
whole samples, early stage samples, and late stage samples respectively (Figure 5).
Figure 5: Association between SNP genotyping and six indicators
A: rs2227981
B: rs2227982
C: rs36084323
D: rs7421861
The dotted red line indicates p_value=0.05
It can be seen that in lung adenocarcinoma, the correlation between four SNPs and
six clinical indicators shows some differences between men and women samples.
For all the samples, there was a significant correlation between rs2227981 and three
indicators: CEA, NLR, and GRAN. The genotyping of rs2227982 and rs36084323 were significantly
correlated with NLR, GRAN, and WBC. The rs7421861 typing was significantly correlated
with LDH.
For male samples alone, there was a significant correlation between rs2227981 and
three indicators: CEA, LYM, and LDH. The genotyping of rs2227982 and rs36084323 were
significantly correlated with LYM, GRAN, and WBC. The rs7421861 typing was significantly
correlated with LDH.
For female samples alone, there was a significant correlation between rs2227981 and
five indicators: CEA, NLR, GRAN, WBC, and LDH. The rs2227982 and rs36084323 were significantly
correlated with CEA, NLR, and LYM. The rs7421861 was significantly correlated with
LDH.
The differences in gender between the correlations of these SNPs and clinical indicators
may provide a reference for the clinical test results of patients.
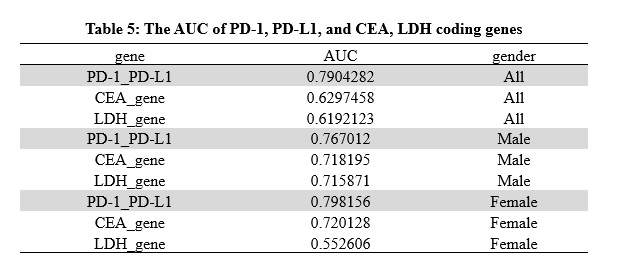
Classification efficacy evaluation of genes and clinical indicators
To evaluate the classification efficiency of PD-1, its target gene PD-L1 and coding
genes of CEA and LDH, the Support Vector Machine (SVM) method was employed to construct
a classifier for early stage and late stage samples, based on these genes. The gene expression data and clinical data were obtained from TCGA(https://cancergenome.nih.gov/). Leave-one-out cross-validation (LOOCV) was carried out to assess the performance. The receiver operating characteristic (ROC) curves were plotted and the areas under
the curves (AUC) were computed(Table 5 in the Supplementary Files). It can be seen from the results that when PD-1 and PD-L1 genes are used, AUC is
greater than 0.75 under different gender conditions, and was greater than that of
LDH and CEA-related genes.
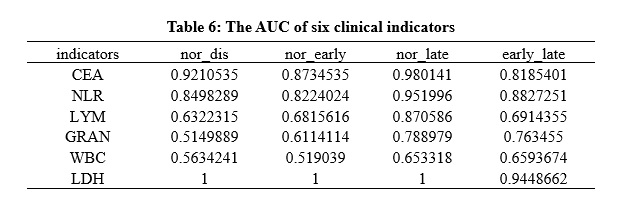
Then the six indicators were also tested (Table 6 in the Supplementary Files). The result indicated
that CEA, GRAN, LDH, and NLR have good classification efficiency in different genders.
LYM has good classification efficiency in female samples.