3.1. Defective inorganic layer via plasma electrolysis
Before studying the interaction between the MB inhibitor and the surface of the defective IL, it was necessary to evaluate the characteristics of the Mg alloy fabricated using PEO as the IL of interest.
As shown in Fig. 1a, the microstructure and chemical composition of the defective IL were investigated; a crater-like structure was formed as a result of the micropores induced by the intense discharges during PEO. Therefore, an IL with a pore diameter of approximately 2 µm was observed. These discharges facilitated electrochemical reactions, including the anodic formation of Mg ions at the interface between the IL and the metal substrate, i.e., Mg → Mg2+ + 2e−. According to the inset of the EDS graph, the elemental composition of the IL was Mg, Si, and O, which supported the formation of oxides and silicates of Mg on the surface of the IL. The cross-sectional micrographs in Fig. 1b reveal that the IL comprised two layers: an outer porous layer and an inner barrier layer. The ILs had an average thickness of approximately 18 µm. Figure 1c shows the elemental composition of the cross-sectional micrograph obtained by line scanning with EDAX. It can be inferred that Si and small amounts of F on the IL come from the PEO electrolyte. Furthermore, Fig. 1c shows the relative amounts of the elements detected in the cross-section of the IL, which contains high amounts of Mg, O, and Si and small amounts of F on the outer and inner layers.
The XRD pattern in Fig. 1d shows that MgO was the main oxides in the IL. Based on the reference intensity ratio value, the relative ratio of MgO to MgSiO3 (PDF 01-074-1225) in the oxide layer was 7:3. The representative XPS bands of Mg (2p) and O (1s) of the samples are shown in Fig. 1e-f. The Mg (2p) core level exhibited two binding energies, i.e., 49.7 eV for Mg-O bonding and 50.6 eV for Mg-Si bonding, demonstrating that the Mg state existed exclusively in the form of MgO and MgSiO3, as displayed in Fig. 1e [32]. Moreover, the O peak was divided into O (1s) 531.3 eV for O-Mg bonding and O (1s) 532.4 eV for O-Si bonding, as shown in Fig. 1f [9]. These results are consistent with the formation of MgO and MgSiO3 in the IL.
3.2. DFT-molecular simulation of MB-typed compound working as organic inhibitor
QC calculation is an important method in the field of corrosion control for studying the molecular structure of a corrosion inhibitor and its correlation with inhibition mechanisms [33–35]. Thus, in this study, DFT-molecular simulations were carried out to investigate the inhibitory effect of three organic inhibitors with different electron donors, i.e., O, S, and N for MBO, MBT, and MBI, respectively. The fully optimized geometric structure, electrostatic potential (ESP), and density distribution of the frontier molecular orbitals of these inhibitors are shown in Figs. 2 and 3. The QC parameters obtained, including EHOMO, ELUMO, △E, µ, and all other parameters, are listed in Table 1.
Table 1
QC parameters of three MB inhibitors from the DFT-molecular simulation.
| Inhibitor | EHOMO (eV) | ELUMO (eV) | ΔE | µ (D) | A | I | χ | ΔN | ω+ | ω- |
| MBO | -6.47 | -1.10 | 5.37 | 2.23 | 1.10 | 6.47 | 2.69 | 0.03 | 1.11 | 4.90 |
| MBT | -6.43 | -1.31 | 5.12 | 0.91 | 1.31 | 6.43 | 2.56 | 0.04 | 1.31 | 5.18 |
| MBI | -5.73 | -1.21 | 4.52 | 4.72 | 1.21 | 5.73 | 2.26 | 0.07 | 1.21 | 4.68 |
As shown in Fig. 2, the negative regions of the ESP map are associated with nucleophilic reactivity, and the positive regions are associated with electrophilic reactivity. Generally, metal oxides acting as electrophilic agents attract the negatively charged sites of the inhibitor molecules. Typically, the nucleophilic centers of inhibitors are electronegative groups, such as heteroatoms with lone electron pairs and π-electrons in conjugated double bonds, and these are easily available to form covalent bonds [36]. The electron-rich region observed in MBI was more concentrated at one point on the S atom, while those in MBT and MBO were more dispersed because of the presence of multiple heteroatoms with high electronegativity. Furthermore, these results suggest that MBI molecules easily transferred or shared lone pairs of electrons and interacted on the surface of defective ILs.
As shown in Fig. 3, the HOMO and LUMO for all inhibitors were distributed around the aromatic and imidazole rings. The entire region of the planar structure is the active center, with several feasible adsorption sites absorbed on the surface of the inorganic coating. Typically, a low ELUMO implies that the molecule is an electron acceptor, whereas a high value of EHOMO shows the tendency of the organic molecule to donate electrons to a suitable acceptor. As shown in Table 1, △E follows the order MBO > MBT > MBI, which reflects the stability of a certain molecule. A low value of ΔE indicates that some molecules are prone to obey the adsorption process. The energy gap reflects the chemical stability of the inhibitor molecules, and a lower value of △E indicates that the investigated inhibitor can be easily absorbed on the surface of the metal oxide [37].
Furthermore, the values of △N, which represent the fraction of π- and free electrons transferred from the MB inhibitor to the IL, were in the order MBI > MBT > MBO. If △N < 0.36, the binding efficiency was improved by either an increase in EHOMO or a decrease in △E [38]. Dipole moment (µ) is an important index for investigating the inhibition mechanism of the IL against corrosion. In the aqueous conditions considered in this study, high values of µ in Table 1 led to strong adsorption on the IL because of the electronic force [39].
Local reactivity can adequately represent the local active sites of an inhibitor molecule [40]. Frontier orbital electron densities are useful for detailed characterization of donor-acceptor interactions. In donor and acceptor molecules, the HOMO and LUMO densities are critical to the charge transfer (electrophilic electron density, fk+, and nucleophilic electron density, fk−, respectively).
The calculated Fukui indices of condensed functions (fk+ and fk−) for all inhibitor molecule forms of MB compounds are shown in Fig. S1 and Table S1, respectively. The active centers available for nucleophilic attacks are atoms with a high value of fk−, whereas the active centers available for electrophilic attacks correspond to a high value of fk+ [41]. As shown in Fig. S1 and Table S1, the active sites are in agreement with the analysis that atoms S13, S14, and S16 on MBO, MBT, and MBI, respectively, contribute to nucleophilic attacks, implying their electron donating tendency to form more stable coordination bonds with the inorganic surface. After protonation via the electron transfer pathway among the inhibitor particles, the S atom loses its electron donor property because it is blocked by the H+ proton. The other electron donor atoms, i.e., O15, S12, and N14 on MBO, MBT, and MBI, respectively, retain their properties of producing electrons, and they appear as new electron donor centers. These results show that the local reactivity of these sites is involved in donor-acceptor interactions through retro-donation. Moreover, these inhibitor molecules are plane-conjugated structures, which implies that a perpendicular mode may be required to obtain the strongest connection if the inhibitor is adsorbed on the IL.
3.3. Electrochemical behavior by MB inhibitor
3.3.1. Polarization behavior
The Tafel polarization approach with respect to the IL was used to examine the kinetics of the cathodic and anodic area in the 3.5 wt.% NaCl solution in the absence and in the presence of the corrosion inhibitors MBO, MBT, and MBI at 298 K, as shown in Fig. 4a. The kinetic parameters derived from the polarization curves, including the corrosion current density (icorr), corrosion potential (Ecorr), and anodic-cathodic Tafel slopes, are presented in Table 2.
Table 2
Potentiodynamic polarization results of the inorganic layer in inhibited and uninhibited 3.5 wt.% NaCl solution.
| Sample | Ecorr (V) | icorr (nA cm− 2) | βa (V decade− 1) | -βc (V decade− 1) | RP (Ω cm2) | η |
| IL | -1.39 | 8.46 × 10² | 6.90 × 10− 2 | 2.32 × 10− 1 | 2.73 × 10− 5 | - |
| IL-MBO | -1.35 | 2.47 × 101 | 1.15 × 10− 1 | 2.31 × 10− 1 | 1.35 × 10− 3 | 97.08% |
| IL-MBT | -1.42 | 2.20 × 101 | 8.97 × 10− 2 | 2.14 × 10− 1 | 1.25 × 10− 3 | 97.40% |
| IL-MBI | -1.45 | 2.06 × 101 | 1.62 × 10− 1 | 1.88 × 10− 1 | 1.83 × 10− 3 | 97.57% |
Figure 4a shows that after the addition of 1 mM organic inhibitor to the 3.5 wt.% NaCl solution, the cathodic and anodic IL dissolution as well as cathodic hydrogen evolution reactions were inhibited. As opposed to those of the porous IL, the polarization curves of IL-MBO, IL-MBT, and IL-MBI progressively shifted to the upper-left region, where lower current density and higher potential were achieved. The inhibition of these reactions was influenced by secondary electron donor atoms, which are heteroatoms from organic inhibitor structures. Based on Table 2, the low values of icorr for IL-MBO, IL-MBT, and IL-MBI indicate protective behavior against corrosive media and environmental attacks, while a relatively positive value of Ecorr corresponds to anodic inhibition by an organic inhibitor. However, there was a slight shift in the Ecorr values with different inhibitors. Compared with the uninhibited solution, in the presence of organic inhibitors, the potential corrosion shifts were in the range of 100–150 mV. These results suggest that the change in Ecorr in the inhibited solution is greater than that in the uninhibited solution. The polarization resistance (Rp) was calculated using the Stern-Geary equation (Eq. (13)):
i corr = \(\frac{\beta a \beta b}{2.303 (\beta a + \beta b)}\) \(\frac{1}{Rp}\) (13)
Where βa, βc, and icorr are the anodic slope, cathodic slope, corrosion current density measured in uninhibited saline solution, and corrosion current density determined in inhibited solutions, respectively. All three MB compounds exhibited high corrosion resistance on the surface of the IL, as verified by the high value of η. However, the highest value was obtained for IL-MBI, with η = 97.57%, confirming that MBI was the best corrosion inhibitor in this study. In addition, Table 2 shows that the corrosion current density (icorr) values of IL-MBI are very small, while the polarization resistance (Rp) values are larger than those of IL, IL-MBO, and IL-MBT.
3.3.2. EIS coupled with equivalent circuit model
To obtain further information about the corrosion mechanism, EIS investigation of the IL was carried out in inhibited and uninhibited 3.5 wt.% NaCl solutions. Nyquist plots of the corrosion systems containing the three MB inhibitors recorded at various immersion times are compared in Fig. 4b. The EIS results showed that the inhibited specimens exhibited a larger impedance modulus compared with the uninhibited specimens. In the IL, a small semicircular pattern was observed in the Nyquist spectrum shortly after immersion for 30 min. To decouple the various electrochemical processes occurring in the IL with an organic inhibitor, each impedance response was fitted to an equivalent circuit model by considering the physical and chemical states of the system. In the proposed model, Rs represents the solution resistance between the sample and counter electrode, and the outer porous layer and inner barrier layer are represented by the coating resistance (RC) and constant phase element (CPEC), respectively. RCT represents the contribution of charge transfer to the overall corrosion resistance, and CPEDL represents the double-layer capacitance. The parameter values drawn from this equivalent circuit are presented in Table 3, which lists the EIS fitting data and the experimental values obtained from the short-term impedance data (Fig. 4b).
Table 3
Electrochemical impedance parameters of the inorganic layer from 106 to 10− 1 Hz in inhibited and uninhibited 3.5 wt % NaCl solution.
| Sample | RS (Ω cm2) | YC (S*sa) | aC | RC (Ω cm2) | YDL (S*sa) | aDL | RCT (Ω cm2) |
| IL | 0.76 × 101 | 6.01 × 10− 7 | 7.33 × 10− 1 | 9.66 × 10³ | 2.23 × 10− 6 | 6.94 × 10− 1 | 5.79 × 10⁴ |
| IL-MBO | 8.83 × 10− 10 | 5.86 × 10− 7 | 7.40 × 10− 1 | 1.76 × 10⁴ | 4.66 × 10− 6 | 6.47 × 10− 1 | 1.52 × 10⁷ |
| IL-MBT | 4.38 × 10− 5 | 5.74 × 10− 7 | 7.42 × 10− 1 | 1.89 × 10⁴ | 3.58 × 10− 6 | 6.58 × 10− 1 | 2.80 × 10⁷ |
| IL-MBI | 1.28 × 10− 9 | 6.20 × 10− 7 | 7.36 × 10− 1 | 2.39 × 10⁴ | 2.46 × 10− 6 | 6.71 × 10− 1 | 3.00 × 10⁷ |
As shown in Fig. 4b, PEO treatment and use of MB compounds as corrosion inhibitor in a 3.5 wt.% NaCl solution considerably improved the anti-corrosive properties of the metal substrate. The least desirable corrosion performance, with the smallest semicircle in the Nyquist plot. The corrosion resistance of the IL in the inhibited solution was significantly improved because of the formation of protective layers on the surface.
The high-frequency and low-frequency resistance-capacitance loops represent the properties of the electric double layer formed at the interface between the inorganic surface and the corrosive medium and the layer of composite product on the electrode, respectively [42]. As shown in Fig. 4b, MBI had the largest capacitance loop and highest impedance magnitude. Therefore, Table 3 shows the highest values of RC (2.39 × 10⁴ Ω cm2) and RCT (3.00 × 10⁷ Ω cm2) from the IL-MBI specimens, thus supporting the conclusion that MBI is the best corrosion inhibitor of the IL in this study.
Table S2 lists the impedance parameter data obtained from the fitting of the equivalent circuits and the experimental values obtained from the prolonged immersion test. To analyze the prolonged EIS spectra of the IL, an equivalent circuit model was developed, as shown in Fig. 5 and Fig. S3. The circuit model in Fig. S2 was based on impedance plots and EIS analyses of previous studies on ILs to explain the corrosion behavior of Mg alloys [43–46]. RS, CPEC, RC, CPEDL, and RCT in the circuit diagram are the same as those in the previous model shown in Fig. 4b; additionally, RCP represents the resistance of the composite products, and L describes the active movement of metal ions during corrosion at low frequencies [47]. The impedance response of the IL substrates was characterized by capacitive properties (CPECP), which appear at intermediate frequencies (10–102 Hz), whereas an inductance loop (L) was observed at low frequencies (1–0.1 Hz).
As shown in Fig. 5a and Table S2, after immersion for 1 h at low frequencies, compared with IL-MBO (2.1 × 10⁶ Ω cm2), IL-MBT (4.23 × 10⁵ Ω cm2), and IL-MBI (2.4 × 10⁶ Ω cm2), the IL specimen exhibited the smallest semicircle and smallest value of RCT (3.56 × 10⁴ Ω cm2). In contrast to IL, the Nyquist plots of IL-MBO, IL-MBT, and IL-MBI progressively had a larger semicircle where the resistance was achieved. The high values of RC and RCT for the IL inhibitor indicate protective behavior against corrosive ion attacks, while a relatively small value of L corresponds to anodic inhibition by MB compounds in the corrosion medium. Therefore, the capacitive loop of the IL-MBI specimen exhibited the largest diameter among all specimens considered herein (Fig. 5 and Fig. S3). Thus, the prolonged EIS results suggest that IL-MBI provides superior corrosion protection.
3.4. Formation of hybrid architecture by organic MB inhibitor
3.4.1. Morphological observation of nature-inspired composite layer
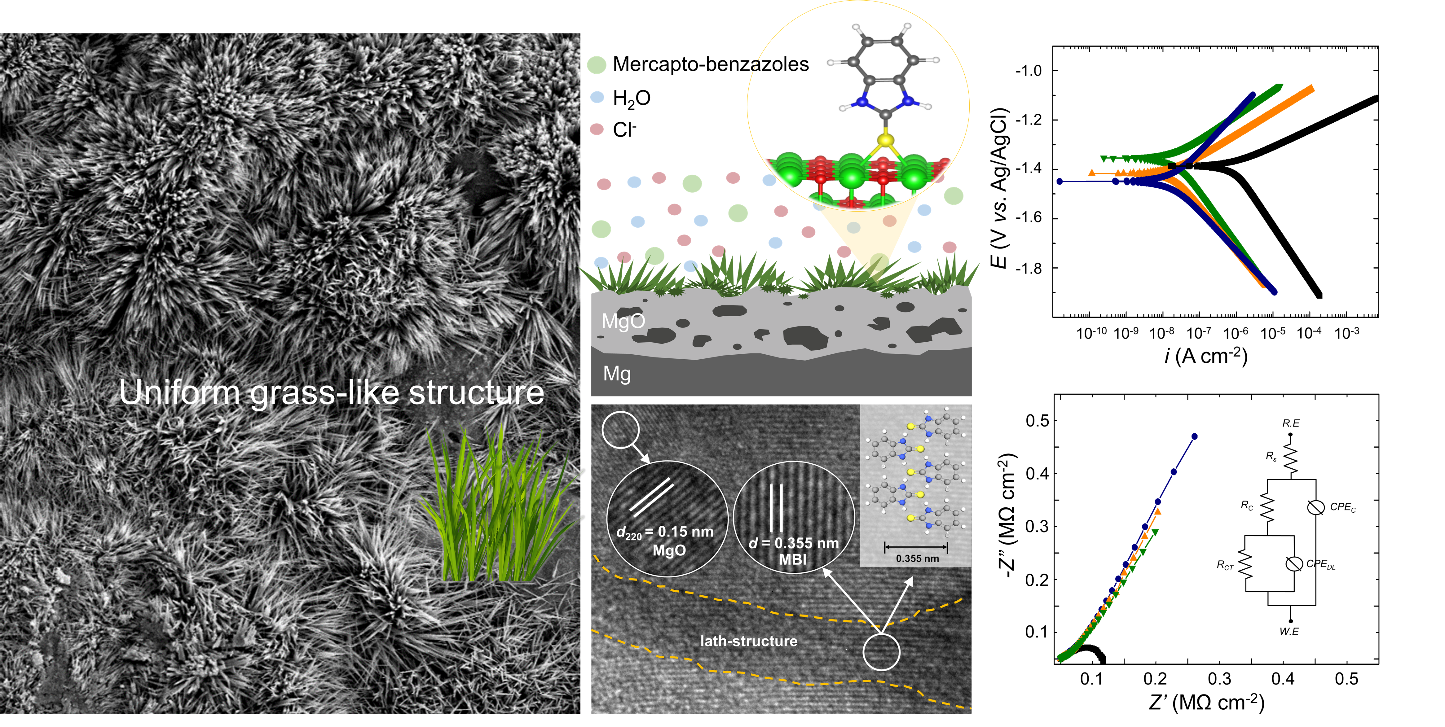
Figure 6a-d show the microstructures of the defective IL after immersion in inhibited and uninhibited 3.5 wt.% NaCl solutions for 72 h. The IL specimen in Fig. 6a was strongly corroded by the aggressive solution, as indicated by the rough, cracked, and damaged surfaces (delamination). In contrast, in the presence of an MB inhibitor, shown in Fig. 6b-d, the surfaces of the specimens were protected and covered by the root network and the grass-like structure. These observations confirm that protective layers are formed on the surface of the IL by the three organic inhibitor molecules, which prevent the attack of the corrosive medium and thereby effectively reduce the corrosion rate. Therefore, it can be assumed that MB compounds are good corrosion inhibitors for ILs, even with different atoms as electron donors. Nevertheless, the surface of the IL-MBI specimen was covered by the grass-like structure (protective layer) and more homogeneous than the other specimens. More importantly, unlike the other specimens, the surface of the IL-MBI specimen was covered by the grass-like structures in a homogeneous manner.
After the prolonged corrosion tests, it is clear that the new microstructure may provide corrosion protection for the entire surface. This was indicated by the cracks and delamination on the surface of the IL, which can lead to physical damage and attack by corrosive ions. In Fig. 6b-d, this autonomous action was responsible for the reliable corrosion protection for 72 h because of the high surface coverage of the root network and the grass-like structures. The microstructure of the IL-MBO substrate after 72 h of immersion is shown in Fig. 6b. The coating surface was covered with a small amount of the root network. However, less propagation deeper into the oxide platform was observed, suggesting that these inhibitor fragments can protect the IL against corrosion damage. In contrast, the microstructure of IL-MBT after immersion for 72 h showed signature branching root fragments (the root network) on the surface of the IL. Moreover, the surface of IL-MBI was homogeneous and uniformly covered by the grass-like structures (protective layers). Thus, the addition of organic inhibitors to the corrosion test solution contributed to a significant change in the surface morphology of the IL.
The EDS results in Fig. 6e show the relative amounts of the elements detected in each specimen. Major differences were observed in the elemental analyses of the resultant ILs containing Mg, O, and Si. In contrast, Cl, C, and S were detected in the elemental analyses of the IL as protective products during corrosion. According to the XRD patterns in Fig. 6f, MgO was the main constitutive compound present in all the specimens, even though the PEO electrolyte contained silicate. Figure 6f shows that Mg, MgO, MgSiO3, and MgCl2 were present in the IL after corrosion. Based on the apparent peak intensities, the relative amount of MgO in the IL was the highest after immersion in either the inhibited or uninhibited solution. For the IL specimens, regarding the relative abundance of the constitutive compounds, the amount of MgO on the IL after immersion in inhibited or uninhibited solutions was estimated using the relative peak intensity ratios. Meanwhile, the peaks corresponding to MgCl2 were more intense, which may indicate that X-rays were able to reach the MgCl2 substrate as a corrosion product after immersion in the 3.5 wt.% NaCl solution [48].
The nucleation and growth mechanism of the above-mentioned the grass-like composite structure is proposed based on HR-TEM observations. First, Fig. 7a confirms a magnified view of the network structure in IL-MBI, which is the grass-like structure that after scratching becomes a lath structure. The lattice spacing values (~ 0.15 nm) are in agreement with the (220) plane of MgO, as shown in Fig. 7b. MgO is the major constituent of the IL that interacts with MBI during immersion in a corrosion solution test. These clusters function as nuclei that are desirable for the further self-assembly of MBI molecules. Furthermore, Fig. 7b shows the beam damage on the lath structure area containing MBI molecules as the organic compound.
In addition, another lattice spacing value of ~ 0.355 nm was identified in the lath structure, as shown in Fig. 7b. According to the ESP mapping of MBI molecules, the growth of MBI leads to massive agglomerates of organic materials in the form of grass-like composite structures because of specific H-bonds between H atoms from S and N in the MBI structure [49]. Once the grass-like structures grew, all MBI molecules rearranged in a certain direction, satisfying the lowest energy level supported by a complicated network of intermolecular H-bonds. According to the lattice spacing value of ~ 0.355 nm, Fig. 7c reveals the distance between two organic chain molecules. These groups of intermolecular bonds give rise to the development of branched grass-like structures as the final shape of the MBI that grows on top of the IL, which is referred to as the IL-MBI microstructure in Fig. 6d.
3.4.2. Compositional analysis of nature-inspired composite layer
The representative XPS bands of Mg (2p), O (1s), Cl (2p), C (1s), and N (1s) in the present Mg alloy fabricated by PEO and the specimens after the corrosion test in the inhibited and uninhibited 3.5 wt.% NaCl solution is shown in Fig. 8a-h. Mg (2p) peaks at binding energies of ~ 49.5 and ∼50 eV were identified in IL and IL-MBI, respectively (Fig. 8a,d) [32]. The slight shift toward higher binding energy in the case of Mg is attributed to either the localized dispersion of Mg atoms in the IL or the change in coordination number in the inorganic-organic bonds with corrosion inhibitors. A positive shift in the binding energy in the case of MBI indicates a higher positive charge on Mg, implying that a number of Lewis acid sites were activated in the Mg atoms as a result of bonding with MBI molecules. Figure 8c,f displays Cl (2p) spectra consisting of single peaks at ~ 199 eV in the IL and IL-MBI, which are related to crystalline MgCl2 as corrosion products. Based on the peak appearance in Fig. 8f, the peak intensity of Cl (2p) was lower than the other peak elements. Because of the solubility of MgCl2 in aqueous solution. Figure 8f indicated small amount of MgCl2 compound on the surface of IL layer after corrosion. The peak shift toward higher binding energies in IL-MBI suggests a change in the electronic environment around C and N atoms, implying their contribution to organic-inorganic bonding [50, 51]. In addition, the presence of organic components was confirmed (Fig. 8g-h). The peak intensities of C (1s) at ~ 284, ∼285, and ∼295.5 eV, as well as the peak intensities of N (1s) at ~ 398.5 and ∼400 eV, intensified during the transition of nucleation to growth for the interaction between the IL and the organic inhibitor molecules, shown as the grass-like composite structure (protective layer) in Fig. 6d [52].