2.1 Trials and Setup
Controlled experiments were conducted at the University Center of the Educational Foundation of Barretos, Barretos, Sao Paulo, Brazil. The purpose of the trials described in Section 2.1 was to determine the effects of UWC on N mineralization rate, soil properties, and the growth of broccoli and lettuce. The initial screenings for N mineralization of UWC in three different soils were carried out in a soil fertility laboratory (Experiment 1). The beneficial effects of UWC on soil properties compared to urea fertilizer were validated in OS soil (Experiment 2). Finally, the agricultural effect of UWC on the growth and nutritional quality of greenhouse-grown lettuce and broccoli plants was determined in comparison to the urea fertilizer (Experiments 3 and 4).
2.1.1 Soil Collection and Chemical and Physical Characteristics
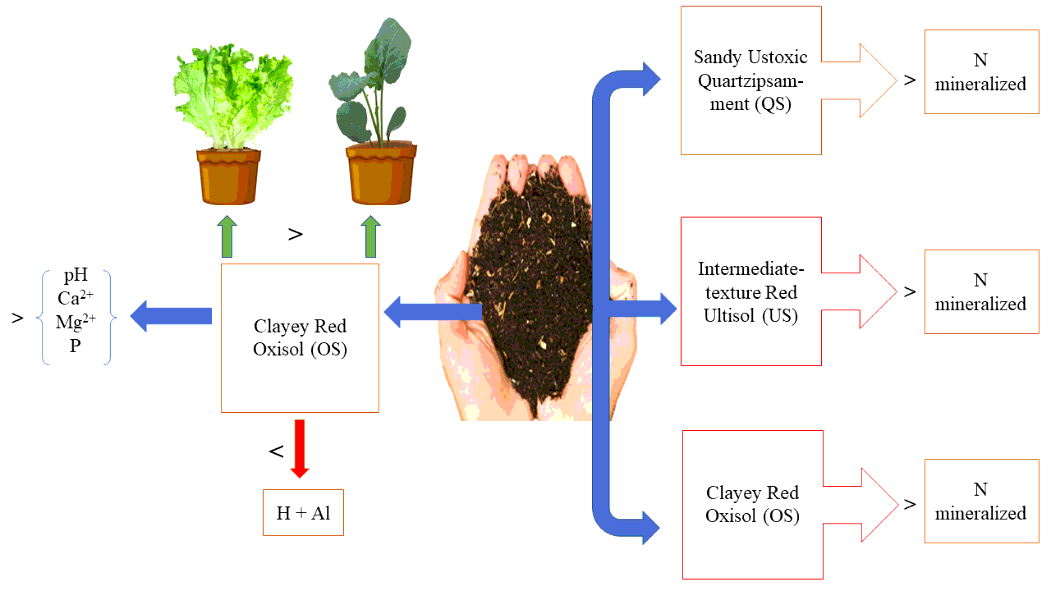
The soils used had different textures, according to the FAO criteria [22]: (1) clayey red Oxisol (OS), equivalent to eutrudox; (2) intermediate-textured red Ultisol (US); and a Sandy Ustoxic Quartzipsamment soil (QS), equivalent to hapludult, according to the IUSS Working Group WRB [22], respectively. The OS and US soils were collected in Barretos, São Paulo, Brazil: RO in a native pastured-forest area, and RU in a pastured area, whereas the QS soil was sampled in Jaboticabal, SP, Brazil, in a pastured area. Approximately 50 kg of each soil was collected from the 0–0.2 m layer. Soil samples were air-dried, sieved (4 mm), and stored in a well-ventilated storage room. Subsamples were collected for chemical analysis (pH, H + Al, P, Ca, and Mg) using the methods described by Raij et al. [22], and the physical (particle size) analysis was performed following the methodology described by Embrapa [23]; these data are provided in Table S1.
2.1.2 Description, Composition, and Classification of Heat-treated Urban Waste Compost
The urban waste compost used in this study was derived from the organic fraction of domestic garbage collected in the city of Araraquara, São Paulo, Brazil. The urban waste composting process involves three main steps. It begins with rough screening of the waste to remove non-organic materials (e.g., plastic and glass), and retain only the organic part. Thereafter, the material is moistened with water to 55% humidity to stimulate the decomposition phase. The third phase is performed in a yard where organic waste is deposited on wooden pallets in windrows to enable static aerobic decomposition to occur.
The aeration technique employed consists of passive aeration using perforated plastic tubes below each windrow, without any type of compressor. A constant renewal of hot to cold air promotes aeration of the entire mass contained in each windrow. The windrows are moistened with leachate, promoting the reintegration of leachate into the process. The temperature and pH value of the compost during composting started at 60 °C and 5.0, respectively, and reached 35 °C and 8.5, respectively. After stabilization of the organic matter, the material deposited in the windrows is removed and sieved (< 15 mm). Then, the UWC is dried in ovens at temperatures of 65 to 70 °C for 3 days, following which the compost is powdered (< 0.6 mm) to obtain a final homogeneous product.
The chemical characteristics of UWC were determined using the methodology of Abreu et al. [24] according to the presence of toxic elements (e.g., heavy metals). The environmental aspects related to the reuse of residues in agriculture are provided in Table S2. The UWC was classified as a class-C simple organic fertilizer, according to the Normative Instruction No. 25, 2009, of the Brazilian legislation, and by this same legislation, the particle size showed the following characteristics: 0.04% retained on the NBR #10 sieve mesh size, 26.51% on the NBR #20 sieve, 60.25% on the NBR #50 sieve, and 13.20% retained on the NBR #50 sieve. The gravimetric moisture of the compost was 4% [25].
2.2 Incubation Experiments
2.2.1 Determination of Nitrogen Mineralization Rate
Experiment 1. This experiment was carried out under laboratory conditions to evaluate the N mineralization in three different soils (QS, US, and OS) fertilized with different amendments of UWC during an incubation period of 84 days. Determination of N mineralization rate was performed according to the methodology proposed by Coscione and Andrade [26]. Four UWC doses (12.5, 25.0, 37.5, and 50.0 mg dm-3) were mixed with the three soil samples (QS, US, and OS) and placed in 0.25-dm3 polyethylene bottles. Each bottle contained 100 g of soil mixed with the corresponding compost dose. All soil and UWC dose combinations were prepared in triplicate. During the 12 weeks of incubation, the samples were analyzed at the following times: 0, 7, 14, 28, 42, 56, 70, and 84 days. The moisture of the samples was adjusted to 70% of soil water-holding capacity by adding deionized water. The temperature was controlled to 25–28°C and monitored daily after the first sample was weighed. The trial was a factorial (4 × 3) randomized complete block design (RCBD) with three replications.
To determine mineral N (MN), 3 g of soil mixture was extracted in 15 mL 1 M KCl with 1 h of shaking. The soil mixture was filtered through Whatman 41 filter paper (MN 616; Whatman International, Maidstone, UK), and the extract was stored at -18°C until analysis. The IN concentration of each soil sample was then analyzed by flow injection analysis (FIA, Foss Tecator; FOSS Analytical, São Paulo, Brazil) [27] and was calculated based on the dry soil weight after 0, 7, 14, 28, 42, 56, 60, and 84 days of the incubation period.
Removal of mineral N from the soil solution by denitrification or immobilization was not considered, and only net N mineralization (NNM) was estimated. The NNM of each soil mixture sample was calculated as the fit of several kinetic models to the evolution of soil mineral N. The NNM was described by a zero-order kinetic model as follows:

where N(t) is the amount of MN at time t (days), N0 is the initial amount of mineral N (µg N g−1 soil), and k0 is the zero-order N mineralization rate (µg g−1 d−1 N).
The mineralized N of the UWC doses was calculated as described previously by Mohanty et al. [28]. The percentage of total N mineralized (%TNM) from each UWC dose at the end of the incubation time (84 days) was calculated as described by Azeez and Van Averbeke [29], as follows:

where NM is mineralized N and N is the total N applied in the UWC doses.
2.2.2 Determination of Soil Properties after Urban Waste Compost and Urea Treatments
Experiment 2. This experiment was carried out under laboratory conditions to evaluate soil properties and fertility in an OS soil fertilized with UWC or urea and incubated for 30 days. Pots were used in this experiment and were distributed in a factorial arrangement (4 × 2) in an RCBD, with four replications. Four N doses (12.5, 25.0, 37.5, and 50.0 mg dm-3) and two different N sources (UWC and urea) were applied. Each experimental unit consisted of 0.25-dm3 polyethylene pots filled with the OS soil. Phosphorus and potassium were equilibrated and applied to all the treatments, according to the chemical soil analysis results (Table S1), and following the recommendations of Trani and Raij [30]. This was accomplished by mixing 5 g of a 0-25-25 compound fertilizer with the soil in each pot.
After 30 days of incubation, six randomized soil subsamples were collected from each pot, air-dried, and analyzed for the following soil parameters: pH, total acidity (H + Al), exchangeable calcium (Ca), magnesium (Mg), and P resin. After drying, the samples were defragmented and passed through a 2-mm mesh, homogenized, and stored in a refrigerator for chemical analysis, following the methodology described by Raij et al. [22]. The soil pH was measured in CaCl2 using a pH meter. Total acidity (H + Al) was determined in a calcium acetate solution. The P resin and exchangeable bases, extracted with ion exchange resin, were quantified using the colorimetric method and a standard curve previously obtained using a visible spectrophotometer (SP-1105; Ningbo Hinotek Technology, Shanghai, China). Exchangeable Ca2+ and Mg2+ were extracted in 1 M ammonium acetate saline solution at pH 7.0 and quantified using an atomic absorption spectrophotometer (Varian® SpectrAA, 50 B; Varian Medical Systems Australasia, Belrose, NSW, Australia).
2.3 Determination of Soil Properties after UWC and Urea Treatments
Experiments 3 and 4. Broccoli (Brassica oleracea L. cv. ‘Avenger’) and lettuce (Lactuca sativa L. cv. ‘Amelia’) crops were grown in a glass greenhouse under natural light conditions, with day/night temperatures of 24 °C/18 °C (± 3.5 °C), a 10 h day/14 h night photoperiod, and 70–75% relative humidity. Seeds of both plant species were sown in 128 cell polystyrene trays containing a vermiculite mixture (3:1) and were irrigated three times per day for 15 days using deionized water. Thereafter, seedlings of both plant species were transplanted to 8-dm3 polyethylene pots filled with the OS soil, with three seedlings per pot. Ten days after transplanting (DAT), plants were thinned to one per pot to evaluate growth. Two pot experiments were carried out, and eight treatments were arranged factorially (2 × 4) in an RCBD, with four replicates (n = 4) for each experiment, giving a total of 64 pots (32 for each crop). The two N sources (UWC and urea) were applied to pots in four different doses: 12.5, 25.0, 37.5, and 50.0 mg dm-3.
Lettuce shoots were harvested after 30 DAT, while the broccoli was harvested after 90 DAT. The plant stems were cut at soil level to evaluate the fresh biomass, and the samples were then dried in a forced-air oven (Tecnal® TE 394-3; Tecnal Scientific Equipment, Piracicaba, Brazil) at 65°C until a constant mass was obtained. The dried shoots were then pulverized using a Wiley mill equipped with a stainless-steel chamber and blades (Marconi® MA 360; Marconi Equipment Laboratories Ltd., Piracicaba, Brazil). The total N concentration was determined using the Kjeldahl method [31]. Based on the concentrations of N in the aerial parts of both plant species and their respective values of dry biomass, the N accumulations of these elements were calculated (mg per plant).
2.4 Data analysis
Data were analyzed using the Shapiro-Wilk test, assuming normality, and using the Fisher tests, assuming variance homogeneity (P < 0.05). When F values were significant (P < 0.05), the data were subjected to regression analysis, and equations were adjusted using the linear and polynomial models of the SigmaPlot 14.0 statistical package (Systat Software Inc., USA). Mean values were compared using Tukey’s HSD test (P < 0.05). For data interpretation, the equations with significance (P < 0.05) and the highest coefficients of determination (R2) were selected.
