Research design and study area
A cross-sectional research design was employed to establish childcare practices and how they influence the nutritional status of children aged 6 to 23 months. Caregivers with children aged 6 to 23 months resident in Munali constituency of Lusaka district, in Zambia, were enrolled in the study. The study excluded children who were sick at the time of data collection and children whose caregivers did not consent to participate in the study.
Lusaka district is a cosmopolitan city with a mixed representation of economic classes. The area has all the socio-economic classes, cultural and religious groupings, hence, was an ideal site for establishing the impact of childcare practices on nutritional status of children aged 6 to 23 months.
Sample size and Sampling
The sample size was calculated using the following formula; n = Z2pq/d2. Where: n = sample size; Z = standard normal deviation which is 1.96; p = proportion of the target population more likely to receive a diverse diet in urban areas which is at 17 percent (CSO, 2014); q = population without the characteristic being measured (1 – p); d = margin of error 0.05
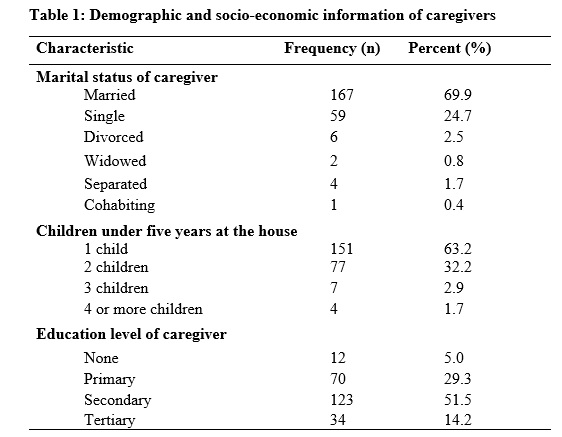
Multi-stage sampling technique was employed to arrive at the required sample size. In the first stage, simple random sampling was used to select two wards from four wards in Munali constituency. Chakunkula and Chainda wards were selected. In the second stage, communities were randomly selected from each ward. In the third stage, purposive sampling was used to identify households with children aged 6 to 23 months old. This was done with the help of community health workers. Lists of households were drawn from each community. Simple random sampling was used to sample households from the list. A total of 121 caregivers/child pair was sampled from Chakunkula ward while 118 caregiver/child pair were sampled from Chainda ward giving a total of 239 participants.
Data collection procedures
Data was collected using a structured questionnaire that comprised of subsections with questions on socio-economic and demographic characteristic, breastfeeding, complementary feeding practices, health seeking practices, and anthropometric measurements. The questionnaire was pre-tested for accuracy and clarity on 10 caregivers who had children aged 6 to 23 months living in an area with similar settings to the study site. Before the onset of interviews and data collection, community leaders from the selected communities were informed about the study. Introductions were done and permission sought from the mothers or caregivers. If the mother or caregiver agreed to participate in the study, they were required to sign a consent form.
A 24 hour dietary recall was used to collect data on the foods that were consumed by the child in the last 24 hours. The caregiver was required to provide information on the foods and drinks that were given to the child in the last 24 hours. The information given by the caregiver was used to determine the diversity of the diet given to the child. The diversity of the diet was based on the seven foods recommended by the World Health Organisation (WHO). According to WHO [15], the food groups include: 1) grains and tubers, 2) legumes and nuts, 3) dairy products, 4) flesh products, 5) eggs, 6) vitamin A rich fruits and vegetables, 7) other fruits and vegetables. Consumption of any amount of food or liquid was counted except where it was used as a condiment.
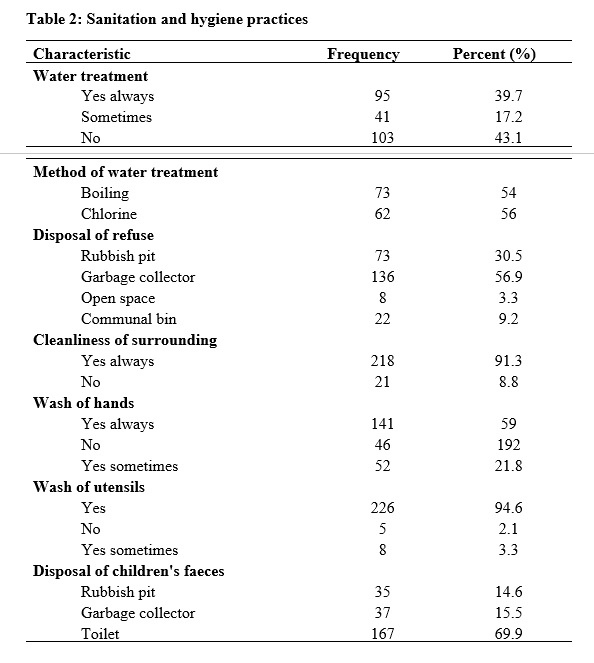
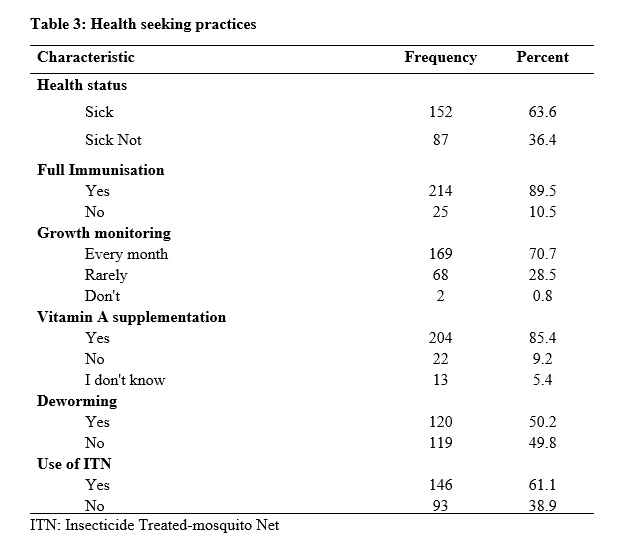
The data that was collected on childcare practices included; feeding practices, health seeking behaviour, source of water, sanitary conditions and hygiene practices. Adequate childcare practices entails appropriate feeding practices. According WHO [15], appropriate feeding practices means introduction of complementary feeding at six months after birth, recommended meal frequency and dietary diversity.
Anthropometric measurements
Weight and height or length measurements were used for determining weight for height (wasting), height for age (stunting) and weight for age (underweight) z scores. The weight of the children was determined using an electronic Seca scale model: 874 1021659. For children who could not stand alone, this was done by first determining the weight of the caregiver by making her stand alone on the scale. Then later the care giver was weighed again while holding the baby in her/his arms. The baby was required to wear only light clothing. Thereafter, the initial weight of the mother was subtracted from the second caregiver-baby weight to determine the weight of the baby. For children who could stand on their own, they were made to stand on the scale to determine their weight. Children’s weight was determined to the nearest 0.1 kg. Children’s height/length was determined using height/length boards. The length of the children was taken in the recumbent position. The measurement was taken to the nearest 0.1 cm. Age of the children was given by the caregiver and then verified using the under-five card.
Statistical analysis
Statistical Package for Social Sciences (SPSS) version 20 was used to analyse data. The analysis generated both descriptive and inferential statistics.
In order to establish the impact of childcare practices on nutritional status, the study quantified appropriate feeding, health seeking behaviour, source of water, sanitary conditions and hygiene practices as independent variables. Minimum dietary diversity is defined as the proportion of children aged 6 to 23 months who receive foods from at least four out of seven food groups, [16]. Scoring of the dietary diversity was calculated using a score of 1 for those who consumed the food item, 0 for those who did not consume the food item in the previous 24 hours. The dietary diversity score ranges from zero to seven. Determination of meal frequency of the children was based on WHO guidelines. On a population basis, the recommended meal frequencies assuming a diet with energy density of 0.8kcal per gram in the last 24 hours should be: (1) 2 to3 meals per day for infants 6 – 8 months; (2) 3 to 4 meals per day for infants aged 9 – 11 and children 12 – 23 months [17] . For non-breastfed children the minimum meal frequency is 4. The proportion of children 6 to 23 months of age who receive a minimum dietary diversity and minimum meal frequency (apart from breast milk) are said to have a minimum acceptable diet. The minimum acceptable diet indicator combines standards of dietary diversity and feeding frequency by breastfeeding status. The numerator includes only those children who received both the minimum dietary diversity (MMD) and the minimum meal frequency (MMF) for child’s breastfeeding status, [15]. Minimum acceptable diet is calculated as shown in the equation below:
MAD = Children who had at least MDD and MMF divided by Breastfed children aged 6 -23 months
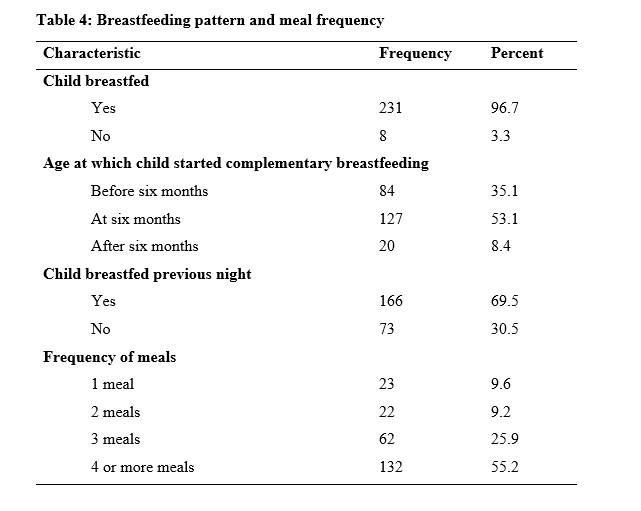
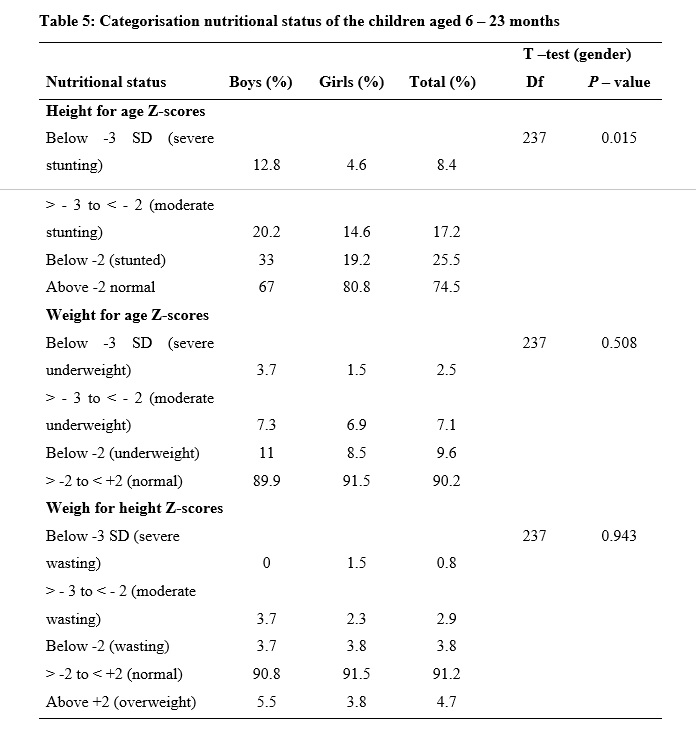
To analyse anthropometric data, first, the WHO AnthroPlus was used to transform anthropometric data into weight for height (WHZ), height for age (HAZ) and weight for age (WAZ) scores according to WHO child growth standards and Z-score cut-off points. This was done in order to determine the nutritional status of the children. The WAZ, HAZ and WHZ data were then exported to SPSS for further analysis. Afterwards the anthropometric data was exported to SPSS. Descriptive statistics were used to describe data on nutritional status, feeding practices, socio-demographic characteristics, environmental conditions and health seeking behaviour. Study results were presented using tables, charts and graphs.
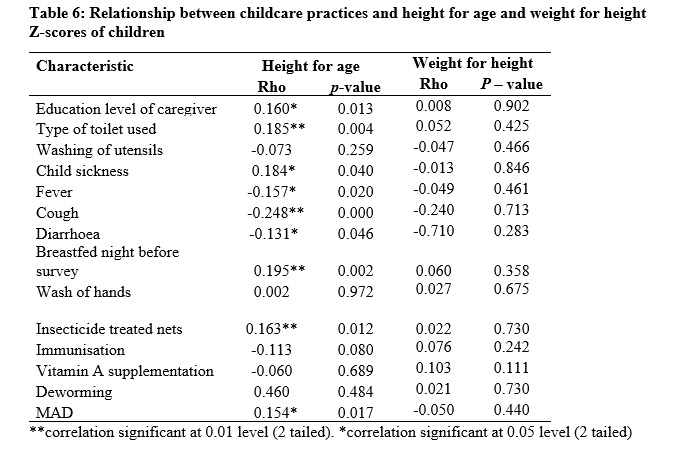
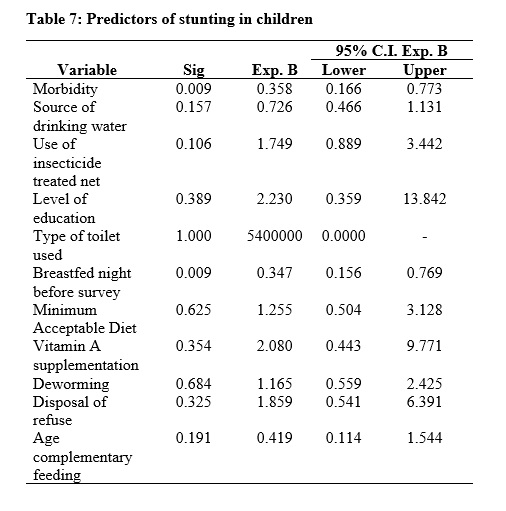
Student T-test was used to establish if there were any differences in nutritional status between male and female children in the sampled children. Determinants of nutritional status of children were established using a binary logistic regression, the dependent variable was height for age Z-score. This variable was dichotomised so that zero denoted stunting and one denoted not stunted (normal). The choice of independent variables to include in the binary logistic regression was determined by first running a bivariate correlation analysis between nutritional status and independent variables. Those which were significantly correlated with the former were automatically included in the model. Other independent variables were included based on plausible biological reasons as well as using the literature.