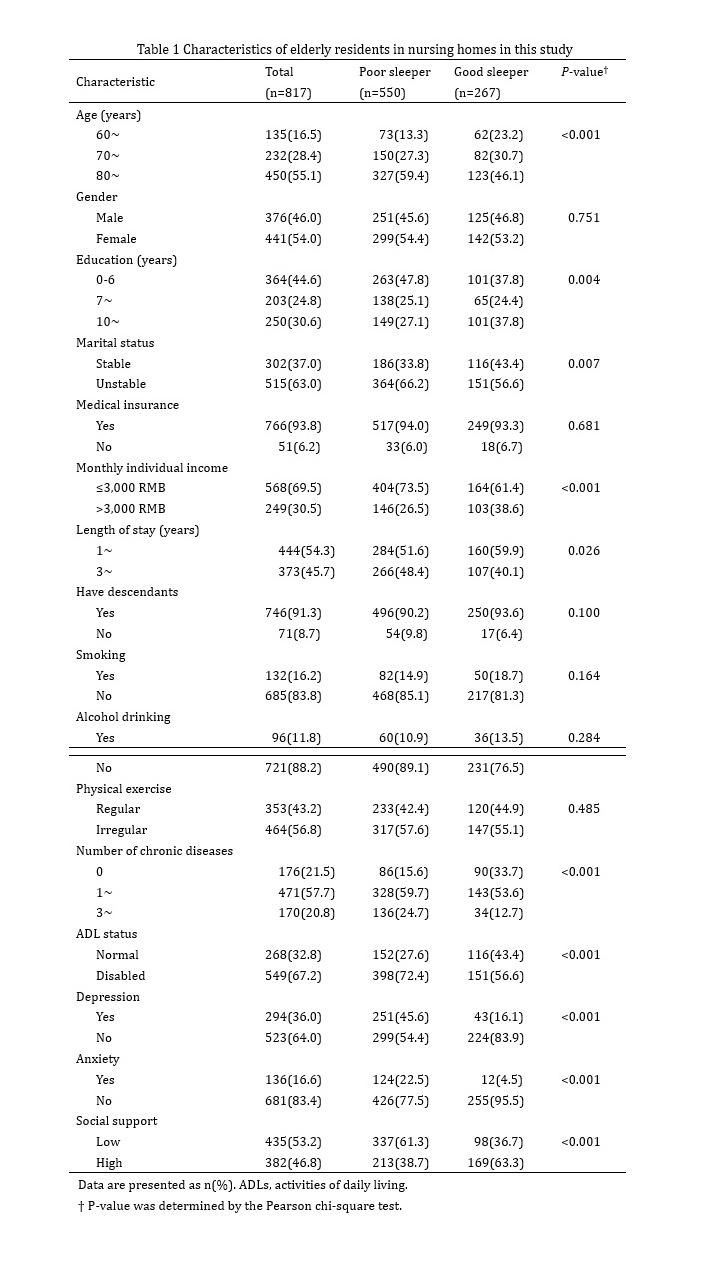
3.1 Characteristics of the study sample
In total, 817 elderly residents living in nursing homes were included in this study. Among them, more than half of participants aged 80 years and above. A total of 54.0% of subjects were female, and 46.0% were male. Approximately 40% of the participants had completed less than 6 years of education and had stable marriages. Approximately one-third reported monthly individual incomes of more than 3,000 RMB. A minority of participants engaged in cigarette smoking and alcohol drinking and had no chronic diseases. Approximately 36.0% of individuals had depressive symptoms, and 16.0% had anxiety symptoms.
There were significant statistically significant differences between poor sleepers and good sleepers in age, education, marital status, monthly individual income, length of stay, number of chronic diseases, depression, anxiety, social support and ADL status (all P<0.05). Poor sleepers were seemingly those who were older in age, had lower education, had unstable marriages, had lower monthly individual incomes, had longer lengths of stay, had at least one type of chronic disease, had depression, had anxiety, had lower social support and had disabled ADLs. The results are presented in Table 1 (see Supplementary Files).
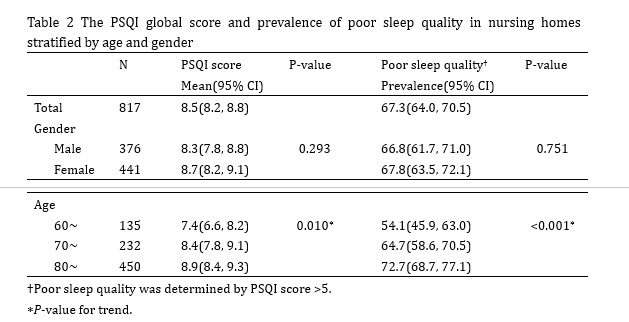
3.2 Prevalence of poor sleep quality
The mean global PSQI score was 8.5 points overall (95% CI: 8.2, 8.8), 8.3 points in males (95% CI: 7.8, 8.8) and 8.7 points in females (95% CI: 8.2, 9.1). There was no statistically significant difference in the PSQI score between males and females (P=0.293). The total PSQI score increased with increasing age, from 7.4 points (95% CI: 6.6, 8.2) in subjects aged 60-69 years to 8.9 points (95% CI: 8.4, 9.3) in subjects aged ³80 years (P for trend=0.010). A total of 550 individuals had a total PSQI score greater than 5, and the overall prevalence of poor sleep quality was 67.3% (95% CI: 64.0, 70.5%). The prevalence of poor sleep quality was 66.8% (95% CI: 61.7, 71.0%) in males and 67.8% (95% CI: 63.5, 72.1%) in females. The prevalence rate was also increased by increasing age, ranging from 54.1% (95% CI: 45.9, 63.0%) in participants aged 60-69 years to 72.7% (95% CI: 68.7, 77.1%) in participants aged ³80 years (P for trend <0.001). The results are shown in Table 2 (see Supplementary Files).
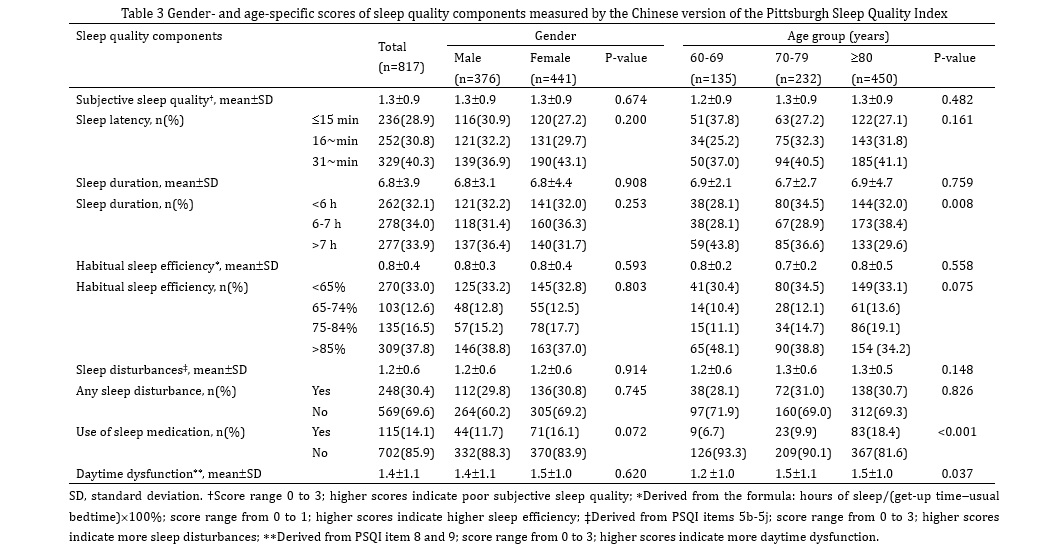
3.3 Components of sleep quality
Most of the participants went to bed at 9 PM and woke up at approximately 6 AM. The average bedtime of the participants was 9.1±3.5 hours, and the average sleep duration was 6.8±3.9 hours. Most subjects could not fall asleep within 30 minutes. The average sleep efficiency of the participants was 80.0%. Approximately 85% of subjects never used sleep medication. The mean scores for subjective sleep quality, sleep disturbance and daytime dysfunction were 1.3±0.9, 1.2±0.6 and 1.4 ±1.1, respectively.
No statistically significant differences were observed between males and females on all components of sleep quality. More older residents than younger people have used sleep medication. Moreover, older adults have more daytime dysfunction than younger individuals do. No significant differences were obtained in sleep latency, sleep efficiency or sleep disturbance between age groups. The results are shown in Table 3 (see Supplementary Files).
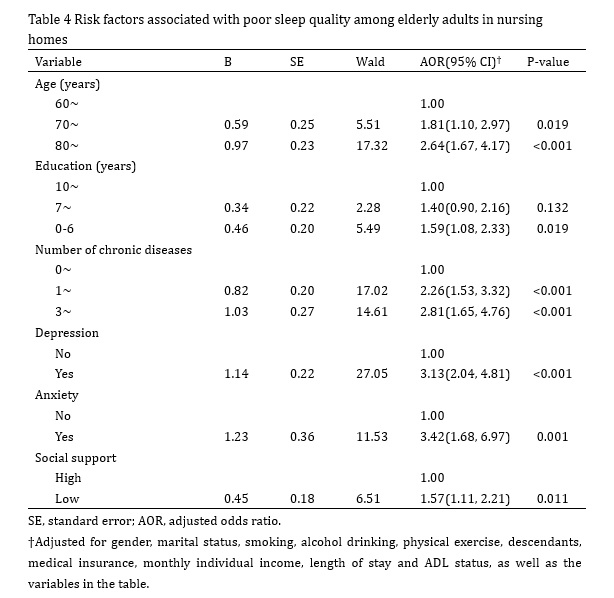
3.4 Risk factors for poor sleep quality
Multivariate binary logistic regression analysis results suggest that age between 70 to 79 years (AOR: 1.81, 95% CI: 1.10, 2.97) or 80 years and above (AOR: 2.64, 95% CI: 1.67, 4.17) increased the risk of poor sleep quality compared to age between 60 and 69 years after adjustments were made for other confounding factors. Moreover, similar results also indicated that participants with 0-6 years of education (AOR: 1.59, 95% CI: 1.08, 2.33), one to two kinds of chronic diseases (AOR: 2.26, 95% CI: 1.53, 3.32) or three or more kinds of chronic diseases (AOR: 2.81, 95%: 1.65, 4.76), depression (AOR: 3.13, 95% CI: 2.04, 4.81) or anxiety (AOR: 3.42, 95% CI: 1.68, 6.97) and lower social support (AOR: 1.57, 95% CI: 1.11, 2.21) were more likely to report poor sleep quality after adjustments were made for other variables. The results are shown in Table 4 (see Supplementary Files).
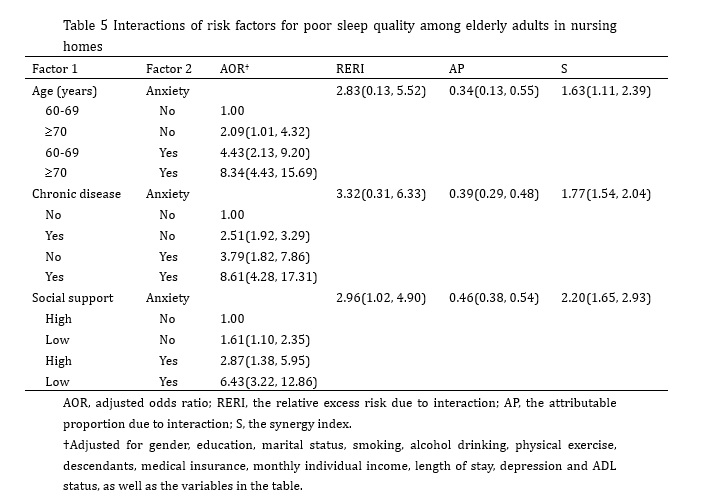
3.5 Interactions of risk factors for poor sleep quality
In this study, Andersson’s Excel was used to detect the interactions and calculate the effect size between risk factors for poor sleep quality. The adjusted factors included all variables (except for two), the interactions among which we would examine. Additional interactions were detected between the following variables: older age and anxiety, with an RERI of 2.83 (95% CI: 0.13, 5.52), an AP of 0.34 (95% CI: 0.13, 0.55) and an S of 1.63 (95% CI: 1.11, 2.39); chronic disease and anxiety, with an RERI of 3.32 (95% CI: 0.31, 6.33), an AP of 0.39 (95% CI: 0.29, 0.48) and an S of 1.77 (95% CI: 1.54, 2.04); and social support and anxiety, with an RERI of 2.96 (95% CI: 1.02, 4.90), an AP of 0.46 (95% CI: 0.38, 0.54) and an S of 2.20 (95% CI: 1.65, 2.93). No statistically significant interactions were found between other factors after adjusting for confounders. The results are shown in Table 5 (see Supplementary Files).